Synthetic Line Profiles for Pulsating Red Giants
Synthetic Line Profiles for Pulsating Red Giants111This work was supported by FWF-project P14365–PHY.
Abstract
Pulsation influences atmospheric structures of variable AGB stars (Miras) considerably. Spectral lines of the CO =3 vibration–rotation bands (at 1.6 m) therefore have a very characteristic appearance in time series of high-resolution spectra. Coupled to the light cycle they can be observed blue- or red-shifted, for some phases even line doubling is found. This is being explained by radial pulsations and shock fronts emerging in the atmospheres. Based on dynamic model atmospheres synthetic CO line profiles were calculated consistently, reproducing this scenario qualitatively.
1 Molecular lines in high-resolution IR spectra of Miras
Asymptotic Giant Branch (AGB) stars are low- to intermediate mass stars in a late stage of their evolution. They appear as luminous late-type giants in the HRD. Due to the large extension of their atmosphere, they have red colors and effective temperatures of less than 3500 K. Stars at the upper part of the AGB are characterized by strong radial pulsations with long periods and large amplitudes (Mira variables). The pulsation of layers inside the star leads to a levitation of the atmosphere. In such a cool environment, molecules and even dust can efficiently form and affect the spectra very distinctively. The pulsation of the stellar interior triggers sound waves which become strong radiating shock waves as they reach the outermost layers of the star. This results in complicated structures (in density and velocity) within the extended AGB atmospheres.
High-resolution spectroscopy in the near-IR is the major tool to study atmospheric kinematics of Miras (Lebzelter this volume). Numerous molecular lines dominate the spectra of AGB stars in the NIR, where they are bright and well observable. Originating in separated regions of various depths, lines of different molecules and bands can be used to probe radial velocities (RV) there by their (Doppler) shift in wavelength. CO is especially useful for these kind of studies (HinHR82 , Nowot05a ), being abundant in all kinds of chemistries (O-, C-rich, S stars) and present throughout AGB atmospheres and envelopes.
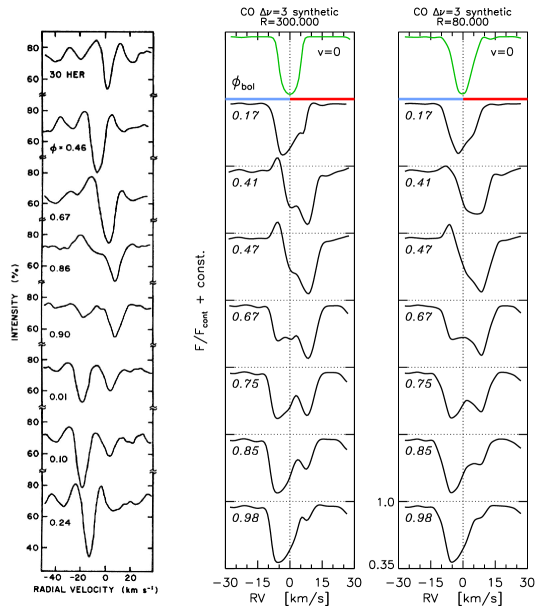
By observing CO lines of the =3 vibration–rotation bands at 1.6 m (H-band), one can sample RVs of deep photospheric layers in Miras (due to their excitation energies and a minimum of continous absorption). As these layers are dominated by the pulsation of the stellar interior, the CO second overtone lines show a characteristic behaviour. Figure 1 (left) shows a time series of averaged line profiles for the S-type Mira Cyg of different phases during a lightcycle. Coupled to the variability in brightness (numbers denote visual phases with =0 corresponding to light maximum), periodic variations in wavelength shift are found. While a blue-shifted line comes from outflowing matter, a red-shifted one indicates infalling matter.222Note, that for observers RVs are defined as being negative for outflow (towards the observer), which is also adopted for the models for easier comparison. Around visual maximum even line doubling can be observed. This leads to discontinous ‘S-shaped’ RV-curves (e.g. Fig. 12 of HinHR82 ), usually interpreted as being due to shock fronts running outwards through the atmosphere. For a detailed description and interpretation of this scenario the reader is refered to Sect. III. and VI.a. of HinHR82 . The results of HinSH84 and Fig. 1 of LebzH02 – showing a composite of measured RVs for all Miras studied so far – suggest, that the shape and the amplitude (RV 25 km/s) of this RV-curve is probably a general characteristic of Miras, independent of their periods or spectral types. Realistic models should therefore be able to reproduce this feature.
2 Dynamic model atmospheres and synthetic line profiles
For a realistic description of the complex and temporally variable atmospheric structures of Miras, a combined and self-consistent solution of hydrodynamics, frequency-dependent radiative transfer and a detailed time-dependent treatment of dust formation is needed (Höfner this volume). Because of the diverse movements of atmospheric layers in different depths, a spherical radiative transfer including the influence of velocities on the interaction between matter and radiation is essential to model the complex line profiles and their variations.
High-resolution spectra were calculated to reproduce observations of the C-rich Mira S Cep (HinkB96 ), based on a dynamic model atmosphere (as described in HoGAJ03 ) with adequate stellar parameters.333=104, =1, =2600 K, C/O=1.4, P=490 d, =4 km/s Details, plots of the atmospheric spatial structure and various synthetic line profiles can be found in Nowot05a and Nowot05b . Since observing second overtone CO lines is difficult in C stars due to contamination of this spectral region by other molecules (CN, C2), no corresponding studies have been published yet. Nevertheless, we tried to synthesize such line profiles as well, which should show a similar behaviour for all spectral types (M/S/C) and sample the pulsational layers like CN (see Nowot05a , Nowot05b ). The CO 5–2 P30 line from the line list of GoorC94 at 6033.8967 cm-1 was chosen for the modelling. Included in the calculations is the opacity of dust (pure amorphous carbon, no SiC).
Figure 1 (right) shows a time series of synthetic profiles. The plotted phases are chosen for a direct comparison with the observed ones of the representative Mira Cyg. Bolometric (not visual) phases are also given – for a clear distinction these are written italic throughout the text. A difference of 0.25 in ‘phase’ between the two series is needed to match line profiles of the same shape. To get an idea of the typical line width, a profile calculated without taking velocities into account in the radiative transfer is plotted on top. The line strengths are comparable and the synthetic lines reproduce the typical behaviour pattern reasonably well. Line shifts are smaller because of the lower velocities in the model, also the doubling444Expected, as shock fronts are seen in plots of mass shells for these dynamic models, e.g. Fig. 2b of HoGAJ03 . is less pronounced (compare phases 0.01/0.75), but still clearly visible. A blue-shifted emission feature appearing before the line doubling phases can also be seen in the modelled profiles (0.86/0.47).
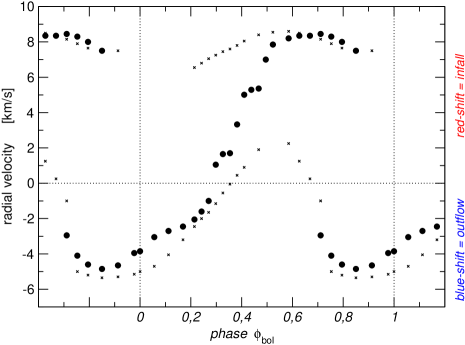
Figure 2 shows RVs derived from synthetic spectra of 23 calculated phases during one lightcycle, plotted repeatedly. Line shifts were measured from deepest points of splines fitted through the spectral points. RVs of two other pulsational cycles duplicate these curves, they are not plotted. The developement of a few components can be followed at higher resolution. The splitting during phases 0.2–0.45 (which is not being observed) turns into a continous transition from blue- to red-shifts for lower resolution, as the two components of the line profile melt into one broad feature (phase 0.41 in Fig. 1). Taking into account the above mentioned shift of 0.25 between visual phases of observations and bolometric ones of the model, the resulting RV-curve compares passably to observed ones (e.g. Fig. 12 of HinHR82 ). The ‘S-shape’ is reproduced as well as the asymmetry w.r.t. RV=0, line doubling appears for a similar time interval ( 0.2). The weak component with RV 0 km/s seen around phases of 0.6–0.7 at higher resolution, can be recognised in Fig. 1 of LebzH02 and also very slightly in the observed Cyg profile for phase 0.90. A more detailed analysis shows that the synthetic CO lines emerge in depth layers of =0.8–1.3 with gas temperatures of 2200–3500 K. Although the amplitude RV14 km/s is a little too low, this behaviour could be reproduced for the first time by consistent calculations. For more details and results concerning other molecular lines, the reader is referred to Nowot05a and Nowot05b .
References
- (1) D. Goorvitch, C.Jr. Chackerian: ApJS 91, 483 (1994)
- (2) K.H. Hinkle, C. Barnbaum: AJ 111, 913 (1996)
- (3) K.H. Hinkle, D.N.B. Hall, S.T. Ridgway: ApJ 252, 697 (1982)
- (4) K.H. Hinkle, W.W.G. Scharlach, D.N.B. Hall: ApJ Suppl. 56, 1 (1984)
- (5) S. Höfner, R. Gautschy-Loidl, B. Aringer, U.G. Jørgensen: A&A 399, 589 (2003)
- (6) T. Lebzelter, K.H. Hinkle: ASP Conf. Series 259, 556 (2002)
- (7) W. Nowotny, B. Aringer, S. Höfner et al.: A&A 437, 273 (2005)
- (8) W. Nowotny, T. Lebzelter, J. Hron, S. Höfner: A&A 437, 285 (2005)