Email: cola@mporzio.astro.it
The SZ effect from cluster cavities
In this Letter we derive the SZ effect (SZE) observable in the direction of the giant X-ray cavities found in the atmospheres of galaxy clusters. We explore specifically the case of the cluster MS0735.6+7421. The SZE produced in the cavities embedded in the cluster thermal atmosphere is of non-thermal nature: it dominates the overall cluster SZE at the frequency – at which the thermal SZE from the cluster vanishes – and appears, at sub-mm frequencies, as a negative SZE located only in the regions of the intracluster space occupied by the cavities. We show that SZ observations, combined with X-ray and radio data, are able to shed light on the morphology, on the physical structure, on the dynamics and the origin of these recently discovered non-thermal features of galaxy clusters. These studies will be also relevant to determine the impact of specific events of the nature of cavities on the use of SZ and X-ray clusters as probes for cosmology and for the large scale structure of the universe.
Key Words.:
Cosmology; Galaxies: clusters; Cosmic Microwave Background1 Introduction
Cavities with diameters ranging from a few to a few hundreds of kpc have been observed by Chandra in the X-ray emission maps of several galaxy clusters and groups (see, e.g., Birzan et al. 2004, McNamara et al. 2005). These cavities are supposed to contain high-energy plasma with a non-thermal spectrum and are currently studied by combining X-ray and radio observations of galaxy clusters. The enthalpy (free energy) of such cavities should be of the order of erg and seems to scale with the cooling X-ray luminosity and with the radio power of the host cluster (Birzan et al. 2004). Some specific systems show even the existence of giant cavities, as it is the case of the cluster MS0735.6+7421 (McNamara et al. 2005), with radii of size kpc which produce a work erg to balance each cavity against the average surrounding pressure erg m-3 of the thermal intracluster (IC) gas. The hot regions found around these cavities indicate that the IC gas near the cavities is being heated by the shocks associated to the edge of the cavities. The cavities seem to be filled by the radio lobes of the central radio source suggesting that the IC gas is displaced and compressed by the advancing radio-emitting plasma. The plasma contained in the advancing radio lobes is likely to be relativistic with a power-law electron spectrum with a typical index (see, e.g., Longair 1993).
While the properties of these cavities and of the relativistic plasma they contain is usually studied
by combining high-resolution X-ray and radio maps, we explore here, as an alternative strategy, the
consequences of the Compton scattering between the high-energy electrons filling the cavities and the
CMB photon field. Such a scattering produces a relativistic non-thermal Sunyaev-Zel’dovich effect
(SZE) (see Sunyaev & Zel’dovich 1972, 1980; Colafrancesco et al. 2003) whose amplitude, spectral and
spatial features depend on the overall pressure and energetics of the relativistic plasma in the
cavities.
A general approach to the SZE produced by plasma bubbles observed in several clusters has been
recently presented by Pfrommer et al. (2005) who investigated the role of physically different
scenarios for the composition of the plasma bubbles. They suggested - in this context - that there is
a realistic chance to detect an SZ flux decrement from bubbles dominated by relativistic particles.
We will show in the following that detailed SZ observations of giant cavities can provide important,
unique (and complementary to X-rays) constraints to the physics and to the evolution of the cavities
in the atmospheres of groups and clusters of galaxies.
We focus here on the specific case of the giant cavities found in the cluster MS0735.6+7421, for which
the available information on the cavity’s dimension and internal pressure provide realistic estimates
of the associated SZE spectral and spatial signals.
The relevant physical quantities are calculated using km s-1 Mpc-1 and a flat,
vacuum-dominated CDM () cosmological model.
2 The SZ effect produced from cluster cavities
We compute here the spectral and spatial features of the overall SZE seen along the line of sight (hereafter los) to a cluster cavity. This is given by the combination of the thermal SZE from the IC ambient medium and the SZE from the cavity plasma. A possible kinematic SZE acts here as a source of systematic bias (see, e.g., Colafrancesco et al. 2003, Pfrommer et al. 2005).
2.1 The SZ effect from a cluster cavity
The generalized expression for the SZ effect which is valid in the Thomson limit for a generic electron population in the relativistic limit and includes also the effects of multiple scatterings and the combination with other electron population in the cluster atmospheres has been derived by Colafrancesco et al. (2003) and we will refer to this paper for technical details. According to these results, the induced spectral distortion observable in the direction of the cluster cavity can be written as
| (1) |
where is the CMB temperature and the Comptonization parameter is given by
| (2) |
in terms of the pressure contributed by the electrons present in the cluster cavities. The function , with , for the electron population in the cavity can be written as
| (3) |
in terms of the photon redistribution function and of , where we define the quantity
| (4) |
(see Colafrancesco et al. 2003, Pfrommer et al. 2005) which is the analogous of the average temperature for a thermal population (for a thermal electron distribution obtains, in fact). The photon redistribution function with , in terms of the CMB photon frequency increase factor , depends on the momentum ( normalized to ) distribution, of the electrons which are filling the cavity.
We describe here the relativistic electronic plasma within the cavity by a single power-law electron population with the momentum spectrum
| (5) |
where the normalization term is given by
| (6) |
with (analogous results hold for a generic value of ). Such an approximation seems reasonable since the cavities are likely produced by the expanding radio jets of the central radio source. In the calculation of the non-thermal SZE, the relevant momentum is the minimum momentum, of the electron distribution (which is not constrained by the available observations) while the specific value of is irrelevant for power-law indices which are indicated by the electron spectra observed in radio galaxies. The value of sets the value of the electron density as well as the value of the other relevant quantities which depend on it, namely the optical depth and the pressure of the non-thermal population. In particular, the pressure , for the case of an electron distribution as in eq.(5), is given by
(see, e.g., Colafrancesco et al. 2003, Pfrommer et al. 2005), where is the incomplete Beta function (see, e.g., Abramowitz & Stegun 1965). For an electron population with a double power-law (or more complex) spectrum, analogous results can be obtained (see Colafrancesco et al. 2003 for details). Notice that an estimate of the pressure of the non-thermal electrons within the cavity – as obtained by X-ray observations (e.g., McNamara et al. 2005) – yields directly an estimate of the non-thermal electron density from eq.(2.1), given the value of and of the lower momentum of the electron spectrum. The optical depth of the non-thermal electron population within the cavity is then given by
| (8) |
which takes the value along the los to the cavity center.
2.2 The SZE from a cavity embedded in the IC gas
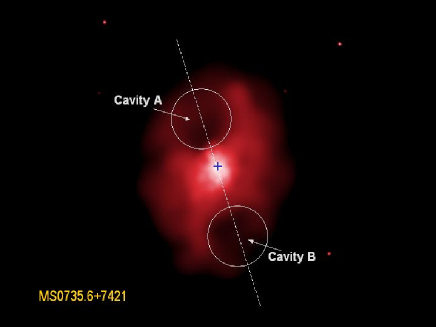
The overall SZE observable along the los through a cluster containing cavities (as shown in Fig.1 for the representative case of the cluster MS0735.6+7421) is the combination of the non-thermal SZE produced by the cavity and of the thermal SZE produced by the surrounding IC gas.
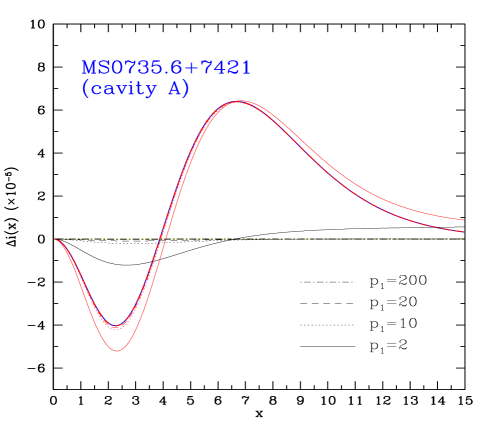
For a proper calculation of the overall SZE, we use the approach described in Colafrancesco et al. (2003) which we do not repeat here for the sake of brevity. Such a general approach is able to describe accurately the overall SZE from the combination of the two different electron populations (non-thermal electrons in the cavity and thermal electrons in the surrounding IC medium) in the full relativistic limit and with the inclusion of multiple scatterings. Figs.2 and 3 shows the spectral and spatial features of the SZE obtained for a case similar to that of the cluster MS0735.6+7421. In our representative and simplified case, we use a thermal electron distribution with an average temperature keV within arcsec from the cluster center (the region containing the cavities) and an IC gas density with a radial distribution given by a -model with which reproduces the thermal pressure profile of the cluster MS0735.6+7421 (see McNamara et al. 2005).
The two cavities are assumed, for simplicity, to be spherical with radius kpc and
with an electron spectrum given by eq.(5) with . We also neglect here - for
simplicity - the effect of the shock (local temperature and density boosts) on the SZE, while we will
address the more complex and general case of a cluster with cavities, radial temperature distribution
and finite shock width in a forthcoming paper (Colafrancesco 2005, in preparation).
The non-thermal electron spectrum is normalized to reproduce a constant pressure in the cavity of
erg cm-3, which corresponds to a relativistic electron density
for a value and a slope
for the relativistic electron spectrum. Given the value of the pressure , the relativistic electron density decreases for increasing values of ,
according to eq.(2.1). Because the pressure value has been obtained from
the properties of the IC gas at the cavity boundaries (see McNamara et al. 2005), it should be likely
considered as a lower limit to the actual pressure within the cavity. As a consequence, the SZE
normalized to the pressure value should also be considered as a lower limit to the
actual SZE produced by the non-thermal electron distribution within the cavity.
Given the cavity pressure and the non-thermal electron spectrum slope ,
the relative SZE takes different amplitudes and spectral features for the values and
which reproduce the pressure (see eq.2.1 and
Fig.2).
The SZE from the cavities increases at low frequencies [i.e. the frequency at which the SZE from the thermal population with pressure is zero,
taking into account also the appropriate relativistic corrections – see Itoh et al. 1998,
Colafrancesco et al. 2003)] for decreasing values of which consistently yield increasing values
of . This is the frequency range where the non-thermal SZE from the cluster cavities
could be optimally detected (see Fig.2), since at high frequencies ,
it is rather low compared to the thermal SZE of the host cluster.
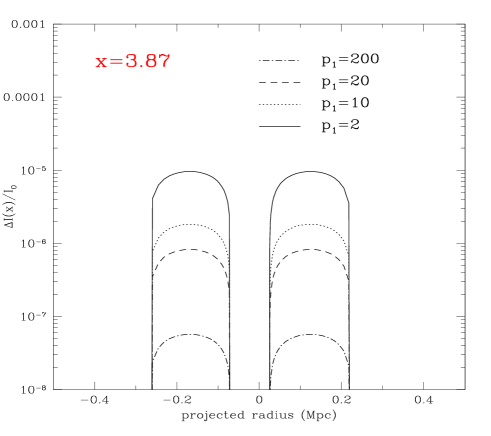
The presence of cavities filled with non-thermal electrons also modify the spatial distribution of the
overall SZE from the cluster. In fact, the thermal SZE seen along the los to the cluster (which has a
gas radial profile as a function of the projected radius
) shows two bumps at the cavity locations for frequencies where the (negative)
non-thermal SZE adds up with the same sign to the (negative) thermal SZE, and shows two depressions
(holes) at the cavity locations for frequencies where the (negative) non-thermal SZE
adds up with the opposite sign to the (positive) thermal SZE. However, at frequencies (which is for ) the overall SZE again shows two bumps at the
cavity locations because the (positive) non-thermal SZE adds up with the same sign to the (positive)
thermal SZE which is found at high frequencies.
An interesting feature of the overall SZE is that at the frequency (for a keV cluster) where the thermal (including relativistic corrections) SZE is zero, the overall SZE from the cluster is dominated by the non-thermal SZE produced in the cavities: this is negative in sign, has an amplitude which increases for decreasing values of and is spatially located only in the cavity regions (see Fig.3). Thus, the observation of the SZE from a cluster containing X-ray cavities at the frequency of the zero of its thermal SZE provides crucial information directly on the physics of the electron population residing within the cavities and on their spatial distributions. This fact provides a unique tool to study the pressure content, the energetics and the spatial distribution of the non-thermal plasma contained in the cavities without any disturbance by the intervening and surrounding IC medium.
3 Discussion and conclusions
We have shown in this Letter that giant X-ray cavities discovered in galaxy clusters can be potentially and effectively studied by using the SZE produced by the combination of the cluster thermal atmosphere and of the non-thermal plasma contained in the cluster cavities. Our results are consistent with the general treatment of the SZE from plasma bubbles described by Pfrommer et al. (2005). We will emphasize, nonetheless, in the following the main new results of our work. We applied our analysis to the specific, reference case of the cluster MS0735.6+7421 which hosts two giant cavities for which information on the pressure, energetics and enthalpy are available. These information allowed us to go beyond the general description level and to make realistic predictions of the SZE from giant cavities in clusters. We also emphasize that our predictions are likely to be considered as lower limits to the actual SZE expected from these regions. At frequencies there is the maximum amplitude of the non-thermal SZE from the cavity (for a given electron spectrum and pressure). This produces a bump in the overall SZE at the cavity location and the addition of a negative SZE signal to the thermal SZE of the cluster, a result which is consistent with the findings of Pfrommer et al. (2005). At we have the opposite effect but with smaller amplitudes: a depression in the SZE at the cavity location and the addition of a negative SZE signal to the positive thermal SZE. We emphasize that observations at the frequency (which is for a keV cluster) provide a unique tool to probe the overall energetics, the pressure and the spatial extent of the non-thermal plasma contained in the giant cavity, an observation which is rich in information and complementary to those obtained by X-ray and radio observations of cluster cavities. At this frequency, in fact, the overall SZE from the cluster reveals only the Compton scattering of the electrons residing in the cavities without the presence of the intense thermal SZE observable at lower and higher frequencies. Hence, the SZE from a cluster containing cavities (like the case of MS0735.6+7421) shows up uncontaminated at frequencies GHz: it is less extended than the overall cluster SZE because it is only emerging from the cavity regions and it is also well separable because the cavities are well defined in both X-rays and SZ images. In addition, we also emphasize that the observation of the zero of the non-thermal SZE in the cavities (which is found at high frequencies, depending on the value of or equivalently on the value ) provides a definite way to determine uniquely the total pressure (see Colafrancesco et al. 2003) and hence the nature of the electron population within the cavity, an evidence which adds crucial, complementary information to the X-ray and radio analysis. A plausible source of bias to these observations could be provided by a possibly relevant kinematic SZ effect due to the cluster peculiar velocity (see Colafrancesco et al. 2003, Pfrommer et al. 2005 for a discussion). However, we have shown that the SZE from the giant cavities in a cluster like MS0735.6+7421 can be effectively studied at frequency where it is not affected by the thermal SZE and it is only marginally affected by a possible kinematic SZE even at a level of a few hundreds km/s (see Fig.3).
Our study shows more generally that the combination of high spatial resolution and high sensitivity SZ observations (even with small field of view) with X-ray and radio data will definitely shed light on the morphology, on the physical structure, on the dynamics and the origin of these recently discovered non-thermal features of galaxy clusters. These studies will be also relevant to determine the impact of specific events of the nature of cavities on the use of SZ and X-ray clusters as probes for cosmology and for the large scale structure of the universe.
Acknowledgements.
The author thanks the Referee for useful comments. This work is supported by PRIN-MIUR under contract No.2004027755003.References
- (1) Abramowitz, M. and Stegun, I.A. 1965, ‘Handbook of Mathematical Functions with Formulas, Graphs and Mathematical Tables’, Dover Book, N.Y.
- (2) Birzan, L., Rafferty, D.A., McNamara, B.R. et al. 2004, ApJ, 607, 800
- (3) Colafrancesco, S., Marchegiani, P. & Palladino, E. 2003, A&A, 397, 27
- (4) Itoh, N., Kohyama, Y. & Nozawa, S. 1998, ApJ, 502, 7
- (5) Longair, M. 1993, ‘High Energy Astrophysics’, Cambridge Univ. Press, Cambridge
- (6) McNamara, B.R., Nulsen, P.E.J., Wise, M.W. et al. 2005, Nature, 433, 45
- (7) Pfrommer, C., Ensslin, T. & Sarazin, C.L. 2005, A&A, 430, 799
- (8) Sunyaev, R.A. and Zel’dovich, Ya.B. 1972, Comments Astrophys. Space Sci., 4, 173
- (9) Sunyaev, R.A. and Zel’dovich, Ya.B. 1980, ARA&A, 18, 537