Detecting Clusters of Galaxies at High Redshift with the Spitzer Space Telescope
Abstract
We present an infrared adaptation of the Cluster Red-Sequence method. We modify the two filter technique of Gladders & Yee (2000) to identify clusters based on their color. We apply the technique to the 4 degree2 Spitzer First Look Survey and detect 123 clusters spanning the redshift range . Our results demonstrate that the Spitzer Space Telescope will play an important role in the discovery of large samples of high redshift galaxy clusters.
Spitzer Science Center, University of Toronto, Spitzer Science Center
1. Introduction

Early type (elliptical) galaxies in any given cluster have a similar color almost independent of their magnitude. If a color-magnitude diagram is constructed using two filters that span the rest-frame break, cluster early-types form a distinctive red sequence comprised of the brightest, reddest galaxies at a given redshift. Clusters can therefore be detected as overdensities in a simultaneous projection of galaxy angular position, color and magnitude. Furthermore, the color of the red sequence itself provides a precise estimate of the redshift of the detected cluster (Gladders & Yee 2000). The Cluster Red-Sequence (CRS) technique is extremely insensitive to projection effects, because random projections do not exhibit the necessary red sequence signature in the color-magnitude plane. Cluster surveys employing the CRS algorithm have traditionally been carried out using an combination (Gladders & Yee 2005).
Applying the CRS technique to higher redshift is an obvious next step. At , the z′ filter is no longer redward of the rest-frame break. Therefore, to detect early-types at higher redshift, a redder filter must be employed. Covering large areas of sky in the NIR from the ground is a daunting proposition because of the bright NIR sky background and current dearth of large format NIR cameras. The Spitzer Space Telescope offers a promising alternative. Here we present results from the First Look Survey (FLS) utilizing an filter combination.
Color-Magnitude Relation
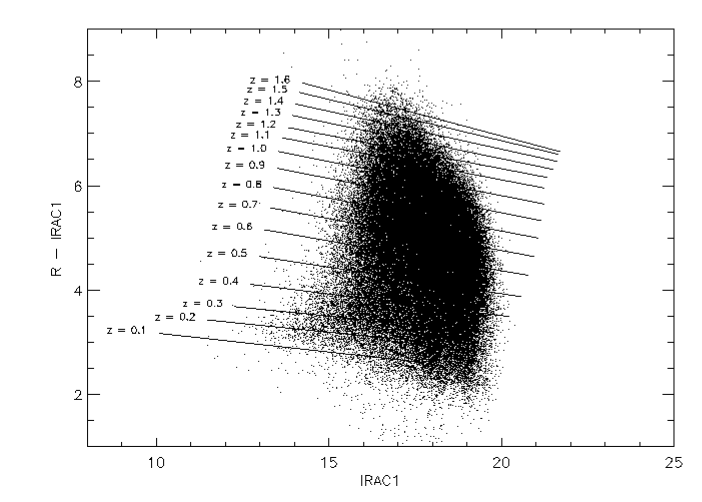
As an illustration of the overall depth of the FLS, and the expected colors of early-type galaxies, Figure 2 shows the color-magnitude diagram for all galaxies in the 4 degree2 Main Field. The IRAC component of the FLS totals 60s of coverage, reaching a survey depth of about on the Vega magnitude scale. The R-band component was obtained at the Kitt Peak 4m Mayall Telescope (Fadda et al. 2004).
The solid lines show the expected colors of early-types from models generated using the code of Bruzual and Charlot (2003). The slight slope is a reflection of the well-known color-mass-metallicity effect; fainter, less massive galaxies appear bluer in color.
Photometric Redshift Accuracy
Figure 2 shows the photometric redshift (inferred from the color) versus the spectroscopic redshift, for each of 26 clusters for which a spectroscopic redshift of a red-sequence galaxy was available. The key shows the source of each of the spectra. The large symbols indicate clusters for which more than one spectroscopic redshift was measured.
The photometeric and spectroscopic redshifts are in excellent agreement, with an r.m.s. dispersion of . This is an accuracy comparable to the best four (or more) passband photometric studies. The advantage here is, of course, that one is determining a photometric redshift for each cluster by calculating a mean color, averaging over many early-type galaxies with intrinsically similar color at the same redshift.
Cluster Examples
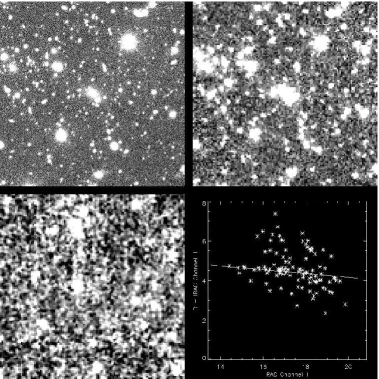
Figure 4 shows an example of a cluster detected at . Clockwise from upper left the four panels show the image, the image, the color-magnitude diagram, and the MIPS image.
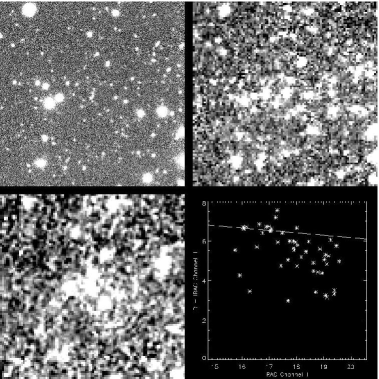
For comparision, Figure 4 shows an example of a cluster at . Spitzer will be able to detect clusters to even higher redshift using deeper datasets and alternate filter combinations. In collaboration with the SWIRE Legacy Team we are now applying the CRS technique to the degree2 SWIRE Legacy Fields.
Further Reading
This paper presented an IR adaptation of the CRS technique for detecting clusters at high redshift. More details about the IRAC component of the FLS may be found in Lacy et al. (2005). A study of the evolution of the cluster luminosity function may be found in Muzzin et al. (this volume) and Muzzin et al. (2005a), and a study of cluster sources in Muzzin et al. (2005b).
References
- (1) Bruzual, G., & Charlot, S. 2003, MNRAS, 344, 1000
- (2) Fadda, D.,Jannuzi, B. T., Ford, A., & Storrie-Lombardi, L. J., 2004, A.J., 128, 1
- (3) Gladders, M. D., & Yee, H. K. C. 2000, A.J., 120, 2148
- (4) Gladders, M. D., & Yee, H. K. C. 2005, in press (astro-ph/0411075)
- (5) Lacy, M., Wilson, G., Masci. F., Storrie-Lombardi, L. J. et al., 2005, Ap.J.S., in press
- (6) Muzzin, A., Wilson, G., Lacy, M., et al., 2005a, in prep
- (7) Muzzin, A., Wilson, G., Lacy, M., et al., 2005b, in prep