Discovery of Optical Emission in the Hotspots of Three 3CR Quasars: High-Energy Particle Acceleration in Powerful Radio Hotspots
Abstract
Archival Hubble Space Telescope WFPC2 images were used to search for optical emission associated with the radio jets of a number of luminous quasars. From this search, we report new optical hotspot detections in the well-known blazar 3C 454.3 and the lobe-dominated quasars 3C 275.1 and 3C 336. We also find optical emission in the vicinity of the hotspot in 3C 208, but believe this is a chance alignment. Optical emission from the arcsecond-scale jet in 3C 454.3 is also detected. Multi-frequency archival radio data from the VLA and MERLIN are analyzed, and the synchrotron spectra of these high-power hotspots are presented. We estimate that their break frequencies are in the range of Hz, with large uncertainties due to the wide gap in frequency coverage between the radio and optical bands. We also calculate their equipartition magnetic fields, and find that the anti-correlation between break frequency and magnetic field found by Brunetti et al. for lower power hotspots extends to these high power hotspots. This supports their model of hot-spots based on shock acceleration and synchrotron losses.
ApJ, accepted
1 Introduction
The production of very high energy particles via diffusive shock acceleration has applications to many astrophysical problems (e.g., Blandford and Eichler 1987). For instance, it is believed to be responsible for the production of TeV energy particles observed in supernova remnants, and in the very inner regions of active galactic nuclei (Catanese & Weekes 1999).
Another important site of high energy particle acceleration is in the terminal hotspots of powerful extended extragalactic radio sources. Their synchrotron spectra are observed from radio to optical frequencies (e.g., Meisenheimer et al. 1989), with the most energetic radiation requiring electrons with Lorentz factors, , which must be accelerated in-situ. The recent rejuvenation of interest in the physics of hotspots is due mainly to the launch of the Chandra X-ray Observatory. Chandra’s sub-arcsecond resolution imaging capability and highly sensitive detectors allow for a unique probe of their physical conditions – e.g., magnetic field strength, when the X-ray emission can be attributed to synchrotron self-Compton radiation, and energetics (e.g., Hardcastle et al. 2002).
Prior to the launch of Chandra, most studies of hotspots concentrated on high-resolution radio to optical mapping of their spectra, which can in principle, constrain their key physical parameters – synchrotron break frequency, magnetic field, electron mean free path. However, the higher frequency observations were limited to ground-based optical and infrared instruments, and met with mixed success (e.g., Meisenheimer et al. 1989, 1997).
Recently, Brunetti et al. (2003) used the VLT and successfully detected optical counterparts to 6 out of 10 radio hotspot targets (one “non-detected” hotspot was limited mainly by confusion with a field source). Their targets were lower radio power hotspots than the more powerful ones which were previously searched for optical emission (e.g., Meisenheimer et al. 1989, 1997). The lower power hotspots suffer less losses, so are sites of more efficient particle acceleration to the high energies (105) which are required to produce optical emission (Prieto et al. 2002). Conversely, the higher radio power hotspots, i.e. with larger magnetic fields, suffer greater (synchrotron and inverse Compton) losses, so show cutoffs in their spectra at lower frequencies – see the comparison between the spectra of the archetype high and low power hotspots in Cygnus A and 3C 445, respectively, in Figure 2 of Brunetti et al. (2003).
In this scenario, there is a strong magnetic field dependence of the break frequency in their synchrotron spectra () and observations of the lower power hotspots support this picture (Brunetti et al. 2003). It is important to test this proposal, by extending these results to higher power hotspots (with greater -fields). However, because their spectra are expected to cut off at lower energies, the higher power hotspots are faint in the optical, and can only be detected in deep Hubble Space Telescope (HST) images.
The HST has demonstrated an unique capability of being able to detect faint optical counterparts to radio jet/hotspot features. This has proved to be important for the interpretation of the bright X-ray jets detected by Chandra (Tavecchio et al. 2000; Celotti, Ghisellini, & Chiaberge 2001; Sambruna et al. 2004). We were motivated by these work and after a successful detection of a bright optical knot in the well-studied quasar 3C 279 from archival HST data (Cheung 2002; also motivated by the Chandra results on this object; Marshall et al. 2003), we initiated a similar search for extended optical features in other radio sources. Our search yielded optical detections of hotspots in three double-lobed 3CR quasars (3C 263, 3C 275.1, and 3C 336), the hotspot and jet knots in the blazar 3C 454.3, one tentative hotspot detection in 3C 208, and confirmation of the previously detected optical jet in PKS 1229–021 (Le Brun et al. 1997). The optical hotspot detection in 3C 263 has since been independently published by Hardcastle et al. (2002) who analyzed it in detail along with the Chandra detection. Neither 3C 263 or PKS 1229–021 will be discussed further. In this paper, we focus our discussion on the results on the other hotspots in light of the work of Brunetti et al. (2003). Initial results on 3C 454.3 and PKS 1229–021 were presented in Cheung et al. (2003).
In order to facilitate a comparison of our new optical detections with those of Brunetti et al. (2003), we assume = 50 km s-1 Mpc-1 and = 0.5 throughout this paper.
2 Search Strategy, Data and Analysis
The on-line Multimission Archive at the Space Telescope (MAST111http://archive.stsci.edu/) Science Institute was utilized to identify candidates for this study. MAST allowed us to identify archival HST images of quasars by their radio flux by referencing the catalog of Veron-Cetty & Veron (1996). For this study, we chose an integrated 5 GHz flux greater than 0.5 Jy in order to ensure that the source contained radio features bright enough for convincing optical detections (assuming a typical range of radio-to-optical spectral indices of 0.8–1, where ; e.g., Sambruna et al. 2004). Our query in Summer 2002 resulted in about 300 sources that had data obtained with the various imaging CCDs aboard HST. We focused on about 1/3 of these sources which had deep WFPC2 exposures (on both the high resolution planetary camera (PC) chip and any of the three lower resolution wide field (WF) chips) using one or more orbits of total exposure time. It was in this type of exposure that the optical jet in PKS 0637–752 was detected (Chartas et al. 2000; Schwartz et al. 2000). Lastly, we cross-referenced these candidates with known arcsecond-scale radio jets, aided by the catalog of Liu & Zhang (2002) which led to about a dozen sources searched. This simple procedure was adopted in the interest of efficiently finding as many previously unidentified optical jets and hotspots as possible, with little intention of studying any complete sample.
Summary of Multi-Telescope Archival Data
| Source | Instrument | Date | Frequency | Exp Time | Program | Observer or Reference |
| (1) | (2) | (3) | (4) | (5) | (6) | (7) |
| 3C 208 | MERLIN | 14 Aug 1993 | 1.413+1.658 | 14 hr | – | – |
| VLA A-configuration | 13 Dec 1992 | 8.44 | 3500 | AL280 | S. Garrington | |
| HST WFPC2 WF3/F675W | 23 Mar 1997 | 4.463105 | 9400 | 6491 | A. Stockton | |
| 3C 275.1 | MERLIN | 07 Aug 1993 | 1.413+1.658 | 12 hr | – | – |
| VLA A-configuration | 06 Mar 1982 | 4.89 | 2340 | WARD | J. F. C. Wardle | |
| VLA A-configuration | 13 Dec 1992 | 8.44 | 3490 | AL280 | S. Garrington | |
| HST WFPC2 PC1/F675W | 25 Jul 1995 | 4.463105 | 1800 | 5978 | S. Rawlings | |
| 3C 336 | MERLIN | 13 Aug 1993 | 1.413+1.658 | 15 hr | – | – |
| VLA A-configuration | 06 Mar 1982 | 4.89 | 2310 | WARD | J. F. C. Wardle | |
| VLA A-configuration | 13 Dec 1992 | 8.44 | 4440 | AL280 | S. Garrington | |
| HST WFPC2 WF2/F814W | 20 Jul 2000 | 3.755105 | 6600 | 8220 | M. Franx | |
| HST WFPC2 WF2/F702W | 12-14 Sep 1994 | 4.334105 | 24000 | 5304 | Steidel et al. (1997) | |
| HST WFPC2 WF3/F622W | 20 Dec 1994 | 4.846105 | 7200 | 5401 | Ridgway & Stockton (1997) | |
| HST WFPC2 WF2/F606W | 20 Jul 2000 | 4.993105 | 6600 | 8220 | M. Franx | |
| 3C 454.3 | VLA A-configuration | 31 Jan 1985 | 1.50 | 10860 | AC120 | R. Perley |
| VLA A-configuration | 31 Jan 1985 | 4.86 | 10490 | AC120 | R. Perley | |
| VLA B-configuration | 06 Jun 2002 | 8.46 | 860 | AC641B | C. C. Cheung | |
| VLA BnA-configuration | 28 May 2002 | 22.46 | 3850 | AC641A | C. C. Cheung | |
| HST WFPC2 WF2/F702W | 06 Dec 1997 | 4.333105 | 2100 | 6619 | Chen et al. (2001) |
Column (2) indicates the telescope and instrument/configuration used. The HST WFPC2 CCD chip and filters used are indicated.
Column (3) is the UT date of the archival observation.
Column (4) is the observing frequency in GHz.
Column (5) is the time on source in seconds unless otherwise indicated. The integration time for the radio data correspond to the unedited data.
Column (6) are the VLA or HST program codes/numbers.
Column (7) is reference for observation or observer name if we could not locate the reference.
2.1 Archival Hubble Space Telescope WFPC2 Data
Final combined and cosmic-ray removed HST WFPC2 images were available from the WFPC2 Associations website (see footnote 1). Where there was no WFPC2 Associations image available, we downloaded the original exposures from the HST archive and combined them with the CRREJ task in IRAF222IRAF is distributed by the National Optical Astronomy Observatories, which are operated by the Association of Universities for Research in Astronomy, Inc., under cooperative agreement with the National Science Foundation.. The final data used for this study are listed in Table 1.
Our identifications were made by overlaying high quality radio maps (see below) in digital form with the optical data. HST has the well-known advantage over ground based telescopes of being very sensitive to faint point sources, so this procedure was essential to distinguish between field sources and radio jet related optical features. We also processed the optical images with an unsharped masking filter where smoothed versions of the original images were subtracted from the originals. This additional processing helped us to identify the nearest lying features to the bright optical nuclei (within 1″) in previous work with similar data (Cheung 2002; Sambruna et al. 2004), and led here to the successful detection of optical emission in the jet of 3C 454.3 (§3.2).
Because of this heightened sensitivity to point sources, many of the imaging fields were littered with sources unassociated with the radio source which could be mistakened for optical counterparts to jet knots. Therefore, in order to get a qualitative sense of the probability of a false detection, we made two tests. First, we repositioned the radio core onto several of the other prominent optical sources (field stars, galaxies) in the images and did not find any objects aligning with peaks in the radio jets within 1-2 WFPC2 pixels (i.e., to better than 0.1″ to 0.2″; each of our reported detections satisfy this). Second, we simply rotated the radio image in a random fashion with respect to the optical frame and again, did not find any convincing alignments with any knots in the radio jet. We therefore believe that the detections claimed here are real and are not chance alignments of field sources.
Counts were measured from the optical hotspots, which were well-isolated from any other bright field sources, using circular apertures with the QPHOT task in IRAF. This gives essentially the counts in an infinite radius aperture by estimating the background signal in circular annuli around the source. Counts in the features close to the bright nucleus in 3C 454.3 were measured with square apertures. We estimated the contamination due to scattered light from the nuclei using identical apertures at other nearby positions on the CCD at equal distances from the core. These measurements suffered more contamination than in the hotspots so uncertainties were estimated accordingly by examining the fluctuations in the background. Count rates were converted to flux densities utilizing the inverse sensitivity measurements contained in the PHOTFLAM keyword in the image headers at the frequency given by the pivot wavelength indicated in the PHOTPLAM keyword. The WFPC2 filters (Holtzman et al. 1995) closely approximate the standard optical bands: V (F606W), R (F622W, F675W, F702W), and I (F814W). The resultant measurements are reported in Tables 2, and 3, and extinction corrections were estimated using the nearest standard band values reported in the NED database derived from Schlegel, Finkbeiner, & Davis (1998).
Lobe-dominated 3CR Quasar Hotspot Multi-wavelength Flux Densities
| Frequency | Flux | Flux | Flux |
|---|---|---|---|
| (GHz) | 3C 208-West | 3C 275.1-North | 3C 336-South |
| 1.53 | 0.1080.016 | 0.3550.053 | 0.0970.015 |
| 4.89 | 0.02770.003a | 0.1780.027 | 0.0450.007 |
| 8.44 | 0.0210.003 | 0.1060.016 | 0.0290.004 |
| 3.755105 | … | … | 0.18(0.21)0.0410-6 |
| 4.334105 | … | … | 0.15(0.17)0.0310-6 |
| 4.463105 | 0.21*(0.23)0.0410-6 | 0.30(0.32)0.0610-6 | … |
| 4.846105 | … | … | 0.11(0.13)0.0310-6 |
| 4.993105 | … | … | 0.14(0.17)0.0510-6 |
| 1.020.14* | 0.690.12 | 0.740.12 | |
| 1.03 (1.02)* | 1.16 (1.16) | 1.11 (1.10) |
Radio spectral indices, () are best-fit linear fits to the radio data. The radio-to-optical spectra, are calculated using the 5 GHz and 4.463 105 GHz measurements for 3C 208 and 3C 275.1, and 4.334 105 GHz for 3C 336.
A single power law fit through all of the data points yield spectral indices of 1.04, 1.14, and 1.08, for the three sources, respectively.
a Taken from Bridle et al. (1994).
The value indicated with an asterisk (*) is an optical candidate.
3C 454.3 Multi-wavelength Flux Densities
| Frequency | Flux | Flux | Flux | Flux |
|---|---|---|---|---|
| (GHz) | Knot A | Knot B | Knot C | Hotspot |
| 1.50 | … | … | … | 0.5410.054 |
| 4.86 | … | … | … | 0.2220.022 |
| 8.46 | 0.0130.004 | 0.0080.002 | 0.0100.003 | 0.1320.013 |
| 22.46 | … | … | … | 0.0650.010 |
| 4.333105 | 0.25(0.32)0.2510-6 | 0.25(0.32)0.1310-6 | 0.12(0.15)0.0610-6 | 0.50(0.63)0.1010-6 |
| … | … | … | 0.800.06 | |
| 1.00 (0.98) | 0.96 (0.93) | 1.04 (1.02) | 1.15 (1.13) |
The radio spectral index for the hotspot, () is best-fit linear fits to the radio data. The radio-to-optical spectra, are calculated using the 8.4 GHz and 4.333105 GHz measurements.
2.2 Archival Radio Data
The quasars in which we successfully identified optical emission in the jets and/or hotspots are well-known, and have been extensively imaged at centimeter wavelengths, so this analysis did not warrant new observations. High quality radio observations were obtained from the archival databases of the NRAO Very Large Array (Thompson et al. 1980), and additional MERLIN observations for the three lobe-dominated quasars. The MERLIN data were dual-frequency synthesis L-band observations which utilized a seven-element array of Tabley, MK2, Darnhall, Wardle, Knockin, Cambridge, and Defford.
The list of archival radio data collected are summarized in Table 1 with some effort made to find the original references. We invariably selected 5 GHz A-configuration data (0.4″ to 0.5″ resolution) for each source. The radio observations are all to our knowledge, unpublished. In one instance (3C 454.3), we used 8.4 and 22 GHz data from one of our own recent observing programs when the source was used as a phase calibrator for two targets. The VLA data were calibrated using standard procedures in the NRAO AIPS reduction package (Greisen 1988; Bridle & Greisen 1994) and exported to the Caltech DIFMAP program (Shepherd, Pearson, & Taylor 1994) for imaging and deconvolution. The initial calibration of the MERLIN data were performed at Jodrell Bank by the archivists and then self-calibrated and imaged at Brandeis. The 1.4 and 1.7 GHz MERLIN datasets were imaged and analyzed separately and the final images averaged.
We used DIFMAP’s MODELFIT program to model the brightness distribution in the hotspot regions in the radio sources with elliptical gaussian components. The inner jet in 3C 454.3 was only detected and resolved adequately in the 8.4 GHz data so radio fluxes were measured for the jet only at this frequency. The hotspot regions in the lobe-dominated 3CR quasars are complex and our estimate of the errors in the extracted fluxes are about 15. The 5 GHz flux for the 3C 208 hotspot was taken from Bridle et al. (1994).
The resultant fluxes extracted in this manner are presented in Tables 2 and 3. The radio spectral indices () are linear best fits to the data and are presented along with the radio-to-optical spectra indices (). In 3C 208, the radio spectrum of the hotspot is notably steeper than the other three cases where we claim bona-fide optical detections. The optical flux of the optical source near the radio hotspot lies on a power-law extrapolation of the radio spectrum (i.e., ) so it may still be due to synchrotron radiation if the spectrum breaks at even higher energies. In the other three cases, the radio-to-optical spectra are greater than the radio only spectra, indicating steepening of the hotspot spectra in the observed frequency range.
3 Results and Descriptions of Individual Sources
We successfully identified previously unknown optical counterparts to the hotspots of the lobe-dominated quasars 3C 275.1 (§3.1.2; Figure 2) and 3C 336 (§3.1.3; Figure 3), and in the blazar 3C 454.3 (§3.2; Figure 4). We also identified a possible optical counterpart to the hotspot in the lobe-dominated quasar 3C 208 (§3.1.1; Figure 1). As mentioned in the introduction, the optical hotspot detection in 3C 263 (=0.652) was reported since by Hardcastle et al. (2002) along with the new Chandra X-ray detection so is not discussed here. The lobe-dominated quasars are best known to many as being in the Hough & Readhead (1989) sample of double lobed 3CR quasars. A recent summary of their source properties and VLBI observations is in Hough et al. (2002).
3.1 The Double-lobed 3CR Quasars
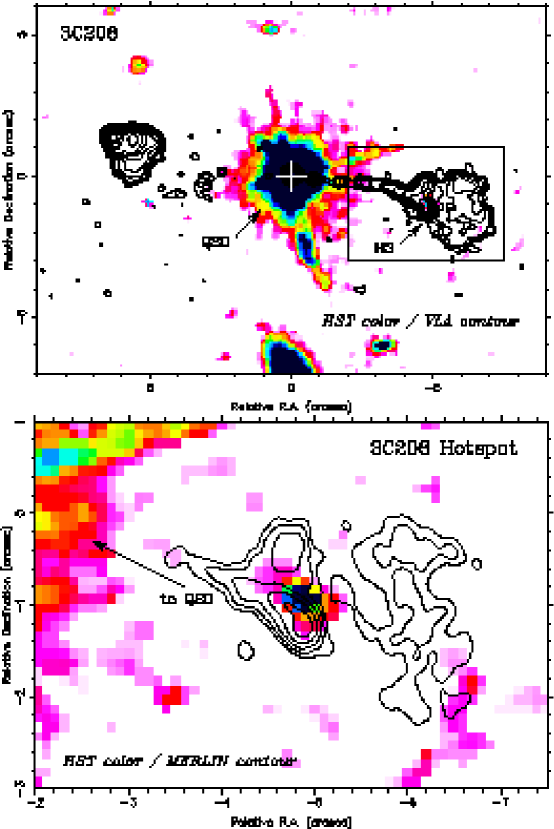
3.1.1 Optical Emission Nearby the Radio Hotspot in 3C 208
The optical identification of the western radio hotspot in 3C 208 (=1.11) is only tentative since the optical feature is not as precisely-aligned with any peak in the radio structure (Figure 1) as in the other cases presented in this paper. The closest radio feature is knot “B” in the nomenclature of Bridle et al. (1994) which we identify as the hotspot. The optical feature appears resolved; although the radio and optical peaks are 0.30.1″ apart (1.6 kpc projected), some of the optical light may still be associated with the radio hotspot. We could not confirm the optical detection in shallower WFPC2 F555W and F702W images (snapshots) taken on the high resolution PC chip (Lehnert et al. 1999). There is no apparent optical emission from the radio jet in any of the images. If all of the optical emission near the 3C 208 radio hotspot is indeed associated with the radio source, its overall spectrum is consistent with a single power-law with little or no steepening from the observed radio spectral index of 1. Further observations with multiple optical filters to measure the spectrum of this feature are encouraged.
3.1.2 Hotspot Detection in 3C 275.1
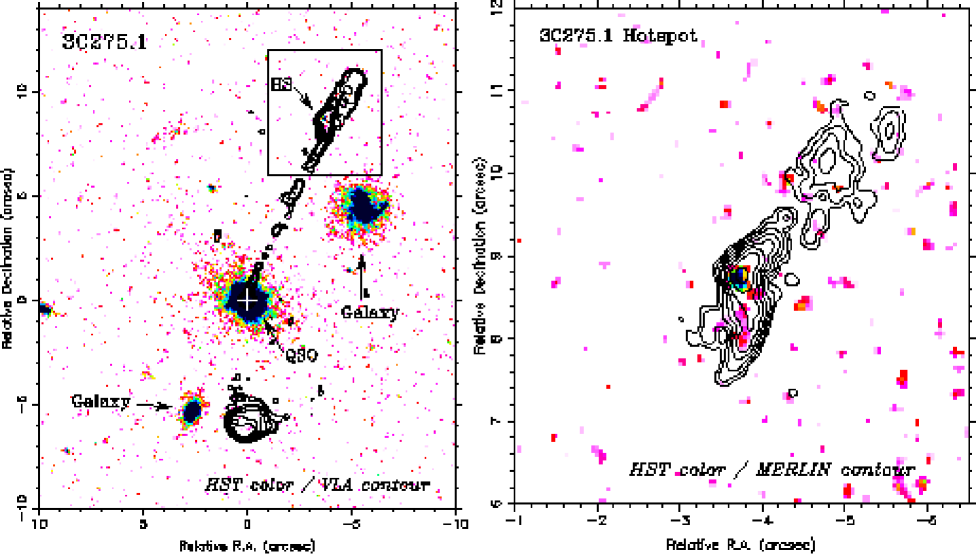
3C 275.1 (=0.557) is a radio source with a “dog-leg” appearance (Stocke, Burns, & Christiansen 1985). A MERLIN 1.4 GHz image appears in Akujor et al. (1994) and a deep VLA 5 GHz image in Stocke et al. (1985). The optical field in 3C 275.1 has been well studied (e.g., Hintzen & Romanishin 1986, and references therein).
Optical emission from the northern hotspot is prominent in the unprocessed HST image (Figure 2) and is clearly coincident with the peak in the high resolution MERLIN map. This detection was independently confirmed in a recent study by Hardcastle et al. (2004). It was never noted in previous ground based optical imaging studies presumably due to its faintness. There is some extended optical emission around the hotspot, some of which is aligned along the complex radio jet/hotspot structure. The hotspot has also been detected in the X-rays with Chandra at a flux level above the extrapolation of the radio-to-optical spectrum signaling an additional spectral component, presumably inverse Compton emission (Crawford & Fabian 2003; Hardcastle et al. 2004).
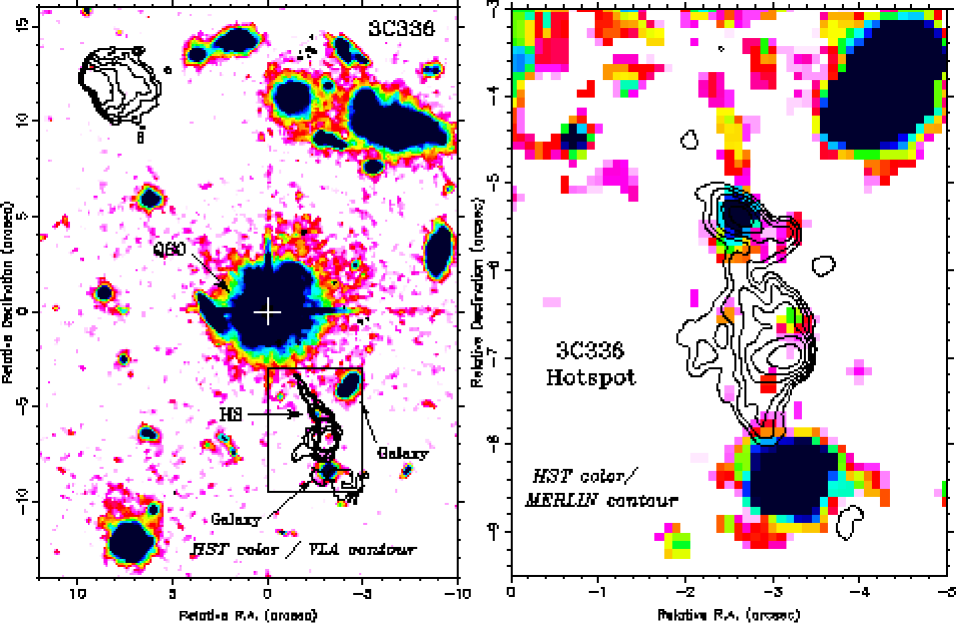
3.1.3 Hotspot Detection in 3C 336
3C 336 (=0.927) is a large angular size source, stretching across almost 1/2 arcmin in the sky (250 kpc projected). It lies in an extremely dense optical field (Steidel et al. 1997). In the nomenclature of Bridle et al. (1994), the optically detected feature (Figure 3) is knot “C” in the jet to the south. Although it marks the termination point of the jet, the feature does not conform to their strict classification as a hotspot. Rather, they classify a radio feature further south as the hotspot although C appears more compact – we will proceed with our discussion assuming that C is indeed a hotspot.
Bridle et al. (1994) found the 5 GHz flux to be 38.3 mJy compared to our observed 45 mJy. Our fluxes were not corrected for contribution of the surrounding lobe emission so may be systematically higher than the fluxes derived by Bridle et al. (1994). Region C is actually resolved into a peak where the optical feature is clearly coincident, and a weaker extension to the west. Our flux density measurement is from the dominant feature. Fainter extended optical emission may be associated with the radio tail but it is at the same level as surrounding low level emission which is clearly not associated with the radio structure.
We found the optical hotspot in four separate WFPC2 images obtained in different programs (Table 1). The published figure of the deep 24,000 second WFPC2 F702W exposure in Steidel et al. (1997) actually shows the feature (at the bottom edge of their figure 2d), but was not identified by those authors as associated with the radio jet. This is the only hotspot where we could measure an optical spectrum, 1.51.0, but the spectral coverage in the optical is limited making this value highly uncertain. The difference between the radio and optical indices is formally, 0.8.
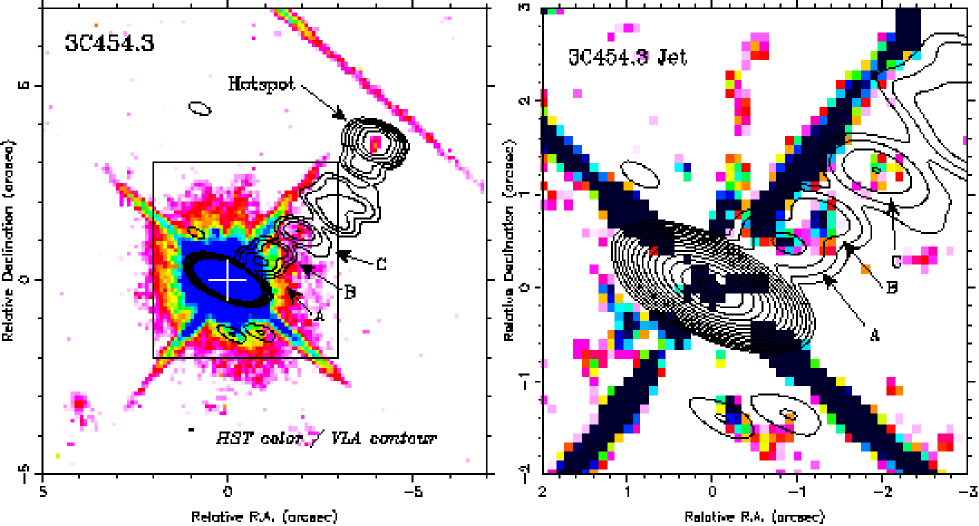
3.2 The Optical Hotspot and Jet in 3C 454.3
3C 454.3 (=0.859) is a superluminal -ray blazar with a core-jet VLBI morphology (Pauliny-Toth et al. 1987; Jorstad et al. 2001). The parsec-scale jet stretches westward from the nucleus, continuing with more extended emission to the northwest. This extended emission traces a path toward the kilo-parsec scale structure seen in VLA images, where the optical emission was detected in the HST data (Figure 4). A recent Chandra image detected X-ray emission from the jet and hotspot (Marshall et al. 2005).
A deep WFPC2 image of this quasar was obtained as part of a program to search for Ly- absorption systems in its field (Chen et al. 2001), so the exposure was centered on one of the low resolution wide-field (WF) CCD chips (about twice the pixel size of the higher resolution PC chip). An unresolved (FWHM0.15–0.2″) optical source coincident with the position of the hotspot in the radio jet is apparent in the HST image, very near one of the diffraction spikes from a nearby bright point source (Figure 4; see also the unsharp-mask processed image in Figure 1 of Cheung et al. 2003).
Upon closer inspection, a series of three bright optical knots are present which match peaks in the jet as seen in the full resolution 8.4 GHz radio map (a hybrid BnA configuration dataset with extra north-south resolution). These radio features are confirmed in a MERLIN 1.7 GHz map published in Browne et al. (1982). Our preliminary processing (Cheung et al. 2003) of the HST data used a gaussian smoothing with a very broad profile so that a large negative bowl suppressed emission from these inner knots.
The optical feature coincident with radio knot B is seen in a 280s WFPC2 PC snapshot image obtained as part of the Lehnert et al. (1999) survey of the 3CR sample. The feature is clearly separated from the nucleus and both its position and flux (in the same filter as in the current deep WF image) almost match exactly. The knot is about a 3 detection. The fainter outer knot (C) could not however be verified in this image as expected from signal-to-noise limits, and knot A is simply too close to the bright nucleus to be distinguished easily from the scattered light. Although the integrated flux of the hotspot is greater than knot B, it was undetected in the higher resolution (PC chip) snapshot image. For the measured peak surface brightness from the WF image of about 6 Jy/arcsec2, we find that the expected SNR is at best about unity for the PC chip exposure using the on-line WFPC2 exposure time calculator333See: http://www.stsci.edu/instruments/wfpc2/.
The jet in the 22 GHz data was very ill-defined so fluxes for the inner jet knots were not extracted from this dataset. However, the hotspot was prominent. Our total 22 GHz flux for 3C 454.3 was renormalized to contemporaneous single dish measurements from the Metsähovi quasar monitoring program (H. Teräsranta, 2003, private communication; Teräsranta et al. 2004). The radio source varied by at most 3 over the 1 month period, so the average of five measurements obtained by the Metsähovi group was used.
Properties of the Three 3CR Quasar Hotspots
| Source | R (asec, 1021 cm) | log() | Beq |
|---|---|---|---|
| (1) | (2) | (3) | (4) |
| 3C 275.1-N | 0.22, 5.8 | 10.01.2 | 2.6 |
| 3C 336-S | 0.25, 5.9 | 11.11.2 | 2.3 |
| 3C 454.3-NW | 0.25, 6.4 | 11.40.6 | 3.8 |
(4) The logarithm of the derived break frequency, , in Hz (see §4).
(3) Equipartition magnetic field, Beq in units of 10-4 G. These assume a uniformly filled region, negligible beaming, and =10.
4 Discussion
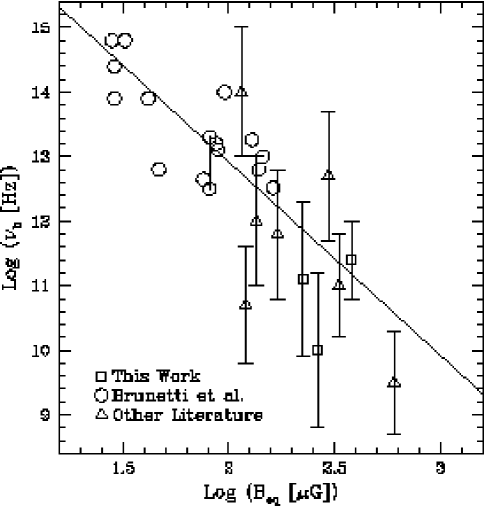
Brunetti et al. (2003) recently found that lower power radio hotspots are brighter at optical wavelengths than these more powerful radio hotspots which are customarily searched for optical emission (Meisenheimer et al. 1989). They propose a simple in-situ shock acceleration scheme whereby high radio power hotspots with larger -fields suffer greater losses, and are inefficient at accelerating electrons up to 105, required to produce optical emission. In this scenario, the position of the “break” frequency in the observed spectrum will depend on the balance between the rate of electron acceleration in a shock region and combined synchrotron and inverse Compton losses. There is a strong magnetic field dependence of the break frequency in their synchrotron spectra, (Figure 6), and observations of the lower power hotspots support this prediction (Brunetti et al. 2003; see also earlier discussions of this scenario by Meisenheimer et al. 1989 and Prieto et al. 2002).
It is important to extend this work to higher power hotspots (with greater ) which are expected to be faint in the near-IR and optical, and can only be detectable in deep HST exposures. Our detections of the faint optical counterparts in the three sources help us to constrain in the spectra of these high power hotspots.
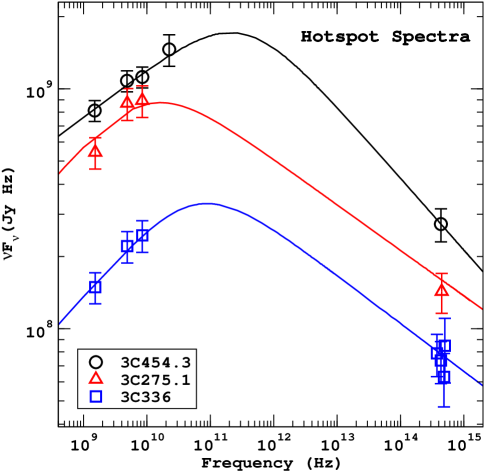
Figure 5 shows the radio-to-optical spectral energy distributions (SED) of the three hotspots with bona-fide optical detections from our analysis of the archival HST and radio data. The optical fluxes clearly lie below a simple extrapolation of a power law from the observed radio data, so are consistent with steepening in the high energy spectrum.
The data are admittedly sparse and the overall shape of the SED can only be roughly constrained. We assume that the SED can be approximated by a simple smoothly varying double power law function so that we can parameterize it with a break frequency () at which the power law slope changes. The low energy slopes are set by the observed radio spectra (). In the absence of precise information on the high energy slopes, we assume that the optical spectral index, =–0.5, which is expected from first order Fermi shock acceleration models with synchrotron losses (e.g. Heavens & Meisenheimer 1987). This is indeed, very near what is observed in the case of the 3C 336 hotspot, where we have a rough constraint on the optical spectrum (§3.1.3). In this manner, is related to observed variables by: log () = log () + 2 () log (/), where the subscripts indicate the radio (5 GHz) and optical values. In practice, the uncertainty in determining is dominated by (), since () 0.1, compared to ()0.02–0.03. Therefore, (log ()) 2 log (/) () 10 (). Our estimates of Hz for these hotspots are therefore good to 1 dex (Table 4).
Following Brunetti et al. (2003), we used the observed radio spectra, flux densities at 5 GHz, and constraints on the sizes from our modelfits, to calculate magnetic fields assuming equipartition (Table 4). These magnetic fields are in the range of a few hundred G, so are relatively large. As in Brunetti et al. (2003), we have assumed for simplicity that the hotspot emission is not relativistically beamed (but see Georganopoulos & Kazanas 2003). If the radiation is beamed, the equipartition magnetic fields calculated must be reduced by a factor of 5/7 to transform to the source rest-frame (Stawarz, Sikora, & Ostrowski 2003), where is the Doppler factor.
Optical Hotspots from the Literature
| Source | z | Ref. | Ref. | log() | Beq | ||
|---|---|---|---|---|---|---|---|
| (1) | (2) | (3) | (4) | (5) | (6) | (7) | (8) |
| 0405–123-N | 0.574 | 0.900.10 | C04; S04; T05 | 1.10 | C04; S04; T05 | 12.71.0 | 2.9 |
| 3C 228-S | 0.5524 | 0.76* | J95 | 1.05 | H04 | 11.81.0 | 1.7 |
| 3C 245-W | 1.029 | 0.870.08 | C04; S04; T05 | 1.39 | C04; S04; T05 | 9.50.8 | 6.0 |
| 1136–135-W | 0.554 | 0.850.08 | C04; S04; T05 | 1.22 | C04; S04; T05 | 11.00.8 | 3.3 |
| 1150+497-H | 0.334 | 0.720.09 | C04; S04; T05 | 1.12 | C04; S04; T05 | 10.70.9 | 1.2 |
| 1150+497-I | 0.334 | 0.800.10 | C04; S04; T05 | 1.07 | C04; S04; T05 | 12.01.0 | 1.4 |
| 3C 403-F1 | 0.059 | 0.8* | D99 | 0.87 | H04 | 14.01.0 | 1.1 |
| 3C 403-F6 | 0.059 | 0.8* | D99 | 0.85 | H04 | 14.11.0 | 1.4 |
(3) Radio spectral index from references in column (4).
(5) Radio-to-optical spectral index from references in column (6). We used fluxes reported by the authors at 5 GHz in the radio (in 3C 228 and 3C 403, H04 converted from 8.4 GHz using =0.5), and 3.451014 (3C 228), 4.341014 (3C 403), and 5.131014 Hz (rest) for the optical.
(7) The logarithmic of the derived break frequency, , in Hz (see §4).
(8) Equipartition magnetic field, Beq in units of 10-4 G. See Table 4 for assumptions used.
References in columns (4) and (6): C04 = Cheung (2004), Cheung et al. in prep.; D99 = Dennett-Thorpe et al. (1999); H04 = Hardcastle et al. (2004); J95 = Johnson et al. (1995); L92 = Liu et al. (1992); S04 = Sambruna et al. (2004); T05 = Tavecchio et al. (2005)
Recent work by Sambruna et al. (2004) and Hardcastle et al. (2004) provide additional optical hotspot source detections and we were able to estimate (, ) for 8 additional hotspots in 6 radio sources as described above (Table 5). Although information for a large number of optical hotspots are provided by Hardcastle et al. (2004), only four of these hotspots (in three objects) were not previously considered in the study by Brunetti et al. (2003). Of these four hotspots, we could not confirm the case in 3C 280 from our independent analysis of the same HST data (see also the radio/optical image overlay in Figure 3 of Ridgway et al. 2004 – the radio and optical peaks were not clearly coincident as in our case in 3C 208; § 3.1.1) – this case is omitted in our discussion.
We find that the derived (, ) of the high radio power hotspots (Tables 4 & 5) lie near the extrapolation of the trend traced by Brunetti et al. (2003), which lends support to their simple picture (Figure 6). This is a remarkable finding considering the hotspots span about 3 orders of magnitude in magnetic field energy density, while considering both radio galaxies and quasars. In the scenario outlined by Brunetti et al. (2003), the proportionality is: , where is the dynamical age of the hotspot and the ratio of the energy densities of the lobe () and the hotspot () accounts for adiabatic losses. More precise mapping of the high-power hotspot SEDs are necessary to confirm that the –3 slope indeed extends over 6 orders of magnitude in frequency (e.g. that there is no change in the slope). If confirmed, these observations could imply that that there is a single dynamical age for radio hotspots in radio galaxies and quasars over a wide range in power.
Spitzer Space Telescope observations, already approved for two of our new optical hotspot sources, will allow us to measure the high energy slope of the SED which will constrain more robustly. While additional millimeter and sub-mm observations (in the future with ALMA) are required to map the shape of the high energy synchrotron spectrum, existing radio, optical, and new infrared data can constrain the break frequency adequately (to better than a decade) for the purpose of showing the extrapolation of the sequence determined from the theory.
References
- Akujor et al. (1994) Akujor, C. E., Lüdke, E., Browne, I. W. A., Leahy, J. P., Garrington, S. T., Jackson, N., & Thomasson, P. 1994, A&AS, 105, 247
- Blandford & Eichler (1987) Blandford, R. & Eichler, D. 1987, Phys. Rep., 154, 1
- Bridle & Greisen (1994) Bridle, A. H. & Greisen, E. W. 1994, AIPS Memo 87 (NRAO: Charlottesville)
- Bridle et al. (1994) Bridle, A. H., Hough, D. H., Lonsdale, C. J., Burns, J. O., & Laing, R. A. 1994, AJ, 108, 766
- Browne et al. (1982) Browne, I. W. A., Clark, R. R., Moore, P. K., Muxlow, T. W. B., Wilkinson, P. N., Cohen, M. H., & Porcas, R. W. 1982, Nature, 299, 788
- Brunetti et al. (2003) Brunetti, G., Mack, K.-H., Prieto, M. A., & Varano, S. 2003, MNRAS, 345, L40
- Catanese & Weekes (1999) Catanese, M. & Weekes, T.C. 1999, PASP, 111, 1193
- Celotti, Ghisellini, & Chiaberge (2001) Celotti, A., Ghisellini, G., & Chiaberge, M. 2001, MNRAS, 321, L1
- Chartas et al. (2000) Chartas, G., Worrall, D. M., Birkinshaw, M., et al. 2000, ApJ, 542, 655
- Chen et al. (2001) Chen, H.-W., Lanzetta, K. M., Webb, J. K., & Barcons, X. 2001, ApJ, 559, 654
- Cheung (2002) Cheung, C. C. 2002, ApJ, 581, L15
- Cheung et al. (2003) Cheung, C. C., Wardle, J. F. C., Chen, T., & Hariton, S. P. 2003, New Astronomy Review, 47, 423
- Cheung (2004) Cheung, C. C. 2004, Ph.D. Thesis, Brandeis University
- Crawford & Fabian (2003) Crawford, C. S. & Fabian, A. C. 2003, MNRAS, 339, 1163
- Dennett-Thorpe et al. (1999) Dennett-Thorpe, J., Bridle, A. H., Laing, R. A., & Scheuer, P. A. G. 1999, MNRAS, 304, 271
- Georganopoulos & Kazanas (2003) Georganopoulos, M., & Kazanas, D. 2003, ApJ, 589, L5
- Greisen (1988) Greisen, E. W. 1988, AIPS Memo 61 (NRAO: Charlottesville)
- Hardcastle et al. (2002) Hardcastle, M. J., Birkinshaw, M., Cameron, R. A., Harris, D. E., Looney, L. W., & Worrall, D. M. 2002, ApJ, 581, 948
- Hardcastle et al. (2004) Hardcastle, M. J., Harris, D. E., Worrall, D. M., & Birkinshaw, M. 2004, ApJ, 612, 729
- Heavens & Meisenheimer (1987) Heavens, A. F. & Meisenheimer, K. 1987, MNRAS, 225, 335
- Hintzen & Romanishin (1986) Hintzen, P. & Romanishin, W. 1986, ApJ, 311, L1
- Holtzman et al. (1995) Holtzman, J. A., Burrows, C. J., Casertano, S., Hester, J. J., Trauger, J. T., Watson, A. M., & Worthey, G. 1995, PASP, 107, 1065
- Hough & Readhead (1989) Hough, D. H. & Readhead, A. C. S. 1989, AJ, 98, 1208
- Hough et al. (2002) Hough, D. H., Vermeulen, R. C., Readhead, A. C. S., Cross, L. L., Barth, E. L., Yu, L. H., Beyer, P. J., & Phifer, E. M. 2002, AJ, 123, 1258
- Johnson, Leahy, & Garrington (1995) Johnson, R. A., Leahy, J. P., & Garrington, S. T. 1995, MNRAS, 273, 877
- Jorstad et al. (2001) Jorstad, S. G., Marscher, A. P., Mattox, J. R., Wehrle, A. E., Bloom, S. D., & Yurchenko, A. V. 2001, ApJS, 134, 181
- Le Brun et al. (1997) Le Brun, V., Bergeron, J., Boisse, P., & Deharveng, J. M. 1997, A&A, 321, 733
- Lehnert et al. (1999) Lehnert, M. D., Miley, G. K., Sparks, W. B., Baum, S. A., Biretta, J., Golombek, D., de Koff, S., Macchetto, F. D., & McCarthy, P. J. 1999, ApJS, 123, 351
- Liu & Zhang (2002) Liu, F. K. & Zhang, Y. H. 2002, A&A, 381, 757
- Liu, Pooley, & Riley (1992) Liu, R., Pooley, G., & Riley, J. M. 1992, MNRAS, 257, 545
- Marshall et al. (2003) Marshall, H. L., Cheung, T., Canizares, C. R., & Fang, T. 2003, BAAS, 36, 4.26
- Marshall et al. (2005) Marshall, H. L., Schwartz, D. A., Lovell, J. E. J., et al. 2005, ApJS, 156, 13
- Meisenheimer et al. (1989) Meisenheimer, K., Röser, H.-J., Hiltner, P. R., Yates, M. G., Longair, M. S., Chini, R., & Perley, R. A. 1989, A&A, 219, 63
- Meisenheimer, Yates, & Röser (1997) Meisenheimer, K., Yates, M. G., & Röser, H.-J. 1997, A&A, 325, 57
- Pauliny-Toth et al. (1987) Pauliny-Toth, I. I. K., Porcas, R. W., Zensus, J. A., Kellermann, K. I., & Wu, S. Y. 1987, Nature, 328, 778
- Prieto, Brunetti, & Mack (2002) Prieto, M. A., Brunetti, G., & Mack, K. 2002, Science, 298, 193
- Ridgway & Stockton (1997) Ridgway, S. E. & Stockton, A. 1997, AJ, 114, 511
- Ridgway, Stockton, & Lacy (2004) Ridgway, S. E., Stockton, A., & Lacy, M. 2004, ApJ, 600, 70
- Sambruna et al. (2004) Sambruna, R. M., Gambill, J. K., Maraschi, L., Tavecchio, F., Cerutti, R., Cheung, C. C., Urry, C. M., & Chartas, G. 2004, ApJ, 608, 698
- Schlegel, Finkbeiner, & Davis (1998) Schlegel, D. J., Finkbeiner, D. P., & Davis, M. 1998, ApJ, 500, 525
- Schwartz et al. (2000) Schwartz, D. A., Marshall, H. L., Lovell, J. E. J. et al. 2000, ApJ, 540, L69
- Shepherd, Pearson, & Taylor (1994) Shepherd, M. C., Pearson, T. J., & Taylor, G. B. 1994, BAAS, 26, 987
- Stawarz, Sikora, & Ostrowski (2003) Stawarz, Ł., Sikora, M., & Ostrowski, M. 2003, ApJ, 597, 186
- Steidel et al. (1997) Steidel, C. C., Dickinson, M., Meyer, D. M., Adelberger, K. L., & Sembach, K. R. 1997, ApJ, 480, 568
- Stocke, Burns, & Christiansen (1985) Stocke, J. T., Burns, J. O., & Christiansen, W. A. 1985, ApJ, 299, 799
- Tavecchio et al. (2000) Tavecchio, F., Maraschi, L., Sambruna, R. M., & Urry, C. M. 2000, ApJ, 544, L23
- Tavecchio et al. (2005) Tavecchio, F., Cerutti, R., Maraschi, L., Sambruna, R. M., Cheung, C. C., & Urry, C. M. 2005, ApJ, submitted
- Teräsranta et al. (2004) Teräsranta, H., et al. 2004, A&A, 427, 769
- Thompson et al. (1980) Thompson, A. R., Clark, B. G., Wade, C. M., & Napier, P. J. 1980, ApJS, 44, 151
- Veron-Cetty & Veron (1996) Veron-Cetty M.-P. & Veron P. 1996, ESO Scientific Report 17