Discovery of 1323 s pulsations from RX J0103.6$-$7201: the longest period X-ray pulsar in the SMC ††thanks: Based on observations with XMM-Newton, an ESA Science Mission with instruments and contributions directly funded by ESA Member states and the USA (NASA)
XMM-Newton archival observations of the Be/X-ray binary candidate RX J0103.6$-$7201 revealed pulsations with a period of 1323 s. This makes RX J0103.6$-$7201 the X-ray pulsar with the longest period known in the Small Magellanic Cloud (SMC). More than 150 X-ray observations of RX J0103.6$-$7201 by ROSAT, Chandra and XMM-Newton show flux variations by a factor of 50 on time scales of days to years. Using the accurate positions obtained from ACIS-I images the optical counterpart is identified with a V = 14.6 mag emission line star. EPIC spectra of RX J0103.6$-$7201 above 1 keV are consistent with an absorbed power-law with column density between (69) cm-2, except during one observation when an extraordinary high value of 1.1 cm-2 was measured which strongly attenuated the power-law emission below 3 keV. A soft excess between 0.5 and 1.0 keV is evident in the spectra which becomes best visible in the highly absorbed spectrum. The soft component can be reproduced by a thermal plasma emission model with its luminosity strongly correlated with the total intrinsic source luminosity. Including results from three other SMC Be/X-ray binaries extends the linear correlation over three orders of magnitude in source intensity, strongly suggesting that the same mechanism is responsible for the generation of the soft emission.
Key Words.:
galaxies: individual: Small Magellanic Cloud – stars: neutron – X-rays: binaries – X-rays: galaxies – individual: RX J0103.6$-$72011 Introduction
High mass X-ray binaries (HMXBs) are binary systems consisting of a compact stellar object accreting matter from a high mass early type star. In most cases the detection of pulsations in the X-ray flux with periods in the range of 0.07 s to 1500 s reveals a spinning neutron star orbiting an OB supergiant or a Be star. The large population of HMXBs makes the SMC unique among the galaxies of the Local Group. First, the absolute number of known HMXBs is similar to that in the Milky Way, despite the comparatively small mass of the SMC and second, while the ratio of supergiant to Be binaries in the Milky Way is 1/3.5 as found from a detailed literature search, the vast majority of HMXBs in the SMC has a Be star counterpart.
Currently 48 X-ray pulsars are known in the SMC (Coe et al. 2005), from which 45 are most likely in HMXB systems as suggested by their X-ray properties (Haberl & Pietsch 2004). Optical identifications confirmed 33 Be counterparts while only one supergiant system (SMC X-1) is known. Additional candidates for Be/X-ray binaries were found by Haberl & Sasaki (2000) from correlations of ROSAT catalogues of SMC sources with lists of H emission line objects (Meyssonnier & Azzopardi 1993, hereafter MA93) and by Sasaki et al. (2003).
One of the Be/X-ray binary candidates is RX J0103.6$-$7201, its ROSAT position (with an uncertainty of 4″) is consistent with the emission line object $[$MA93$]$ 1393 (Haberl & Sasaki 2000). This hard ROSAT source was detected in PSPC (Haberl et al. 2000) and HRI (Sasaki et al. 2000) pointed observations of the SMC. From three ROSAT observations a factor of three flux variability was seen on time scales of years. A first analysis of early XMM-Newton data was performed by Sasaki et al. (2003). RX J0103.6$-$7201 is located close to the supernova remnant 1E 010272.3 in the North-East of the SMC which is frequently observed as calibration source for the instruments on-board XMM-Newton and Chandra. About 150 Chandra observations were performed with RX J0103.6$-$7201 located on various ACIS CCD chips which are readily available from the Chandra archive. In addition twelve XMM-Newton observations with the EPIC instruments in various readout modes makes RX J0103.6$-$7201 the most frequently observed extragalactic X-ray binary. We analyzed the temporal and spectral properties of RX J0103.6$-$7201 and present the results in this paper.
2 Data analysis


The Chandra ACIS calibration observations of 1E 010272.3 are typically of 8 ks exposure (five observations have 20 ks) and were used to determine an accurate position (Sect. 2.4) and to investigate the flux history of RX J0103.6$-$7201 (Sect. 2.3). The twelve XMM-Newton EPIC observations performed until 2004, Oct. 15 have longer exposures of 2030 ks (only one exception with 13 ks). The EPIC-pn (Strüder et al. 2001) and EPIC-MOS (Turner et al. 2001) data were, therefore, used for a spectral and temporal analysis, in particular to search for X-ray pulsations. During five of the EPIC observations (here as observation a single pointing within a satellite revolution is defined) two different CCD readout modes were used for the pn camera (switching between FF: full frame, LW: large window and SW: small window mode) while the MOS cameras were operated in LW mode during the whole observation (only during revolution 433 and 447 part of the time was spent in timing mode). Different optical light blocking filters (thin, medium and thick) were chosen in different revolutions (see also Table 1). During revolutions 616 and 803 the MOS LW mode field of view did not cover RX J0103.6$-$7201. Also the MOS timing mode observations cannot be used. The data were processed using the XMM-Newton analysis package SAS 6.0.0 to produce the photon event files and binned data products such as images and spectra. Events for spectral and temporal analysis of RX J0103.6$-$7201 were extracted from circular regions (radius 20″) around the source position and from nearby source-free regions for background spectra. Photon arrival times were corrected to the solar system barycentre. For the purpose of searching for relatively long periods of seconds to tens of minutes as observed from Be/X-ray binaries the EPIC-pn data from one satellite revolution with different readout modes were merged. MOS and pn data were combined for the common time intervals, i.e. MOS data at the beginning of an observation when the pn camera was still calculating the offset map (and also when the readout mode was changed) were disregarded.
2.1 X-ray pulsations
We performed a timing analysis of the EPIC data of RX J0103.6$-$7201, searching for pulsations in the broad energy band (0.38.0 keV) using the Rayleigh Z technique in the range 13000 s. Strong peaks in the probability density function were found from the observations in revolutions 521 (pn SW+LW and MOS1/2 LW), 616 (pn SW+LW), 721 (pn FF and MOS1/2 LW) and 803 (pn LW) with Z of 93.2, 77.9, 68.4 and 29.9, respectively. The maximum Z of 93.2 derived for revolution 521 corresponds to a period detection confidence of 1.01.3 (disregarding the detection in other observations). Fig. 1 shows two example periodograms (top) together with the EPIC X-ray light curves folded with the most likely period value derived from the Z2 test. To investigate energy dependencies of the pulse profile, light curves in the 0.31.5 keV (soft), 1.58.0 keV (hard) and the total 0.38.0 keV energy bands were created. Hardness ratios derived by dividing the pulse profiles in the hard and soft bands show significant variations caused by weaker pulse modulations in the soft band compared to the hard band. This is particularly evident during the revolution 616 observation where no significant modulation was seen in the soft band. Period errors (1) were determined by fitting of a sine wave to the total light curves with 80 s binning, taking into account long term trends visible in the light curves by adding polynomial components to the sine model light curve. We also tested the inclusion of a second harmonic component as might be suggested by the analysis shown in Fig. 1. This did not improve the results because the major uncertainties in the determination of the long pulse period arise from the superposed long term trends. The pulse period history for the four observations is shown in Fig. 2. No significant change in the pulse period is visible consistent with a constant period of (1323.2 5.8) s. However, the large errors are still compatible with large spin-up or spin-down with up to 13 s year-1.


2.2 X-ray spectra
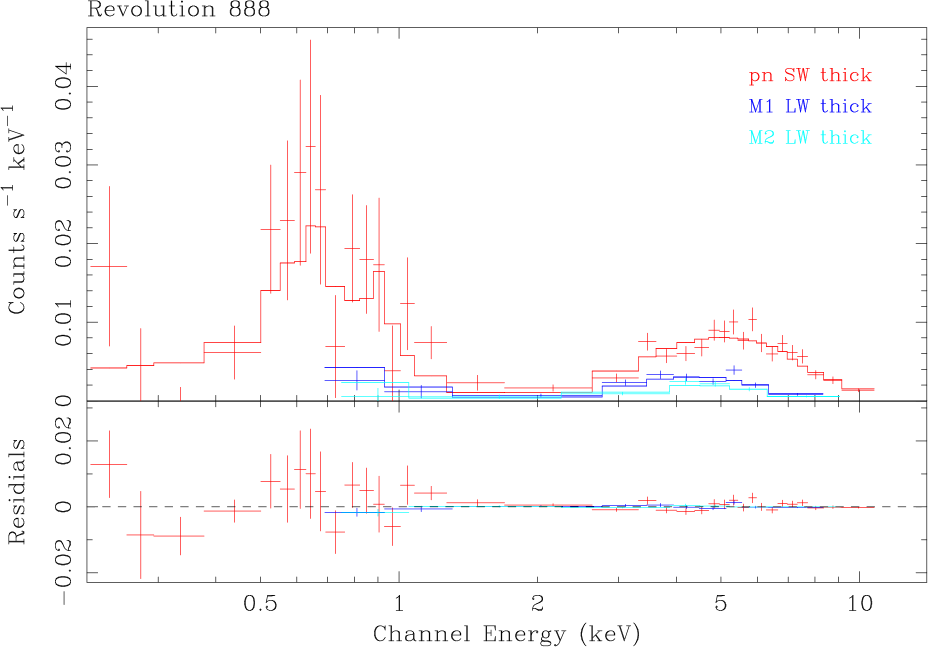
Pulse phase averaged EPIC-pn and -MOS spectra were extracted using pattern 04 (single+double pixel) and pattern 012 (single quadruple) events, respectively, and binned to obtain at least 50 counts per bin. For observations split into parts with different readout modes (with different spectral response) separate spectra were obtained. Nine EPIC observations yielded a sufficiently high number of counts for a spectral analysis. All spectra for each observation were fit simultaneously (using XSPEC v11.3) with the same model only allowing a free normalization factor between the different instruments and readout modes (which cover different time intervals with varying source intensity). Errors were determined for 90% confidence levels. A simple power-law model including photo-electric absorption by matter with solar abundance reproduces the data well above 1 keV while at lower energies a soft excess is apparent, in particular in the EPIC-pn spectra. This soft component is clearly visible during the XMM-Newton observation of revolution 888 when the power-law component was highly absorbed and did not contribute below 3 keV. The EPIC spectra of this observation were used to investigate the nature of the soft component.
To fit the soft component a black-body model and a model for a hot plasma in collisional equilibrium (Mewe et al. 1985, MEKAL model in XSPEC) were compared. These were used in the past to reproduce low energy excesses seen in spectra of SMC Be/X-ray binaries (Sasaki et al. 2003; Haberl et al. 2003; Majid et al. 2004). The EPIC spectra of RX J0103.6$-$7201 from revolution 888 were fit with these models between 0.2 and 2.0 keV where the power-law contribution can be neglected. This results in /dof values of 19.04/15 and 14.50/12 for the black-body and the thermal model, respectively. The thermal plasma model better reproduces the structures in the spectrum which are probably caused by emission lines around 650 eV and 850 eV. Therefore, the thermal model was used as additional component to the power-law to fit the full EPIC spectra from all observations.
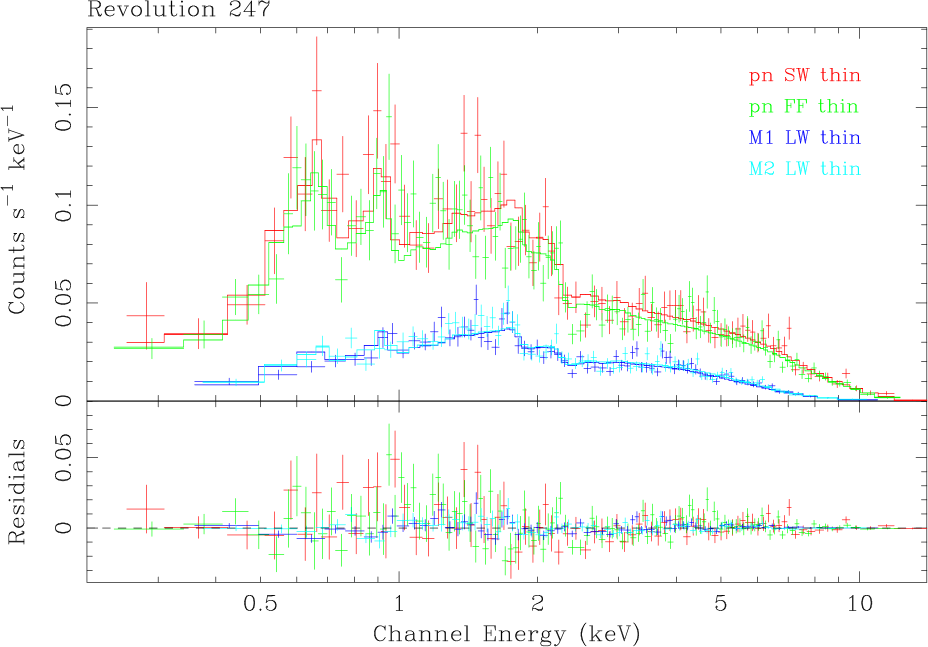
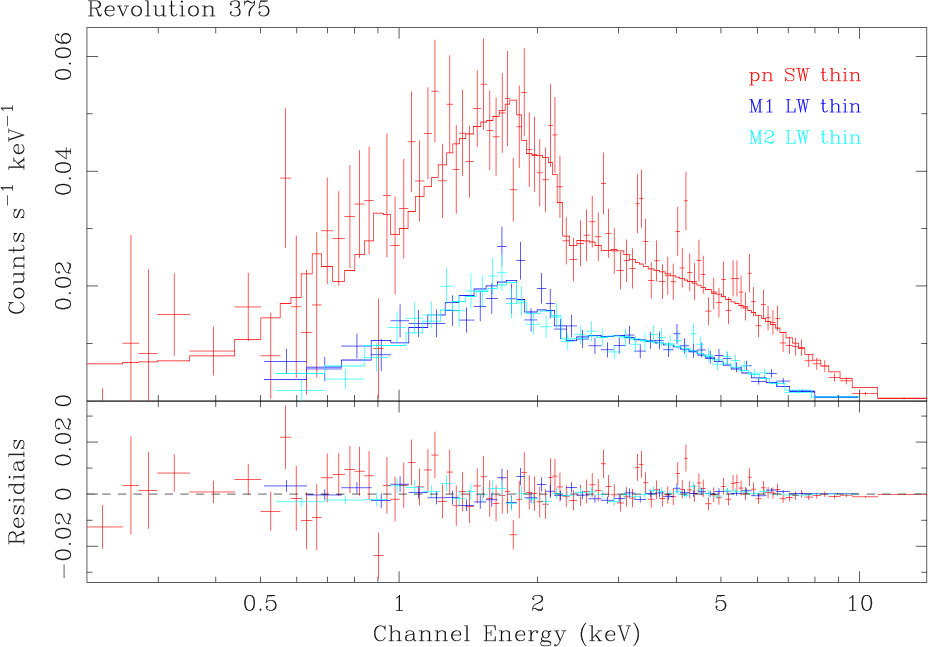
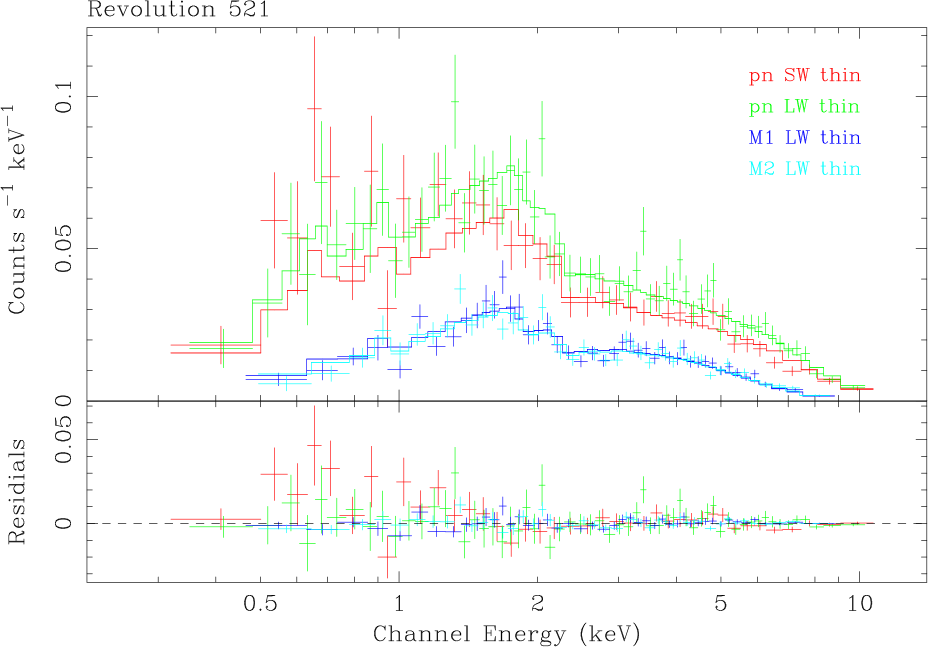
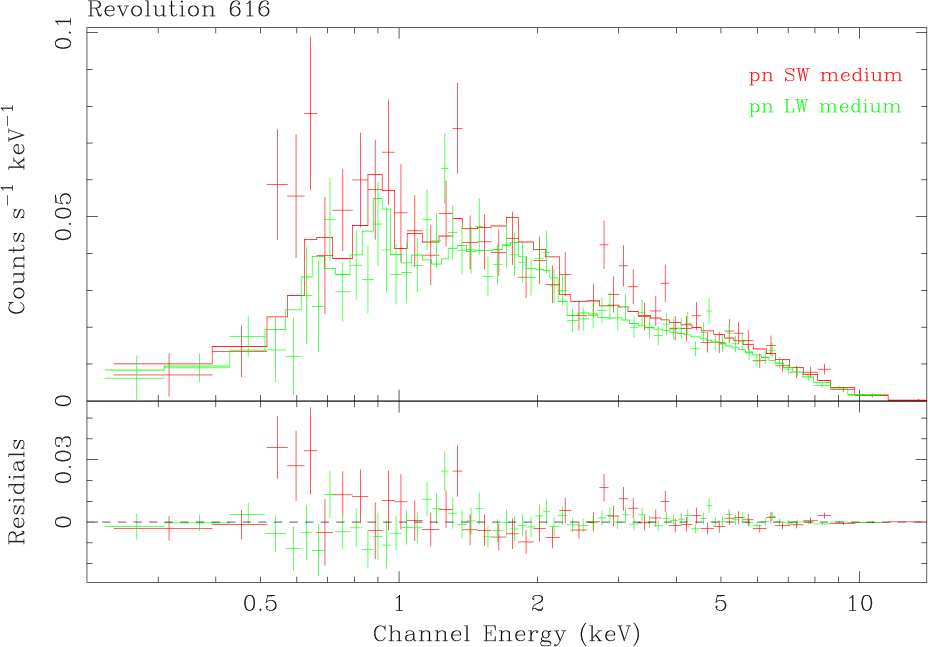
For the revolution 888 spectra two individual column density values were used for the two spectral components resulting in very different best fit values for NH of (5.7) cm-2 and 10728 cm-2 for the thermal and the power-law component, respectively. For all other observations the NH values were not significantly different and therefore the same (but free to vary in the fit) value was used for both components. Also the temperature was fixed at the value derived from the revolution 888 observation (kT = 0.150.04 keV). In Table 1 the results for the spectral fits are summarized: photon index , absorption column density NH, emission measure EM = nHne dV, together with fluxes and source luminosities and reduced values per degree of freedom (dof). In Fig. 3 the EPIC spectra together with the best fit models are plotted.
| Instr. mode | Rate(1) | NH | EM | Flux(1) | L | L | /dof | |
|---|---|---|---|---|---|---|---|---|
| filter | cts s-1 | cm-2 | 1058 cm-3 | erg cm-2 s-1 | erg s-1 | erg s-1 | ||
| 2000 Apr. 16/17 (Revolution 065) | ||||||||
| PN FF thin | 0.177 | 6.51.5 | 0.880.07 | 6.93 | 1.61 | 6.87 | 2.00 | |
| M1 LW thin | 0.052 | 7.18 | 1.66 | 7.13 | 2.08 | |||
| M2 LW thin | 0.051 | 6.90 | 1.60 | 6.84 | 2.00 | |||
| PN FF medium | 0.156 | 6.10 | 1.41 | 6.04 | 1.76 | |||
| M1 LW medium | 0.048 | 6.56 | 1.52 | 6.50 | 1.90 | |||
| M2 LW medium | 0.049 | 6.63 | 1.54 | 6.57 | 1.92 | 1.29/209 | ||
| 2001 Apr. 14/15 (247) | ||||||||
| PN SW thin | 0.413 | 6.20.4 | 0.840.03 | 22.1 | 3.59 | 1.54 | 5.61 | |
| PN FF thin | 0.376 | 20.0 | 3.25 | 1.39 | 5.08 | |||
| M1 LW thin | 0.121 | 21.9 | 3.55 | 1.52 | 5.55 | |||
| M2 LW thin | 0.126 | 21.9 | 3.57 | 1.53 | 5.58 | 1.24/347 | ||
| 2001 Dec. 25/26 (375) | ||||||||
| PN SW thin | 0.189 | 7.01.6 | 0.900.08 | 6.03 | 1.77 | 7.56 | 1.94 | |
| M1 LW thin | 0.064 | 6.86 | 2.01 | 8.61 | 2.20 | |||
| M2 LW thin | 0.063 | 6.73 | 1.97 | 8.44 | 2.16 | 1.19/177 | ||
| 2002 Oct. 13 (521) | ||||||||
| PN SW thin | 0.244 | 6.81.0 | 0.850.05 | 12.1 | 2.35 | 1.01 | 3.27 | |
| PN LW thin | 0.289 | 14.7 | 2.88 | 1.23 | 4.00 | |||
| M1 LW thin | 0.096 | 15.4 | 3.00 | 1.28 | 4.16 | |||
| M2 LW thin | 0.094 | 15.0 | 2.91 | 1.24 | 4.04 | 1.08/185 | ||
| 2002 Dec. 14 (552) | ||||||||
| PN SW thin | 0.244 | 6.51.3 | 0.910.09 | 4.83 | 5.50 | 2.36 | 1.12 | |
| PN LW thin | 0.289 | 5.74 | 6.56 | 2.81 | 1.33 | |||
| M1 LW thin | 0.096 | 5.63 | 6.41 | 2.75 | 1.30 | |||
| M2 LW thin | 0.094 | 5.83 | 6.64 | 2.84 | 1.35 | 0.82/63 | ||
| 2003 Apr. 20/21 (616) | ||||||||
| PN SW medium | 0.200 | 8.41.2 | 0.960.06 | 30.9 | 1.88 | 8.04 | 6.40 | |
| PN LW medium | 0.166 | 26.9 | 1.63 | 6.98 | 5.55 | 0.99/111 | ||
| 2003 Nov. 16 (721) | ||||||||
| PN FF thick | 0.143 | 6.21.1 | 0.910.05 | 8.53 | 1.32 | 5.65 | 2.14 | |
| M1 LW thin | 0.050 | 9.55 | 1.48 | 6.32 | 2.40 | |||
| M2 LW thin(4) | 0.036 | 7.66 | 1.18 | 5.07 | 1.92 | 1.48/125 | ||
| 2004 Apr. 28 (803) | ||||||||
| PN LW thick | 0.030 | 6.61.7 | 1.120.15 | 3.28 | 2.82 | 1.21 | 7.21 | 0.72/25 |
| 2004 Oct. 14 (888)(5) | ||||||||
| PN LW thick | 0.055 | 10728 | 1.030.34 | 4.19 | 7.31 | 3.13 | 1.34 | |
| M1 LW thick | 0.013 | 4.40 | 7.67 | 3.28 | 1.40 | |||
| M2 LW thick(4) | 0.008 | 3.18 | 5.56 | 2.38 | 1.02 | 1.48/45 | ||
(1) Net count rates and observed total fluxes in the 0.210.0 keV band.
(2) X-ray 0.210.0 keV luminosity (including absorption) for a distance of 60 kpc.
(3) Source intrinsic X-ray luminosity in the 0.210.0 keV band (corrected for absorption).
(4) Source on bad CCD column.
(5) Individual column density for the thermal plasma component NH = (5.7) cm-2. The temperature of the thermal plasma
model component was determined from this observation to kT = 0.150.04 keV and fixed in the fits to the other observations.
2.3 Energy dependence of pulsations
The pulsed fraction observed from RX J0103.6$-$7201 during revolution 616 is largely reduced (if present at all) in the 0.31.5 keV band compared to the 1.58.0 keV band. However, the observation from revolution 521 shows that there can be still a large contribution from the power-law component in the soft band. The observation from revolution 888 where the soft component was completely isolated is ideally suited to investigate the pulse profiles of both spectral components separately. This is shown in Fig. 4 and although the statistics is relatively poor, pulsations can be detected above 1.5 keV while below they are strongly reduced or may not be present at all.

2.4 Long-term intensity variations
To look at intensity variations of RX J0103.6$-$7201 on time scales of days to years we converted ROSAT and Chandra count rates obtained from source detection analyses into 0.210.0 keV fluxes. We assumed a power-law plus MEKAL spectrum with photon index 0.9, column density of 6.5 cm-2 and temperature 0.15 keV, typical values as derived from the EPIC spectra. Similarly, for EPIC observations with insufficient statistical quality (short exposure and/or low source flux) count-rates were used. For the estimates of ROSAT fluxes relatively large systematic errors may be introduced due to the strong influence of the assumed column density on the soft 0.12.4 keV band count rate to luminosity conversion (an additional NH of 1.0 cm-2 changes the conversion factor by 12%). The measured fluxes as function of time over nearly 13 years are plotted in Fig. 5. There seems to be a base flux level of 7.6 erg cm-2 s-1 below which the source was never seen. The maximum flux of 3.7 erg cm-2 s-1 is a factor of 50 higher and was reached during the XMM-Newton observation of revolution 247 (second part with EPIC-pn in FF mode). A similar outburst level was seen also during the third ROSAT observation, four Chandra and one other XMM-Newton observation. Chandra observations were often performed in blocks spread over 0.7 days during which the source stayed at a similar intensity level, indicating that high and low states last longer than that. The source was generally brighter (both, low and high intensity levels decreased) during the first half as compared to the second half of the last five years (Fig. 5) which may be related to long-term changes in the properties of the circum-stellar matter around the mass donor star.

2.5 Source identification
X-ray source positions were obtained from the analysis of all observations where the source was detected in the ACIS-I CCDs. The average position from 71 observations with a standard deviation of 11 is only 007 away from the 2MASS object 010337527201330 at RA = 01h03m37524 and Dec = –72°01′3303 (J2000.0) for which an error of 011 is given (Cutri et al. 2003). For comparison the average EPIC position is within 08 of the 2MASS position. This star is covered by the SMC UBVR CCD survey of Massey (2002) and also listed in the UBVI photometry catalogue of Zaritsky et al. (2002). Optical positions and available magnitudes are summarized in Table 2. The star can be identified with the emission line object ($[$MA93$]$ 1393, Meyssonnier & Azzopardi 1993). The presence of a 14.6 Vmag star inside the error circle of the Chandra position clearly establishes it as the optical counterpart of the X-ray source.
The inferred effective temperature and bolometric luminosity of the optical counterpart given by Massey (2002) suggest a spectral type of O5 V. Assuming this spectral type the measured BV index imply E(BV) of 0.32 and NH = 1.9 cm-2.
3 Discussion
3.1 RX J0103.6$-$7201, a Be/X-ray binary pulsar
The discovery of a 1323 s modulation in the X-ray flux from RX J0103.6$-$7201 increases the number of pulsars in the SMC to 49 from which up to 46 are most likely neutron stars in HMXB systems. The pulse period of 1323 s is the longest known from SMC pulsars. It considerably exceeds that of AX J0049.47323 (= RX J0049.77323) (756 s; Yokogawa et al. 2003) and is similar to that of RX J0146.9$+$6121 (Haberl et al. 1998) in the Milky Way. Optical spectra of 33 counterparts from HMXBs in the SMC identify the majority as Be-star binaries (Coe et al. 2005), while only one (SMC X-1) is a supergiant system. Brightness and colours of the optical counterpart and the presence of H emission (MA93) strongly suggest that also RX J0103.6$-$7201 is a Be/X-ray binary system.
The X-ray spectrum of RX J0103.6$-$7201 is typical for Be/X-ray binaries in the SMC. The power-law photon index of 0.9 is well within the relatively narrow range observed from these systems (Haberl & Pietsch 2004). The absorbing column density was found to be similar during most observations yielding (69) cm-2, except during the XMM-Newton observation in revolution 888 when NH exceeded cm-2. Such high values are usually seen only from supergiant HMXBs when the X-ray source is viewed through the dense innermost parts of the stellar wind of the supergiant before or after eclipse (e.g. 4U170037 and Vela X-1; Haberl et al. 1989; Sako et al. 1999). This suggests that we may view the system of RX J0103.6$-$7201 at high inclination and during 2004, Oct. 14 (revolution 888) the line of sight to the X-ray source crossed the wind region very close to the Be star. Since Be/X-ray binaries are much wider systems in comparison to supergiant systems such cases should be very rare. Indeed, RX J0103.6$-$7201 is to our knowledge the only Be/X-ray binary which has shown a spectrum with such extreme absorption. Alternatively absorption by dense material close to the neutron star cannot be ruled out, but may be expected to occur more often.
3.2 Soft emission in the X-ray spectra of Be/X-ray binaries
A soft spectral component in the X-ray spectrum of RX J0103.6$-$7201 was first reported by Sasaki et al. (2003) who analyzed the XMM-Newton data from revolution 247 and fit the EPIC-pn spectrum with thermal plasma and power-law components. This soft emission became clearly visible in the revolution 888 observation when both spectral components were separated into different energy bands. From Table 1 it is evident that the intensity of the soft component, given as emission measure (which directly reflects the intrinsic luminosity of the soft component) in the range of (330) cm-3 strongly correlates with the intrinsic source luminosity. This is demonstrated in the top panel of Fig. 6 where the luminosity of the soft component is plotted versus the total source luminosity.
Similar soft emission was also observed from the pulsars EXO 053109$-$6609.2 with XMM-Newton (Haberl et al. 2003) and RX J0059.27138 in a simultaneous ROSAT/ASCA observation (Kohno et al. 2000) with emission measures of 4 cm-3 and cm-3, respectively. RX J0059.27138 was observed at a luminosity of 2.5 erg s-1, i.e. both luminosity and emission measure were a factor of 40 higher compared to the maximum values observed from RX J0103.6$-$7201. On the other hand, for EXO 053109$-$6609.2 an intrinsic source luminosity of 4.6 erg s-1 was reported which yields a ratio EM[cm-3]/Lx[erg s-1] of 8.7 a factor of 20 higher than for RX J0103.6$-$7201. Sasaki et al. (2003) report two more SMC pulsars which exhibit a soft emission component. We re-analyzed the EPIC-pn spectra of RX J0101.37211 and AX J0103722 in a consistent way as was done for RX J0103.6$-$7201. Keeping the temperature of the thermal plasma component fixed at 0.15 keV and using a common NH for soft and hard (power-law) component we derive EM and intrinsic source luminosity (0.210.0 keV). The results, together with the values found in the literature, are included in the bottom panel of Fig. 6. They are consistent with the linear relation between EM (or luminosity of the soft component) and total source luminosity derived for RX J0103.6$-$7201 with EM [cm-3] = 4Lx [erg s-1] (plotted as straight line). Here we use EM instead of luminosity of the soft component to be able to compare with published data.
Hickox et al. (2004) explored four possible mechanisms for the origin of the soft excess in X-ray pulsars: 1) re-processing of hard X-rays by optically thick, dense material near the neutron star; 2) re-processing by optically thin material; 3) thermal emission from collisionally ionized plasma and 4) soft emission from the accretion column and the neutron star surface. They conclude that for luminous sources (L erg s-1) only case 1) can explain the strong soft component while for luminosities below erg s-1 all three other cases can contribute.
The tight correlation between the luminosity of the soft spectral component and the total source luminosity we found for RX J0103.6$-$7201 over a factor of 10 in luminosity and moreover extending to three orders of magnitude when including results from three other SMC Be/X-ray binary pulsars strongly suggests that there is a single mechanism at work over a wide range of source intensity. The correlation as such makes emission from a collisionally ionized plasma unlikely and supports the models involving re-processing of the X-ray emission from the neutron star. Therefore, the MEKAL model is actually not the proper model to derive parameters of the emitting plasma like temperatures or elemental abundances. However, it best fits the soft part of the EPIC spectra among all available simple XSPEC models and allows to accurately determine fluxes.


The pulsed fraction observed from RX J0103.6$-$7201 is largely reduced (if present at all) at energies below 1.5 keV. Similarly, no pulsations at energies below 0.4 keV were seen from the 2.76 s pulsar RX J0059.27138 (Kohno et al. 2000) which indicates a size for a re-processing region with r cP cm. To smear out longer pulse periods the size must be correspondingly larger and for RX J0103.6$-$7201 would require a size 4 cm. An independent very rough estimate for the size of the re-processing region can be derived from the emission measure nHne dV 4/3 r3n and the absorbing column density nH dr rNH. For EM in the range of (330) cm-3 and a typical local NH of 6 cm-2, r is in the range 2 cm to 2 cm (increasing with higher EM and hence source luminosity). If the large absorption observed from revolution 888 for the power-law component is caused by dense stellar matter close to the Be star, than these latter size estimates must be regarded as upper limit. A lower limit of 1 cm can then be derived using the high NH value. These simple estimates argue for reprocessing of the hard X-rays in a large part of the optically thin stellar wind. The correlation of soft flux with source intensity for four Be/X-ray binaries in the SMC suggests that this mechanism is the dominant process to create the soft spectral component at least in HMXBs with a Be star as mass donor.
It remains to be explained why EXO 053109$-$6609.2 exhibits a much stronger soft component compared to the SMC Be/X-ray pulsars. It is unlikely that the higher metallicity of the LMC can cause a factor of 20 increase in reprocessing efficiency. EXO 053109$-$6609.2 has shown a more complex spectrum during the XMM-Newton observation reported by Haberl et al. (2003) which may be interpreted as partial covering of the X-ray source. Hence, a large fraction of the hard emission might be completly blocked and the total source luminosity underestimated. Other Be/X-ray binaries in the LMC with a soft emission component need to be observed to verify if EXO 053109$-$6609.2 is an exceptional case (e.g. A 053866, Mavromatakis & Haberl 1993).
Acknowledgements.
We are grateful to Manami Sasaki for providing the EPIC spectra of SMC pulsars with soft emission for our re-analysis. The XMM-Newton project is supported by the Bundesministerium für Bildung und Forschung / Deutsches Zentrum für Luft- und Raumfahrt (BMBF / DLR), the Max-Planck-Gesellschaft and the Heidenhain-Stiftung.References
- Coe et al. (2005) Coe, M. J., Edge, W. R. T., Galache, J. L., & McBride, V. A. 2005, MNRAS, 356, 502
- Cutri et al. (2003) Cutri, R. M., Skrutskie, M. F., van Dyk, S., et al. 2003, VizieR Online Data Catalog, 2246, 0
- Haberl et al. (1998) Haberl, F., Angelini, L., & Motch, C. 1998, A&A, 335, 587
- Haberl et al. (2003) Haberl, F., Dennerl, K., & Pietsch, W. 2003, A&A, 406, 471
- Haberl et al. (2000) Haberl, F., Filipović, M. D., Pietsch, W., & Kahabka, P. 2000, A&AS, 142, 41
- Haberl & Pietsch (2004) Haberl, F. & Pietsch, W. 2004, A&A, 414, 667
- Haberl & Sasaki (2000) Haberl, F. & Sasaki, M. 2000, A&A, 359, 573
- Haberl et al. (1989) Haberl, F., White, N. E., & Kallman, T. R. 1989, ApJ, 343, 409
- Hickox et al. (2004) Hickox, R. C., Narayan, R., & Kallman, T. R. 2004, ApJ, 614, 881
- Kohno et al. (2000) Kohno, M., Yokogawa, J., & Koyama, K. 2000, PASJ, 52, 299
- Majid et al. (2004) Majid, W. A., Lamb, R. C., & Macomb, D. J. 2004, ApJ, 609, 133
- Massey (2002) Massey, P. 2002, ApJS, 141, 81
- Mavromatakis & Haberl (1993) Mavromatakis, F. & Haberl, F. 1993, A&A, 274, 304
- Mewe et al. (1985) Mewe, R., Gronenschild, E. H. B. M., & van den Oord, G. H. J. 1985, A&AS, 62, 197
- Meyssonnier & Azzopardi (1993) Meyssonnier, N. & Azzopardi, M. 1993, A&AS, 102, 451
- Sako et al. (1999) Sako, M., Liedahl, D. A., Kahn, S. M., & Paerels, F. 1999, ApJ, 525, 921
- Sasaki et al. (2000) Sasaki, M., Haberl, F., & Pietsch, W. 2000, A&AS, 147, 75
- Sasaki et al. (2003) Sasaki, M., Pietsch, W., & Haberl, F. 2003, A&A, 403, 901
- Strüder et al. (2001) Strüder, L., Briel, U., Dennerl, K., et al. 2001, A&A, 365, L18
- Turner et al. (2001) Turner, M. J. L., Abbey, A., Arnaud, M., et al. 2001, A&A, 365, L27
- Yokogawa et al. (2003) Yokogawa, J., Imanishi, K., Tsujimoto, M., Koyama, K., & Nishiuchi, M. 2003, PASJ, 55, 161
- Zaritsky et al. (2002) Zaritsky, D., Harris, J., Thompson, I. B., Grebel, E. K., & Massey, P. 2002, AJ, 123, 855