Classical Novae as a Probe of the Cataclysmic Variable Population
Abstract
Classical Novae (CNe) are the brightest manifestation of mass transfer onto a white dwarf in a cataclysmic variable (CV). As such, they are probes of the mass transfer rate, , and WD mass, , in these interacting binaries. Our calculations of the dependence of the CN ignition mass, , on and yields the recurrence times of these explosions. We show that the observed CNe orbital period distribution is consistent with the interrupted magnetic braking evolutionary scenario, where at orbital periods mass transfer is driven by angular momentum loss via a wind from the companion star and at by gravitational radiation. About 50% of CNe occur in binaries accreting at with , with the remaining 50% split evenly between longer (higher ) and shorter (lower ) than this. This resolution of the relative contribution to the CN rate from different CVs tells us that CVs with WD mass are needed to produce one CN per year. In addition, one CN per year requires a CV birthrate of , and likely ejects mass into the ISM at a rate . Using the K-band specific CN rate measured in external galaxies, we find a CV birthrate of yr-1 per , very similar to the luminosity specific Type Ia supernova rate in elliptical galaxies. Likewise, we predict that there should be 60-180 CVs for every in an old stellar population. The population of X-ray identified CVs in the globular cluster 47 Tuc is similar to this number, showing no overabundance relative to the field.
The observed CN distribution also contains evidence for a CV population which has no period gap. These are likely systems with a strongly magnetic WD (Polars) in which it has been suggested that the field interferes with the wind of the companion, limiting angular momentum losses to those of gravitational radiation and eliminating the period gap. With this reduced , Polars evolve more slowly than systems which undergo magnetic braking. Using a two-component steady state model of CV evolution we show that the fraction of CVs which are magnetic (22%) implies a birthrate of 8% relative to non-magnetic CVs, similar to the fraction of strongly magnetic field WDs.
Subject headings:
binaries: close—novae, cataclysmic variables– stars: statistics —white dwarfs1. Introduction
A Classical Nova (CN) outburst is the result of a thermonuclear runaway in the hydrogen-rich accreted layers on a white dwarf (WD) in a mass transferring cataclysmic variable (CV) binary (see Shara 1989 for a review). The number of CNe with measured orbital periods, , has been increasing; Diaz & Bruch (1997) made a first comparison to the CN period distribution with 30 objects, and recently Warner (2002) listed for 50 CNe. These range from 1.4 hours to more than 16 hours, with most below 5 hours. Cataclysmic variables (CVs; Warner 1995) consist of a WD primary accreting mass from a normal low-mass star that is filling its Roche lobe, and spend most of their life accreting at rates – yr-1 (e.g. Howell, Nelson, & Rappaport 2001, herafter HNR). CVs are formed when the companion (of mass ) to a WD (made during a common envelope event) comes into contact with its Roche lobe as a result of angular momentum losses. The CV evolves toward shorter orbital periods as the binary loses angular momentum at a rate and the companion transfers mass to the WD at a rate . The orbital period distribution of CN, a direct reflection of the CN frequency, provides a diagnostic of in CVs over the time to accumulate an unstable layer, years.
It is generally thought that the paucity of CVs with 2 hr 3 hr (e.g. Shafter 1992), the so-called period gap, is due to switching between a high state above 3 hours to a comparatively low state below 3 hours (e.g. HNR). Upon such a sudden reduction in , the requisite reduction in causes the companion, which has been slightly out of thermal equilibrium due to the high mass loss rate, to contract and fall inside the Roche lobe, halting mass transfer. Eventually as continues to decrease due to angular momentum loss, Roche lobe contact is reestablished. The simplest paradigm of CV evolution holds that is determined by the WD mass , and . Interrupted magnetic braking (IMB) has arisen as a good candidate for prescriptions (see e.g. Paczynski & Sienkiewicz 1983; Rappaport et al. 1983; Spruit & Ritter 1983; Hameury et al. 1988; Kolb 1993; HNR). In the IMB scenario, is initally driven by angular momentum lost in the stellar wind of the secondary star (Verbunt & Zwaan, 1981) for hours. The magnetic braking is interrupted (potentially by the loss of the radiative core), and falls to that carried away by gravitational radiation (see e.g. Faulkner 1971; Paczynski & Sienkiewicz 1981; Rappaport et al. 1982). IMB explains the period gap of the CV population and the predicted agrees with observations of the WD surface temperatures (Townsley & Bildsten, 2003). This agreement is somewhat surprising because modern measurements of for isolated low mass stars do not appear to follow the law used in the IMB scenario (Andronov et al., 2003). IMB also makes a very important but unconfirmed prediction: that CVs evolve across the period gap.
For a given composition of accreted material, there are three independent parameters that set , and thus the CN rate: , , and . Many previous studies (e.g. Truran & Livio 1986; Ritter et al. 1991) focused only on the dependence of the CN frequency on . Here we focus on ’s dependence on . Townsley & Bildsten (2004) (hereafter TB04) showed that, after extended accretion and many CN cycles, is set by because of accretion’s impact on the thermal state of the WD core during the long interval between CNe. Given any relation, TB04’s calculation of enables the first consistent prediction of how the CN rate varies with orbital period. Using dependent values calculated at several values (Prialnik & Kovetz, 1995), Nelson et al. (2004) showed clearly that this knowledge of is essential for a conclusive prediction of the distribution. In Section 2 we briefly review the work of TB04, and in Section 3 we apply it to calculate the CN period distribution and compare to that observed. We find that IMB is remarkably consistent with the observed CN frequency, yielding a firm relationship between observed CN frequency and the CV population. Confirming this scenario finally allows us to use the observed CN rate to infer the number of underlying CVs. This impacts searches for CVs in the field, as well as in globular clusters, as we note in Section 4.
2. Classical Nova Ignition Masses
IMB predicts that typical accretion rates near -4 hours are , and decrease to below 2 hours. This factor of 20 drop in across the period gap requires that the dependence of be taken into account when explaining the orbital period distribution of CN. These two ’s lead to different ignition modes. For the higher , TB04 found that the CN is triggered by trace 3He in the accreted material (Shara, 1980), leading to a CNO burning runaway in a radiative layer. At the lower , however, the CN outburst is triggered by the chain when the base of the accreted shell is conductive. This wide range of conditions means that the prior prescriptions of ignition, such as a single unique pressure (Gehrz et al. 1998; Warner 2002) or taking independent of (Ritter et al. 1991; Diaz & Bruch 1997), are wholly inadequate.
By considering the release of energy due to compression of the accreted layers, TB04 calculated the rate of heat loss or gain of the WD core. This rate varies as the accreted layer builds up, and by taking the average loss or gain to be zero TB04 found an equilibrium, , which the WD will approach under prolonged accretion. For hours, the magnetic braking phase, the WD has only marginally enough time, years, to reach . However, at these accretion rates, is insensitive to if it is lower than because the ignition occurs in a layer which is not conductively coupled to the core. Hence the temperature is set by the response of the envelope to the energy being released by compression (TB04). At lower , determines , but the low state for CVs is long-lived ( years), allowing the WD core to reach . Thus, for CV evolution, use of provides ’s which are self-consistent and independent of assumptions about the WD thermal state. This is in contrast to all prior calculations (see e.g. Fujimoto 1982; MacDonald 1984; Prialnik & Kovetz 1995). The values found by TB04 are K for , lower than the lowest considered by Prialnik & Kovetz (1995) in their broad parameter survey.
Models of donor evolution in CVs (D’Antona & Mazzitelli, 1982; Iben & Tutukov, 1984; McDermott & Taam, 1989) show that the 3He abundance reaches mass fractions of when the orbital period is 3-4 hours (the companion mass is below ). This is when the star has lost enough mass and the convection layer has become deep enough that the partially-fused material in the stellar interior is uncovered. Precisely when this occurs and the reached is sensitive to the donor’s initial mass, but generally does not exceed 0.003. We are most interested in CN rates for hours, so we include a fraction in our ignition models.
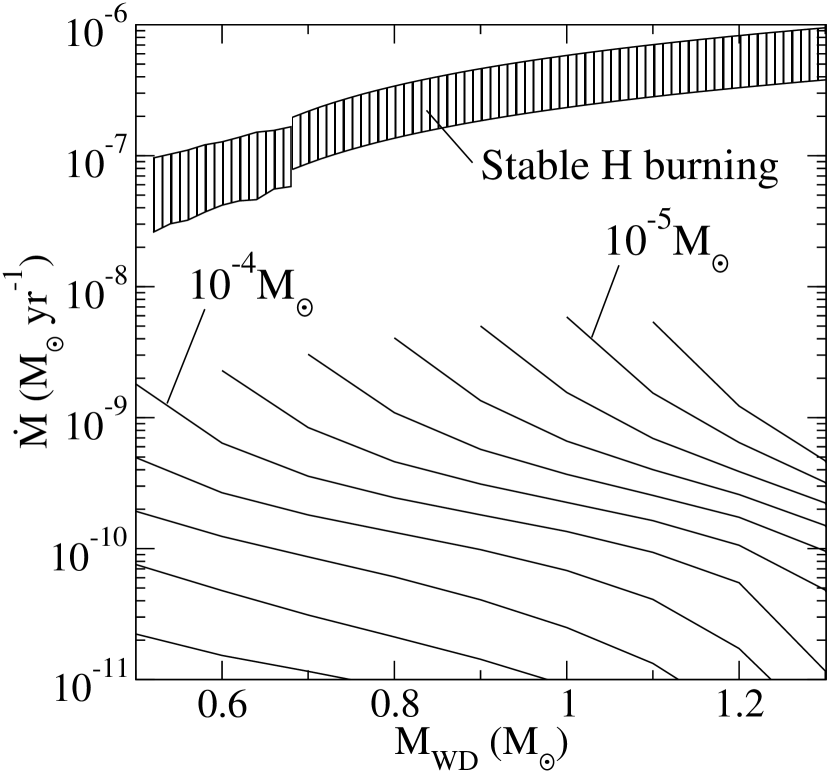
The results of TB04 are shown in Figure 1. Compared to previous ignition mass calculations, TB04 found larger at due to the lower , and similar at due to offseting effects of the lower and the inclusion of 3He leading to an earlier trigger. TB04 found that for the few systems which have a known ejected mass and (giving some indication of ), the ejected masses are similar to , implying that each CN ejects approximately the amount of material accreted since the last event. TB04’s results do not show the trivial scaling assumed for a unique ignition pressure (see their discussion). An ignition pressure of dyne cm-2 would have , and contours which are vertical lines at , 1.0 and . (This ignition pressure is used by Gehrz et al. (1998) in their discussion of the nucleosynthetic impact of nova ejecta.) As we will see, most CNe have , and thus lower than this prescription implies.
Also shown in Figure 1 is the region (hatched) where steady burning is expected. For , the calculations of Piersanti et al. (2000) are shown. For the upper bound is found from the core mass-luminosity relation of Paczyński (1970), and the lower bound is taken to be 0.4 of this (Nomoto, 1982). At higher , envelope buildup and expansion into a giant is expected.
3. The Classical Novae Orbital Period Distribution
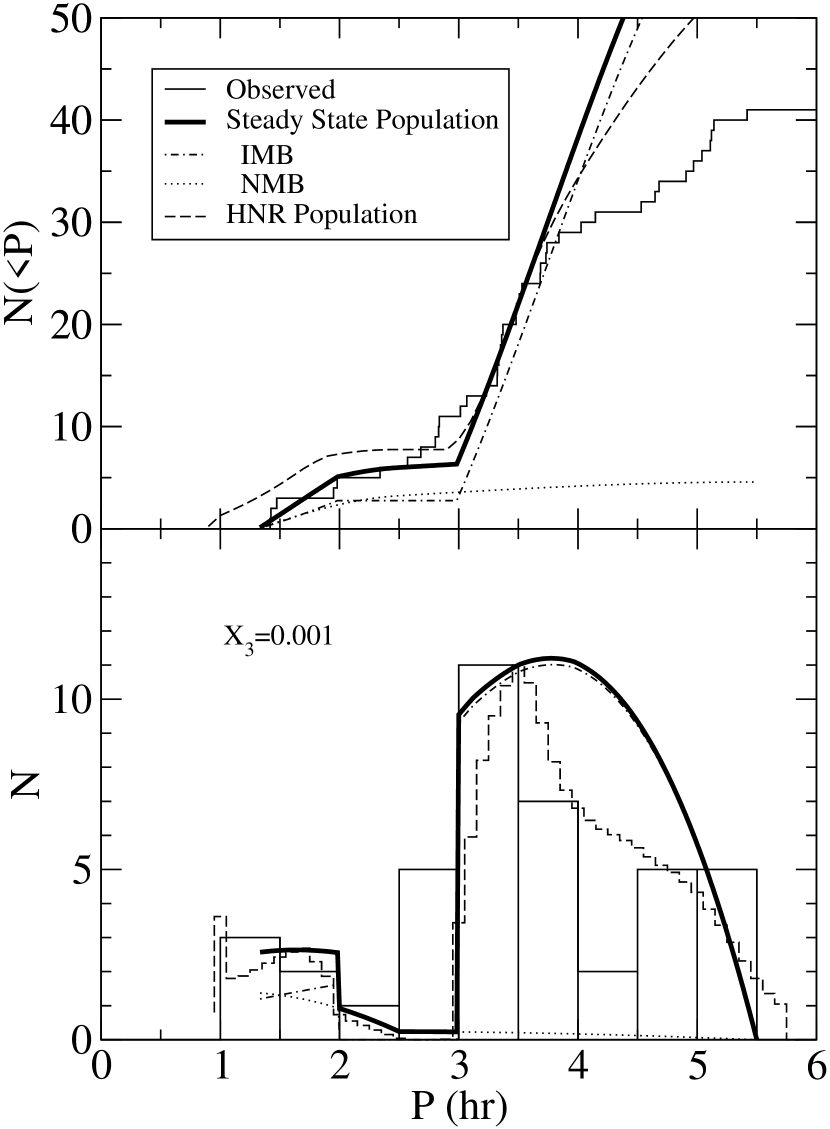
The observed distribution of CN orbital periods (Warner, 2002) is shown in Figure 2 by the thin solid line. These data differ only very slightly from the collection in Ritter & Kolb (2003). We have neglected any selection effects, as they have not been satisfactorily quantified to date. These are complex, so we will not attempt a conclusive discussion, only mention two important ones, CN outburst brightness and remnant brightness. The tables in Prialnik & Kovetz (1995), for the coldest and , imply that CN outbursts for systems with are 3-4 times as bright as those for systems with yr-1. However, the spatial distribution in the Galaxy and the effects of absorption must be considered in order to judge how the observed population reflects this brightness variation. (See Ritter et al. 1991 for some discussion.) It is likely that remnant brightness depends on , and thus , introducing additional selection effects in remnant recovery and characterization.
3.1. Using Previous Population Synthesis Calculations
In order to calculate the CN frequency we must first use the IMB prescriptions to obtain from . Since the secondary fills its Roche Lobe, is directly related to by its mass-radius relation. We enforce , so that . To reproduce IMB for hours we use the magnetic braking law from HNR (see also Rappaport, Verbunt, & Joss 1983)
| (1) |
When the binary is evolving under the influence of magnetic braking, the is large enough that the secondary is out of thermal equilibrium and therefore has a larger radius than a main sequence star of the same mass (the effect that leads to the period gap). In order to account for this we use the - relation found by HNR using a bipolytrope model for the secondary and evolving under equation (1), . For hours, we apply gravitational radiation losses given by
| (2) | |||||
where is the moment of the binary about the orbital center, , is the orbital separation and . We use for a star in thermal equilibrium also from HNR. These - relations give a period gap (transition from the former to the latter) at 2-3 hours when the donor is , as found for this “standard model” (Model A) in HNR.
In addition to and the IMB prescriptions we also require a CV population model to construct the CN orbital period distribution. Detailed Monte Carlo CV population models are explored by HNR and by Nelson et al. (2004), in the same context as here, but without the TB04 predictions of from . HNR calculated the number of CVs per period interval, which we denote so that is the number with orbital periods between and . We use a single characteristic mass in lieu of a detailed distribution. For the HNR population we use , the average CN for their populations, and .
Using the above relationships to obtain , from HNR, and the from TB04, the resulting CN distribution is shown by the dashed line in Figure 2, and is normalized to match at hours. The most noticeable difference between this and our steady-state model presented below (thick solid line) is how the CV population based on HNR drops off at long due to the CVs being born throughout the 3.5-6 hour range. The exact form of this turnover depends on the common envelope phase (Nelson et al., 2004) through the orbital period distribution of the common envelope products. By construction, the HNR distribution lacks systems in the period gap. Every system which comes into contact with a companion that has a radiative core ( hours) goes through a MB phase. This distribution matches quite well in both the 1-2 hour and 3-4 hour regions, keeping in mind the noise present in the observed distribution. The HNR population extends down to 1 hour due to the famous discrepancy in the period minimum between observation and theory (Kolb & Baraffe, 1999).
3.2. Simpler Population Calculations
In order to understand how the distribution depends separately on the distribution of and the CV birth distribution, we also construct a steady-state population with a specified birth distribution. CVs are born (i.e. come into contact and initiate mass transfer for the first time) at a variety of orbital periods determined by the distribution of and after the common envelope event. For a population of CVs per period interval with characteristic mass , conservation implies
| (3) |
where is the CV birth rate per period interval, i.e. the number of CVs per year which commence accretion for the first time between and . We assume that all matter accreted from the companion is ejected in the CN, consistent with current observations (TB04), so that is constant. We also assume that the CV birthrate has been constant over the last 4 Gyrs, the time it takes a CV to reach the period minimum at minutes (HNR). Beyond this point the companion becomes essentially fixed in radius, so that the binary expands and drops quickly. These assumptions give a steady-state () CV population whose number density per period interval from equation (3) is
| (4) |
where we assume no systems at large .
As noted above, the secondary’s mass-radius relation is well characterized by a power law, and so for Roche Lobe filling systems is approximately a constant, typically between 0.5 and 1. Thus and the CN frequency per period interval is
| (5) |
The direct dependence on cancels for this observable. By far the most important part of the remaining dependence is in . Evaluating across the period gap, is constant, while changes by 50% due to bloating of the companion above the gap. On the other hand is expected to change from to , causing (from Figure 1) to increase from to , a factor of . Thus the CN orbital period distribution directly reflects through its effect on . With the consistent calculation of from provided by TB04, we can probe the - relation directly by comparing the steady state population to observations. Evidence for evolution across the gap is then contained in the degree to which a single steady state distribution can reproduce the observations.
We use a binary with as representative, since the actual mass distribution is very sensitive to the common envelope prescription (Nelson et al., 2004). Also, we set because this is the approximate level expected in the accreted matter (See section 2). In order to account for the possibility of systems which do not undergo magnetic braking, we use three populations. The first follows the IMB scenario (the IMB population), while the others only have applied (the NMB [No Magnetic Braking] populations). In the NMB case the secondary mass-radius relation is that of an equilibrium main sequence star from HNR.
Though the detailed form of the birth distribution above the gap is sensitive to the CE prescription (HNR; Nelson et al. 2004), we employ a constant between 3 and 5.5 hours for the IMB population. This capures the contrast in classical nova rate across the gap without depending explicitly on a particular CE prescription. CVs born with hours do not undergo magnetic braking in the IMB scenario. We call this population the NMBb (NMB below gap) population, and it has constant between 1.3 and 2.5 hours. A second NMBa (NMB all periods) population represents systems which do not undergo magnetic braking regardless of their birth (see discussion of magnetic systems below). This population has a constant birth function between 1.3 and 5.5 hours. Note that, unlike the HNR population, we directly specify the minimum . These birthrates can then be used in equation (4) and (5), and the relative birth fractions for each population are given by .
This steady state population is shown as the thick solid line in Figure 2, arbitrarily normalized to match the observed distribution (thin solid line) at 3.5 hours. The relative birth fractions for the curve shown are NMBa: 8%, IMB: 46%, NMBb: 46%. This model reproduces the major features of the observed population below 4 hours, including the slope in the cumulative distribution between 3 and 4 hours. The dependence on the common envelope prescription and binary population parameters is essentially contained in the average , to which the shape of the curve is insensitive. The effect of a 30% change in is small compared to the times difference in across the period gap.
The contrast in CN rate across the period gap does have some dependence on . Under gravitational braking only, as is the case below the period gap, is low enough that is insensitive to . However, the CN rate above the period gap, where magnetic braking enhances , does depend on . The dependence can be estimated by using the ignition density, from TB04, and combining with an ideal gas EOS, , and the power-law form of a free-free radiative envelope , to obtain . This scaling is confirmed by numerical calculations. Thus the expected maximum value of (see Section 2) leads to a 50% enhancement of the CN rate above the period gap over . Matching this new normal distribution to the observations at 3.5 hours, the rate below the gap is 2/3 of that shown in figure 2, still consistent with the observations. Thus the value we have adopted, is expected from donor evolution and provides the best fit to the data when birthrates above and below the period gap are assumed to be approximately equal.
The observed orbital period distribution of CN is consistent with CVs evolving across the period gap, and magnetic braking between 3 and 4 hours governed by a law like equation 1. As shown by the thick (model) and thin (data) solid lines in figure 2, the contrast between the 1-2 and the 3-4 hour ranges is of the appropriate size for a population in which above 3 hours is enhanced by magnetic braking. This contrast in CN rate is entirely due to the dependence of on .
3.3. Magnetic Accretors with No Magnetic Braking
The two components included in the model population, IMB and NMB, are also shown separately as the dot-dashed and dotted lines. These demonstrate the significant enhancement that magnetic braking implies in the CN rate over gravitational radiation alone. The prediction of a NMB model with (all systems being born at long periods) falls weakly to shorter orbital period in the normal distribution, as for the IMB curve below 2 hours. With a constant , a NMB model monotonically increases to shorter orbital periods as seen for the dotted lines. Thus a NMB model alone is inconsistent with the observed orbital period distribution. The period distribution is also satisfactorily reproduced without the addition of the NMB population, making our confirmation of the IMB prescriptions and evolution across the gap robust with some evidence for additional systems in and below the gap. Measurement of this additional contribution is limited by the current quality of data.
There are two reasons a CV might not undergo the MB phase. For example, if MB cannot work when the companion is fully convective, then there is a minimum companion mass () for having an MB phase. We have implemented this by placing all systems born with hours in a NMB population. This can also be seen in the the small number of systems between 2 and 2.5 hours in the HNR population. Additionally, motivated by the lack of a clear period gap for magnetic CVs (Verbunt, 1997), Li et al. (1994) have conjectured that in Polars the WD magnetic field prevents MB. Recent measurements of magnetic WDs (Araujo-Betancor et al., 2005; Gänsicke & Townsley, 2005) show that above the period gap, magnetic CVs have a significantly lower than Dwarf Novae at the same orbital period, providing direct evidence that magnetic CV evolution is quite different from that of non-magnetic systems.
The absolute relative populations of magnetic and nonmagnetic CVs is not well known because they are dominated by different and difficult to quantify selection effects. Approximately 22% of known CVs are magnetic (Araujo-Betancor et al., 2005). Using this steady state two component population model we find that, due to the slower evolution in the absence of MB, this requires that 8% of CVs born have strongly magnetic WDs, comparable to the fraction among field WDs (Jordan, 1997; Wickramasinghe & Ferrario, 2000). While giving tantalizing hints, the small number of observed systems makes it impossible to separate the prospective magnetic and non-magnetic contributions to the NMB population.
4. Discussion and Conclusion
We have shown that a very simple CV population model with the assumptions of IMB and the calculated by TB04 reproduces the orbital period distribution of CN, supporting the idea that CVs evolve across the period gap. This agreement is independent of the outcome of the common envelope phase or properties of the primordial binary population. CN are one CV phenomena that is sensitive to averaged over the longest timescales, the CN recurrence time, years. The agreement with IMB provides additional evidence that the IMB prescriptions do indeed provide accurate long term average ’s for CVs. Townsley & Bildsten (2003) similarly found that the WD in dwarf nova systems, which reflects due to compression of the envelope, matches the predictions of IMB. The existence of CN with in the period gap implies that not all systems undergo IMB evolution, possibly due to inhibition of the secondary’s wind by a strong WD magnetic field (Li et al., 1994). This inhibition will lead to slower evolution of magnetic CVs, and thus increase their relative number in the CV population. We find that in order to obtain the 22% fraction of magnetic CVs observed (Araujo-Betancor et al., 2005), a relative birth fraction of magnetic CVs of 8% is required, comparable to the fraction among field WDs (Jordan, 1997; Wickramasinghe & Ferrario, 2000).
With a satisfactory distribution in hand, the total number of classical novae observed provides a measurement of the CV population. This conversion does not depend directly on CE parameters, because a relatively small number of both observed novae and CVs in general have hours, where the birth distribution is important. The conversion does, however, depend on the typical WD mass, due to its importance in setting . Note also that while most CV WDs have , including many helium WDs (HNR), the average CN mass is sensitive to the upper end of the mass distribution (Nelson et al., 2004). Knowledge of the distribution allows proper adjustment for the fact that while most CVs are below the period gap, most CN are in CVs above the period gap. This is a fairly short-lived period of the CV’s lifetime, lasting only Myr (HNR), which is preceded by the post common envelope inspiral and followed by accretion below the period gap during which the CN rate is much lower. We find that one CN per year implies () CVs above the period minimum, Gyr (4 Gyr) and a CV birthrate of () if the average CN mass is ().
Since pre-CVs finish the common envelope phase with a wide range of orbital periods, the total CV and pre-CV population, and thus the CN rate, should relate to the total amount of low-mass stars, which is well represented by the K-band light. The apparent dependence of nova rate on stellar population is still uncertain, but points to these older populations. Surveys of nova rates in external galaxies (Williams & Shafter, 2004) continue to show that the K-band specific nova rate is about and does not depend strongly on galaxy type in nearby galaxies, with the exception of the LMC and SMC. M31 shows evidence that the classical nova rates might be dominated by the bulge population (Shafter & Irby, 2001). Our work allows us to convert the K-band specific Nova rate into the CV population and birthrate, giving 60-180 CVs above the period minimum for every in an old stellar population and CVs born per year per . The 24-133 CVs estimated from Chandra observations of 47 Tuc (Heinke et al., 2005) is consistent with the 60-180 predicted by our work for the cluster mass ( Pryor & Meylan 1993), and agrees with the CN rate implied by the one or two CNe observed in the last yr in the Galactic GCs (Shara et al., 2004). Thus the GC CV population appears comparable to that in the field. The Type Ia supernova rate in elliptical galaxies is per year per (Mannucci et al., 2004), remarkably close to the CV birthrate. However, all indications are that the WD masses in CVs are not nearly large enough (TB03) to be Type Ia progenitors (Branch et al., 1995).
The local galactic K-band luminosity density is 0.1-0.2 (Olling & Merrifield, 2001), giving a local CV space density of approximately again for an average mass of 1.0 (0.6) . This agrees well with the found by Politano (1996) from a theoretical calculation of the CV birthrate. This space density is only slightly higher than the inferred from the PG survey (Ringwald, 1996), but more than 10 times the pc-3 obtained by Downes (1986). Both these survey numbers assume a scale height of CVs of 150 pc, whereas the above K-band luminosity density assumes a scale height of low mass stars of 300 pc. Although more modern color selected surveys exist, the lack of a broadly applicable, accurate CV distance measure hinders improved measurements of the space density.
In a similar manner, the total rate of matter injected into the ISM can be evaluated in terms of the CN outburst rate. Since we are assuming that all the matter transferred onto the WD is ejected in each CN outburst, this is just the average for the population times the total number of systems. We find that yr-1 ( yr-1) is ejected into the ISM for each CN/yr if the average CN mass is 1.0 (). The average initial mass of the donor contributes additional uncertainty, but generally less than that due to the unknown average WD mass. Though somewhat lower than the value of per CN outburst found by Truran & Livio (1986), these values are similar to the per outburst used by Gehrz et al. (1998) to estimate the impact of nucleosynthesis in CN outbursts on both the ISM and primordial solar system material. An interesting effect of the contrast in across the gap is that while approximately 85% of CN outbursts occur above the period gap and only 2% of pre-period minimum systems are above the gap, approximately equal processed matter is contributed by objects above and below the period gap before the period minimum. This means that the type of CN which are observed most often are only half the story for ISM injection.
With proper calibration, classical novae provide a useful standard candle for extragalactic distance measurements (della Valle & Livio, 1995). The principle impediment to this usage is that the single measured parameter available for calibration, the rate of decline, depends on , and . TB04 calculated consistently from , eliminating it as a free parameter. Here we have demonstrated that IMB provides a satisfactory prediction of the distribution in the Galactic CV population, finding that CN outbursts occur predominantly when , with a significant tail at lower . This leaves only to be calibrated from the rate of decline. Thus, with the support of theory, a statistically complete measurement of nova magnitudes and decline rates may be sufficient to measure the distance to an external galaxy.
We thank Boris Gänsicke for discussion and early access to observational data. This work was supported by the National Science Foundation under grants PHY99-07949, and AST02-05956, and by NASA through grant AR-09517.01-A from STScI, which is operated by AURA, Inc., under NASA contract NAS5-26555. DMT is supported by the NSF Physics Frontier Centers’ Joint Institute for Nuclear Astrophysics under grant PHY 02-16783 and DOE under grant DE-FG 02-91ER 40606.
References
- Andronov et al. (2003) Andronov, N., Pinsonneault, M., & Sills, A. 2003, ApJ, 582, 358
- Araujo-Betancor et al. (2005) Araujo-Betancor, S., Gänsicke, B. T., Long, S. K., Beuermann, K., Sion, E. M., de Martino, D., & Szkody, P. 2005, ApJ, in press (astro-ph/0412180)
- Branch et al. (1995) Branch, D., Livio, M., Yungelson, L. R., Boffi, F. R., & Baron, E. 1995, PASP, 107, 1019
- D’Antona & Mazzitelli (1982) D’Antona, F. & Mazzitelli, I. 1982, ApJ, 260, 722
- della Valle & Livio (1995) della Valle, M. & Livio, M. 1995, ApJ, 452, 704
- Diaz & Bruch (1997) Diaz, M. P. & Bruch, A. 1997, A&A, 322, 807
- Downes (1986) Downes, R. A. 1986, ApJ, 307, 170
- Faulkner (1971) Faulkner, J. 1971, ApJ, 170, L99
- Fujimoto (1982) Fujimoto, M. Y. 1982, ApJ, 257, 767
- Gänsicke & Townsley (2005) Gänsicke, B. T. & Townsley, D. M. 2005, in preparation
- Gehrz et al. (1998) Gehrz, R. D., Truran, J. W., Williams, R. E., & Starrfield, S. 1998, PASP, 110, 3
- Hameury et al. (1988) Hameury, J. M., King, A. R., Lasota, J. P., & Ritter, H. 1988, MNRAS, 231, 535
- Heinke et al. (2005) Heinke, C. O. et al. 2005, ApJ, in press (astro-ph/05030132)
- Howell et al. (2001) Howell, S. B., Nelson, L. A., & Rappaport, S. 2001, ApJ, 550, 897
- Iben & Tutukov (1984) Iben, I. & Tutukov, A. V. 1984, ApJ, 284, 719
- Jordan (1997) Jordan, S. 1997, in ASSL Vol. 214: White dwarfs, ed. J. Isern, M. Hernanz, & E. García-Berro (Dordrecht: Klewer), 397
- Kolb (1993) Kolb, U. 1993, A&A, 271, 149
- Kolb & Baraffe (1999) Kolb, U. & Baraffe, I. 1999, MNRAS, 309, 1034
- Li et al. (1994) Li, J. K., Wu, K. W., & Wickramasinghe, D. T. 1994, MNRAS, 268, 61
- MacDonald (1984) MacDonald, J. 1984, ApJ, 283, 241
- Mannucci et al. (2004) Mannucci, F. et al. 2004, A&A, in press (astro-ph/0411450)
- McDermott & Taam (1989) McDermott, P. N. & Taam, R. E. 1989, ApJ, 342, 1019
- Nelson et al. (2004) Nelson, L. A., MacCannell, K. A., & Dubeau, E. 2004, ApJ, 602, 938
- Nomoto (1982) Nomoto, K. 1982, ApJ, 253, 798
- Olling & Merrifield (2001) Olling, R. P. & Merrifield, M. R. 2001, MNRAS, 326, 164
- Paczyński (1970) Paczyński, B. 1970, Acta Astronomica, 20, 47
- Paczynski & Sienkiewicz (1981) Paczynski, B. & Sienkiewicz, R. 1981, ApJ, 248, L27
- Paczynski & Sienkiewicz (1983) —. 1983, ApJ, 268, 825
- Piersanti et al. (2000) Piersanti, L., Cassisi, S., Iben, I. J., & Tornambé, A. 2000, ApJ, 535, 932
- Politano (1996) Politano, M. 1996, ApJ, 465, 338
- Prialnik & Kovetz (1995) Prialnik, D. & Kovetz, A. 1995, ApJ, 445, 789
- Pryor & Meylan (1993) Pryor, C. & Meylan, G. 1993, in Astronomical Society of the Pacific Conference Series, 357
- Rappaport et al. (1982) Rappaport, S., Joss, P. C., & Webbink, R. F. 1982, ApJ, 254, 616
- Rappaport et al. (1983) Rappaport, S., Verbunt, F., & Joss, P. C. 1983, ApJ, 275, 713
- Ringwald (1996) Ringwald, F. A. 1996, in ASSL Vol. 208: IAU Colloq. 158: Cataclysmic Variables and Related Objects, ed. A. Evans & J. H. Wood (Dordrecht: Kluwer), 89
- Ritter & Kolb (2003) Ritter, H. & Kolb, U. 2003, A&A, 404, 301, (update RKcat7.4)
- Ritter et al. (1991) Ritter, H., Politano, M., Livio, M., & Webbink, R. F. 1991, ApJ, 376, 177
- Shafter (1992) Shafter, A. W. 1992, ApJ, 394, 268
- Shafter & Irby (2001) Shafter, A. W. & Irby, B. K. 2001, ApJ, 563, 749
- Shara (1980) Shara, M. M. 1980, ApJ, 239, 581
- Shara (1989) —. 1989, PASP, 101, 5
- Shara et al. (2004) Shara, M. M., Zurek, D. R., Baltz, E. A., Lauer, T. R., & Silk, J. 2004, ApJ, 605, L117
- Spruit & Ritter (1983) Spruit, H. C. & Ritter, H. 1983, A&A, 124, 267
- Townsley & Bildsten (2003) Townsley, D. M. & Bildsten, L. 2003, ApJ, 596, L227
- Townsley & Bildsten (2004) —. 2004, ApJ, 600, 390, TB
- Truran & Livio (1986) Truran, J. W. & Livio, M. 1986, ApJ, 308, 721
- Verbunt (1997) Verbunt, F. 1997, MNRAS, 290, L55
- Verbunt & Zwaan (1981) Verbunt, F. & Zwaan, C. 1981, A&A, 100, L7
- Warner (1995) Warner, B. 1995, Cataclysmic Variable Stars (Cambridge: Cambridge Univ. Press)
- Warner (2002) Warner, B. 2002, in AIP Conf. Proc. 637: Classical Nova Explosions, 3–15
- Wickramasinghe & Ferrario (2000) Wickramasinghe, D. T. & Ferrario, L. 2000, PASP, 112, 873
- Williams & Shafter (2004) Williams, S. J. & Shafter, A. W. 2004, ApJ, 612, 867