Prospects for Detection of Catastrophic Collisions in Debris Disks
Abstract
We investigate the prospects for detecting dust from two body collisions during the late stages of planet formation at 1–150 AU. We develop an analytic model to describe the formation of a dusty cloud of debris and use numerical coagulation and -body calculations to predict observable signals from these events. In a minimum mass solar nebula, collisions of 100–1000 km objects at distances of 3–5 AU or less from the parent star are observable at mid-infrared wavelengths as bright clumps or rings of dust. At 24 m, the clumps are 0.1–1 mag brighter than emission from dust in the background debris disk. In edge-on systems, dusty clumps produce eclipses with depths of 1.0 mag that last for 100 orbital periods. Large-scale surveys for transits from exosolar planets, such as Kepler, can plausibly detect these eclipses and provide important constraints on the terrestrial environment for ages of 100–300 Myr.
1 INTRODUCTION
Throughout history, collisions have shaped the Earth. Repeated mergers of 10 km and larger objects produced the proto-Earth in 10–30 Myr (Wetherill & Stewart, 1993; Agnor, Canup, & Levison, 1999; Chambers, 2001; Yin et al., 2002). A few Myr later, a giant collision with a Mars-sized planet removed the first terrestrial atmosphere and led to the formation of the Moon (Hartmann & Davis, 1975; Cameron & Ward, 1976; Benz, Slattery, & Cameron, 1986; Canup, 2004a, b). During the Late Heavy Bombardment 4 Gyr ago, a sustained period of large collisions shaped the surfaces of all terrestrial objects (e.g., Tera, Papanastassiou, & Wasserburg, 1974; Hartmann, 1980; Neukum, 1983; Ryder, 2002; Koeberl, 2003). Giant collisions also produced structure in the Zodiacal dust band and perhaps mass extinctions on the Earth (e.g. Alvarez et al., 1980; Nesvorný et al., 2002b).
Understanding the formation and early evolution of our solar system requires unraveling this collisional history from current images, orbits, and samples of asteroids, meteorites, planets, and satellites. Although these data yield a remarkably detailed picture of the formation of the solar system, the record is incomplete, particularly at the earliest epochs (e.g., Swindle, 1993; Melosh, Vickery, & Tonks, 1993; Wadhwa & Russell, 2000). Some of the early collisional history is also erased by subsequent events, including volcanic activity and collisions (e.g., Wilhelms, 1987; Strom, Schaber, & Dawsow, 1994). The ambiguity of the early record leads to uncertainties in our understanding of the formation of chondrites (e.g., Itoh & Yurimoto, 2003; Wood, 2004; Connolly, 2005), the origin of the Late Heavy Bombardment (e.g. Cohen, Swindle, & Kring, 2000; Levison et al., 2001; Koeberl, 2003), and other aspects of the early history of the solar system.
Observations of debris disks surrounding other stars provide another way to study collisions during the evolution of a solar system. At least 40% of all A-type stars and 10% of all solar-type stars have far-infrared excesses from circumstellar dust (e.g., Backman & Paresce, 1993). Debris disks with masses of 0.01 in small, 1–100 m grains explain the scattered-light images and the spectral energy distributions of the best-studied systems (e.g., Backman & Paresce, 1993; Artymowicz, 1997; Greaves, 2005, and references therein). However, collisions and radiation forces remove small grains on timescales, 1 Myr, much shorter than the 10 Myr to 1 Gyr age of the parent star (Aumann et al., 1984; Backman & Paresce, 1993; Zuckerman, 2001; Thébault, Augereau, & Beust, 2003). If the mass in 1–10 km bodies is 10–100 , debris produced from high velocity collisions among these larger bodies can replenish the small grain population for 100 Myr or longer (Habing et al., 2001; Kenyon & Bromley, 2002; Dominik & Decin, 2003). Detailed numerical calculations suggest that the formation of debris disks coincides with the growth of 1000 km or larger planets throughout the disk on similar 10–100 Myr timescales (e.g. Kenyon & Bromley, 2004a, b). Thus, debris disks also provide a signpost for the formation of solar systems.
Recent theoretical work helps to link our understanding of the collisions in debris disks with the collisions that shaped our solar system. For debris disks around A-type stars, Dominik & Decin (2003) and Kenyon & Bromley (2002, 2004b) showed that the ratio of the disk luminosity to the stellar luminosity should follow a simple power-law relation, , where to and 100–300 Myr. Observations of infrared excesses in nearby stars follow a similar relation (e.g. Kalas, 1998; Rieke et al., 2005; Greaves et al., 2005). These results suggest an exponential decline in the collision rate, similar perhaps to the monotonic decline in the background accretion rate following the formation of the Moon111We distinguish a general monotonic decline in the impact rate 4–4.5 Gyr ago from the Late Heavy Bombardment, an apparent spike in the impact rate 600 Myr after the formation of the Earth and the Moon (see, for example, Hartmann, 1975, 1980; Ryder, 1988; Hartmann et al., 2000; Ryder, 2002; Koeberl, 2003, and references therein). (e.g., Ryder, 2002; Koeberl, 2003). Among others, Wyatt & Dent (2002) noted that large collisions are frequent enough to produce dusty clumps in debris disks, with long-term structure similar to the local Zodiac (Nesvorný et al., 2002b). In the terrestrial zone, Kenyon & Bromley (2004a) demonstrated that collisions between 50–100 km and larger objects can raise the debris disk luminosity above the simple power-law relation, suggesting that moderate and giant impacts are observable for short periods of time (see also Stern, 1994; Grogan et al., 2001; Nesvorný et al., 2002a; Zhang & Sigurdsson, 2003).
Here, we continue to develop the idea that giant collisions produce observable structures in debris disks. We derive an analytic model to identify collisions that produce observable clumps of dust and we use numerical calculations to explore the conditions where large collisions are visible. In a minimum mass solar nebula, collisions of 100–1000 km objects at distances of 3–5 AU or less from the parent star are observable as bright clumps or rings of dust. In disks observed close to edge-on, the optical depth is often large enough to produce eclipses of the parent star. These eclipses last for several days and recur over 10–100 orbital periods. We use detailed -body simulations to illustrate the evolution of these eclipses and to make estimates for the frequency of these events. Current and planned surveys for planetary transits can detect these eclipses and test our predictions.
We develop the analytic model in §2, describe numerical simulations of an ensemble of colliding planetesimals in §3, and derive the time evolution of single catastrophic collisions in §4. We conclude with a brief discussion and summary in §5.
2 ANALYTIC MODEL
2.1 Derivation
We begin with an analytic model for the formation of a clump of dusty debris from two colliding planetesimals. Each planetesimal has mass density . The larger planetesimal is the ‘target’ and has mass , radius , and orbital eccentricity and inclination . The smaller ‘projectile’ has mass , radius , eccentricity , and inclination . The planetesimals lie in a disk with surface density , where is the distance from a star with mass and luminosity .
We assume that the collision produces a spherical cloud of debris with radius and mass . The debris consists of particles with sizes ranging from 1 m to 1 m or larger. We follow previous investigators and derive the debris mass from the ratio of the impact energy to the disruption energy ,
| (1) |
where is a constant of order unity (see Davis et al., 1985; Wetherill & Stewart, 1993; Kenyon & Luu, 1998; Benz & Asphaug, 1999, and references therein). If is the relative velocity of the two planetesimals and is the escape velocity of a single body with mass, , the center-of-mass collision energy is (Wetherill & Stewart, 1993)
| (2) |
where the impact velocity . The energy needed to remove half of the combined mass of two colliding planetesimals is
| (3) |
where is the bulk (tensile) component of the binding energy and is the gravity component of the binding energy (see, for example, Davis et al., 1985; Wetherill & Stewart, 1993; Holsapple, 1994; Benz & Asphaug, 1999; Housen & Holsapple, 1999).
To derive the amount of stellar radiation intercepted by the debris cloud, we define the radial optical depth through the cloud as
| (4) |
where is the number of particles with radius within the debris cloud. The radiation intercepted by the debris is roughly . As orbital shear broadens the debris cloud into a ring, drops but remains roughly constant. If and , is a function of , , and and does not depend on the initial radius of the debris cloud .
The collision rate places strict limits on . For the late stages of planet formation, the timescale for a collision between an object and smaller bodies in the disk is (Lissauer, 1987; Wetherill & Stewart, 1993)
| (5) |
where is the orbital period. If we integrate the expressions for and over , adopt = 1–3 g cm-3, and set the surface density of small particles in the background debris disk to with 0.1 g cm-2 at 1 AU, we can rearrange equation (5) as
| (6) |
In each orbit, particles with have many collisions with material in the background debris disk. Because the background has a wide range of sizes, 1–10 m to 1 km, objects in the debris cloud rapidly reach an equilibrium size distribution with 3.5 (Dohnanyi, 1969; Durda & Dermott, 2002; Williams & Wetherill, 1994). For an observable debris cloud with , particles with 10–20 km reach this limit at = 1 AU. Although larger particles may have a steeper size distribution (Campo Bagatin & Petit, 2001; Michel et al, 2001, 2002), these contribute little to the optical depth. Thus, we assume for all particles in the debris.
With known, the optical depth and luminosity are
| (7) |
where is a typical radius of a particle, and
| (8) |
The reprocessed luminosity is independent of the geometry of the debris cloud and depends only on the location of the collision and the mass distribution of the particles in the debris. For , this expression constrains the total debris mass:
| (9) |
Thus, an observable debris cloud requires the complete disruption of (i) two 100 km objects at 1 AU, (ii) two 300 km objects at 10 AU, or (iii) two 1000 km objects at 100 AU. From equation (5) these debris clouds form every yr at 1 AU and every yr at 30 AU.
The timescale for orbital shear to broaden the debris cloud into a ring and mix with the background disk is . After the collision, the debris has a velocity dispersion222The range in the velocity dispersion is a factor of 2–3. After the collision, dynamical interactions with other objects and radiative processes such as the Yarkovsky effect can modify the velocity dispersion (e.g., Michel et al, 2002, 2004). (e.g. Michel et al, 2001, 2002), which implies an approximate size . Gravity sets a lower limit to the extent of the debris cloud. Debris cannot remain bound to the largest objects beyond the mutual Hill radius, for 100–300 km projectiles. The disk scale height, 0.01-0.1 provides a rough upper limit to the width of the debris cloud. These estimates suggest that the cloud remains distinct for at least orbital periods.
Our approach ignores the increase in thermal energy during a collision. From detailed numerical calculations (e.g., Canup, 2004b), large impacts produce considerable increases in the temperature of the colliding bodies. The results suggest that the temperature of two large bodies rises to 5000 K to 10,000 K during the impact (see also Stern, 1994). At these temperatures, the timescale to radiate the impact energy is short, days, compared to the lifetime of the debris cloud, years. If the increase in thermal energy is large compared to the impact energy, our analysis overestimates the amount of debris and therefore yields upper limits to the debris cloud luminosity.
2.2 Application
To apply the analytic model to debris disks, we use parameters appropriate for the late stages of planet formation. We adopt a minimum mass solar nebula model for the surface density, , where = 1 AU and = 15 g cm-2 (Weidenschilling, 1977; Hayashi, 1981). For this section, we ignore the change in surface density at the ‘snow line,’ where the surface density increases due to ice condensation. This approximation decreases our collision rates by a factor of two, but has no impact on the luminosity or optical depth of a debris cloud.
The size distribution of projectiles and targets is (Kenyon & Bromley, 2004c)
| (10) |
Numerical simulations of planet formation suggest 1–100 km, with 4 for large objects and 3.5 for small objects (e.g. Stern & Colwell, 1997; Kenyon & Bromley, 2004a). We use 10-100 km and 0.1-1 km (Kenyon & Bromley, 2004c). For the orbital parameters, we use = 3 , = 0.2, and i/e = 0.5.
We assume standard values for the bulk parameters of large objects. In our model, rocky objects have = 3.0 g cm-3, = erg g-1, = 0.37, = 0.4 erg cm-3, and = 1.36; icy objects have = 1.5 cm-3, = erg g-1, = 0.0, = 1.4 erg cm-3, and = 1.25. For this paper, we ignore a weak relation between the disruption energy and the impact velocity (Housen & Holsapple, 1990, 1999; Benz & Asphaug, 1999).
To explore the sensitivity of our results to the bulk properties, we consider two alternatives. For rocky objects, our simple approximation to the empirical derived from the size distribution of asteroids in the solar system (Durda, Greenberg, & Jedicke, 1998) is = erg g-1, = 0.0, = erg cm-3, and = 2.4. As an approximation for icy rubble piles, we also consider = 1 erg g-1, = 0.0, = erg cm-3, and = 1.25 (e.g., Leinhardt & Richardson, 2000, 2002).
To calculate the properties of debris clouds, we use the orbital parameters and bulk properties to derive from equations (1)–(3). For and = 3.5, = ). With , equation (4) yields a lower limit for the optical depth. The cloud luminosity is then . Although depends on , the luminosity is independent of cloud geometry.
Clouds viewed in the orbital plane of the disk can eclipse the central star. The visual extinction through the cloud is . The maximum eclipse depth is
| (11) |
where is the radius of the central star. At 1 AU, a debris cloud with in orbit around a 1–3 star produces eclipses with 0.1-1.0 .
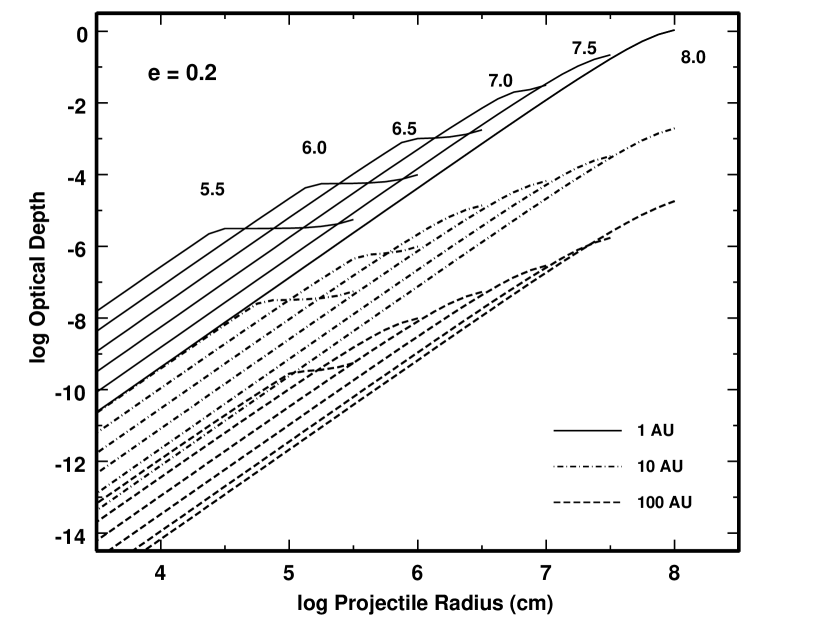
Figure 1 shows derived luminosities for debris clouds at 1 AU (rocky objects, solid lines), 10 AU (rocky objects, dot-dashed lines), and 100 AU (icy objects, dashed lines). Larger projectiles produce more luminous debris clouds. In some cases, the largest projectiles completely shatter the target, leading to a saturation in debris production. Complete disruption leads to a maximum in the relative luminosity for a given target, illustrated by the plateaus in the Figure. This maximum luminosity is roughly
| (12) |
The luminosity of a debris cloud is sensitive to the distance from the parent star. Our results suggest a roughly 7 order of magnitude decline in from 1 AU to 100 AU. This large change is a result of the changing angular scale and amount of debris with semimajor axis. For a cloud of fixed mass, the angular size of an opaque cloud as viewed from the central star varies as . For a fixed eccentricity, the impact kinetic energy scales as ; thus, the debris mass produced from a collision of two bodies varies as . Because collisions at larger stellar distance produce less debris, the mass of the largest remnant increases roughly with . Taken together, these simple scaling laws suggest . Complete disruption becomes more important close to the central star, reducing the scaling to
The luminosity of the debris is also sensitive to the bulk properties of the colliding bodies (Figure 2). For collisions between the largest objects at 1–10 AU, the relation derived from asteroids in our solar system yields a factor of ten smaller luminosity as the ‘standard’ relation for basalts from Benz & Asphaug (1999). The debris luminosity from smaller collisions is unchanged from the standard relation. For the Durda, Greenberg, & Jedicke (1998) relation, small changes, 0.1, in yield factor of 3 variations in the debris luminosity. At 100 AU, the relation for rubble piles results in much more luminous debris clouds for collisions between 100–1000 km objects. However, the luminosity is still small, , compared to typical luminosities, to , of known debris disks.
Close to the central star, debris clouds can produce modest eclipses (Figure 3). At 1 AU, collisions between 300 km and larger objects have 0.01–0.1 mag. Although smaller collisions produce observable debris clouds in scattered or thermal emission, they produce tiny eclipses with mag. Beyond 3 AU, eclipses from all debris clouds are unobservable with current techniques.
Our estimates of the collision times indicate that individual collisions between large objects are observable (see also Stern, 1994; Grogan et al., 2001; Zhang & Sigurdsson, 2003). At 1 AU, the collision rates range from 1–10 Myr-1 for collisions between two 1000 km objects to 10-2 yr-1 for 100 km + 100 km collisions. Smaller collisions occur more frequently but do not produce significant eclipses or debris luminosity. At 10–100 AU, observable collisions between 300 km and larger objects occur every 10 Myr to 1 Gyr. Because the debris cloud merges with the disk on to yr timescales, the chances of observing these debris clouds are small.
2.3 Uncertainties
The main uncertainties in our estimates are collision physics and the behavior of the debris cloud following the collision (e.g., Durda et al., 2004). Because collisions between small objects are frequent, the size distribution of small bodies probably is a small uncertainty. For optically thin clouds, the cloud geometry sets the optical depth of the cloud but not the luminosity.
For rocky objects, the collision parameters have been well-studied with numerical simulations (e.g., Benz & Asphaug, 1999; Michel et al, 2001; Canup, 2004a) and observations of the debris of large collisions among asteroids (e.g., Durda, Greenberg, & Jedicke, 1998). The two approaches yield similar optical depths and cloud luminosities for 100 km, but differ by a factor of 10 for objects with 1000 km. Because the number of large asteroids with 500 km is small, the uncertainty in the observational estimates are large (Durda, Greenberg, & Jedicke, 1998). Observations of sufficient numbers of collisions in debris disks may reduce the uncertainty (see below).
For icy objects, the uncertainties in the bulk properties are much larger. Numerical simulations yield erg g-1 for crystalline ice or snow (Benz & Asphaug, 1999); simulations of rubble piles suggest 10 erg g-1 (Leinhardt & Richardson, 2002). The rubble pile results agree with analyses of simulations of the break up of comets, such as Shoemaker-Levy 9 (e.g., Asphaug & Benz, 1996) and C/2000 C6 (Uzzo et al., 2001). The apparent break in the size distribution of Kuiper belt objects in the outer solar system (Bernstein et al., 2004) also favors erg g-1 (Pan & Sari, 2005; Kenyon & Bromley, 2004c).
The size distribution of Kuiper belt objects also favors a small exponent for the gravity component of the disruption energy, 1.2–1.3 instead of the 2 expected from simple theory (Kenyon & Bromley, 2004c). However, current observations cannot distinguish between the two relations used in Figures 1–3. Improved constraints from the size distribution of Kuiper belt objects may yield tests of these relations (Bernstein et al., 2004).
The evolution of the debris cloud following the collision is an important uncertainty in our estimates. For a cloud with a radial extent , the number of secondary collisions with material in the background debris disk ranges from less than one per orbit for the largest remnant of the collision to a hundred or more collisions per orbit for debris particles with radii of 1 km or smaller. Because the debris cloud expands azimuthally at a rate roughly comparable to the collision rate, the optical depth through the cloud probably cannot increase with time. However, the mass and luminosity may increase. Depending on the surface density in the disk, we estimate that secondary collisions can increase the luminosity of the debris cloud by a factor of 2–10. This uncertainty has little impact on our main results. If the debris cloud luminosity is a factor of 10 larger than our analytic estimates, individual collisions between objects with radii of 100 km or smaller are not detectable at 1 AU. At 10–100 AU, individual collisions between objects with radii of 1000 km and smaller remain invisible.
3 Coagulation Calculations
3.1 Methods
To explore the visibility of individual collisions in more detail, we consider numerical calculations of the evolution of particle disks around 1–3 stars. Our calculations for the terrestrial zone around solar-type stars show that individual collisions between 100 km and larger objects are visible as short-lived increases in the disk luminosity (Kenyon & Bromley, 2004b, see also Grogan et al. 2001). Beyond 30 AU, individual collisions are not visible as discrete events in our calculations (Kenyon & Bromley, 2004a). Here, we consider a broader suite of calculations designed to test the visibility of individual collisions at 1–100 AU.
To evolve a particle disk in time, we follow the Safronov (1969) statistical approach to calculate the collisional evolution of an ensemble of planetesimals in orbit around a star of mass and luminosity (Kenyon & Bromley, 2004c, and references therein). The model grid contains concentric annuli with widths centered at heliocentric distances . Calculations begin with a differential mass distribution ) of bodies with orbital eccentricity and inclination .
To evolve the mass and velocity distributions in time, we solve the coagulation and Fokker-Planck equations for bodies undergoing inelastic collisions, drag forces, and long-range gravitational interactions (Kenyon & Bromley, 2002). We adopt collision rates from kinetic theory – the particle-in-a-box method – and use an energy-scaling algorithm to assign collision outcomes (Kenyon & Bromley, 2004c). We derive changes in orbital parameters from gas drag, dynamical friction, and viscous stirring (Adachi et al., 1976; Ohtsuki, Stewart, & Ida, 2002). Dynamical friction transfers kinetic energy from large bodies to small bodies and drives a system to energy equipartition. Viscous stirring transfers angular momentum between bodies and increases the velocities of all planetesimals.
To compute dust masses and luminosities, we use the dust production rates and particle scale heights derived from the coagulation code as input to a dust evolution code (Kenyon & Bromley, 2004a). This calculation includes collisions between dust grains and Poynting-Robertson drag. We use a simple radiative transfer method to derive the optical depth through the disk; dust luminosities follow from the scale height derived from the coagulation code.
Our numerical calculations begin with 1–1000 m planetesimals in 32–64 concentric annuli with initial surface density (a/1 AU)-3/2 (see, for example, Kenyon & Luu, 1999; Kenyon & Bromley, 2004a, b). Table 1 lists and , the inner and outer radii of the computational grid, , the mass density of a planetesimal, , and , the timescale for exponential gas removal (Kenyon & Luu, 1999). We divide the initial continuous mass distribution of planetesimals into a differential mass distribution with discrete mass batches. The spacing between successive mass batches is . We add mass batches as planetesimals grow in mass. Each planetesimal batch begins in a nearly circular orbit with eccentricity and inclination . For these calculations, = 1.4–2 and –.
In the next two sections, we consider the evolution of icy and rocky planetesimals in orbit around solar-type and A-type stars. Because our calculations do not include gas accretion, we avoid the region of the gas giant planets and restrict our attention to the terrestrial zone and the region of the Kuiper belt around solar-type stars. For A-type stars, we consider two representative regions at 3–20 AU and at 30–150 AU. Although gas giants may form around A-type stars, our calculations provide reasonable estimates for the formation of the rocky or icy cores of gas giants. As a planetary core accretes gas from the disk, it will continue to stir up the leftover planetesimals and remove the debris more rapidly than estimated in our calculations. Thus our estimates for the lifetimes and dust luminosity of debris disks are probably reasonable upper limits for these systems.
3.2 Solar-type stars: results at 0.4–2 AU and 30–150 AU
At 1 AU, the growth of planetesimals into planets follows a standard pattern (Wetherill & Stewart, 1993; Weidenschilling et al., 1997). All bodies begin with small orbital eccentricities. Gas drag maintains small for the smallest bodies; dynamical friction maintains small for the largest bodies. Thus, collisions produce larger bodies instead of smaller fragments. After yr, 1000 km and larger bodies form and stir up the orbits of planetesimals with radii of 0.1–10 km. Collisions between the leftover planetesimals then produce smaller fragments. The largest bodies sweep up some of the fragments, but most of the fragments collide with other fragments to produce still smaller fragments. Because the largest bodies are nearly immune to fragmentation, this collisional cascade concentrates most of the initial mass in the largest and the smallest bodies.
During the earliest stages of our calculations, the collisional cascade produces an observable amount of dust (Figure 4). After yr, the dust produces an order of magnitude more radiation at mid-infrared (mid-IR) wavelengths than the central solar-type star. Continued dust production maintains a roughly constant mid-IR excess for yr. Because the large bodies are slowly depleted, the dust production rate then slows and the mid-IR excess declines. In these calculations, the mid-IR excess becomes comparable to the stellar radiation after a few yr.
In addition to the slow evolution of the ‘background’ mid-IR excess, individual collisions produce large spikes in the dust luminosity (Figure 4). During the early stages of the evolution, collisions between large objects tend to produce even larger objects and are also too frequent for any single, disruptive collision to modify the mid-IR excess significantly. As the average dust production rate declines, individual collisions between large objects are less frequent but produce more dust. Thus, after yr, spikes from large collisions dominate the evolution of the mid-IR luminosity.
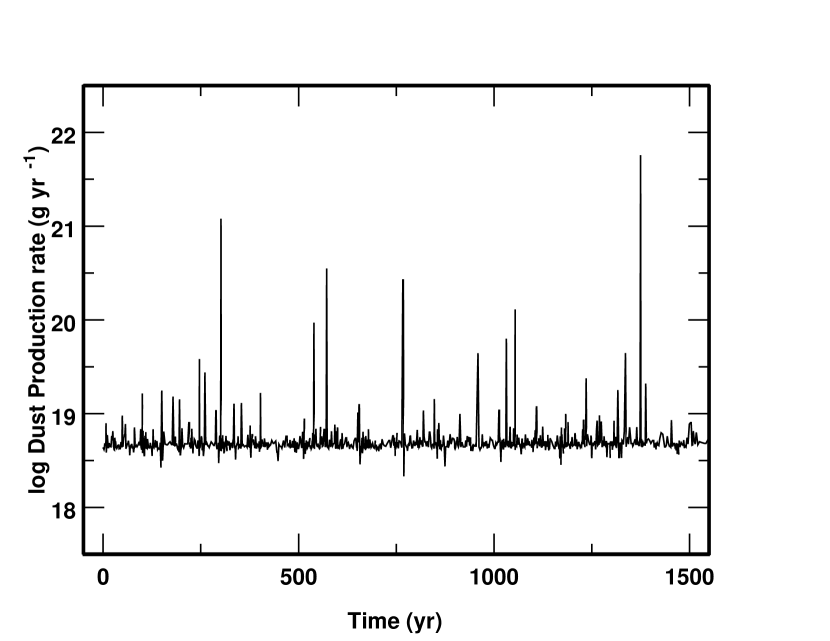
To learn more about the nature of these spikes, we consider the dust production rate as a function of time (Figure 5). At this point in the evolution ( yr), numerous collisions between small objects set the background dust production rate. Because we use a random number generator to assign collision outcomes (Wetherill & Stewart, 1993; Kenyon & Luu, 1998), an occasional lack of collisions leads to a smaller than average dust production rate. In addition, occasional collisions between larger objects produce distinct spikes in the dust production rate. The frequency distribution of the spikes in the dust production rate tracks the size distribution of large bodies; small spikes are much more frequent than large spikes. The smaller spikes, where the dust production rate is a few times the background rate, produce little change in the mid-IR excess. Larger spikes – produced by collisions between 100 km or larger objects – yield fluctuations in the mid-IR excess ranging from a few percent to more than 100%. The largest fluctuations in Figure 5 produce the largest spikes in the evolution of the mid-IR excess shown in Figure 4.
At 30 AU, the evolution follows a different path. Because the orbital periods are longer and the surface density smaller, planets take much longer to form at 30 AU than at 1 AU. Large bodies begin to form at 10 Myr and soon contain a few percent of the initial mass. These objects stir up leftover planetesimals along their orbits and begin the collisional cascade. In these models, large bodies grow more slowly, and the leftovers are more easily shattered. Collisions then efficiently convert most of the initial mass into smaller objects which are removed by radiation pressure and Poynting-Robertson drag. Thus, the final ensemble of large bodies contains less than 5%, and sometimes less than 1%, of the initial mass in solid objects.
The evolution of the IR excess is also different at 30 AU than at 1 AU (Figure 6). Because the dust is farther away from the central star, the dust is cooler, 30–40 K instead of 300–400 K. At the start of our calculations, this dust produces a significant IR excess, which slowly declines as small bodies merge into larger bodies. Once the collisional cascade begins at 10 Myr, the far-IR excess rises significantly. At shorter wavelengths, the dust produces a small excess. As in calculations at 1 AU, the cascade maintains a roughly constant excess until planet formation reaches the outer edge of the disk at 100–150 AU. Poynting-Robertson drag and radiation pressure then remove small grains faster than collisions can replenish them. The IR excess then rapidly declines. However, individual collisions never contribute a significant amount to the IR excess. In our calculations, the evolution of the IR excess is smooth, with 1%–2% fluctuations about the general trend.
In our calculations at 30 AU, there are several reasons for the lack of significant spikes in the IR excess. Because the collisional cascade is efficient at removing 1–10 km bodies from the evolution, few of these objects grow into 100 km and larger objects. Collisions between individual objects also do not produce an observable amount of dust (Figs. 1–2). To test the relative importance of these processes, we calculated several models with more robust planetesimals, where the collisional cascade leaves more material in larger bodies. These calculations suggest that individual collisions never produce observable amounts of dust.
Our suite of calculations confirms the basic conclusions of our analytic model. At 30 AU, binary collisions never produce an observable IR excess. Although the dust in our calculations produces a large far-IR excess, the evolution of the excess is very smooth. At 1 AU, occasional collisions between large objects produce observable changes in the mid-IR excess. Small, few percent, changes in the mid-IR excess should recur on timescales of tens to hundreds of years. Large changes are much less frequent and recur on thousand year or longer timescales.
3.3 A-type stars: results at 3–20 AU and 30–150 AU
Calculations for planet formation around A-type stars follow the same pattern as for solar-type stars. During the early stages, runaway growth leads to the formation of protoplanets with radii of 1000 km and larger. At 3 AU, it takes about yr for 1000–2000 km objects to form. Due to the large gradient in surface density, the growth of large bodies slowly propagates to larger distances (Lissauer, 1987). The timescale for the formation of 1000 km objects is yr at 9 AU and yr at 18–20 AU.
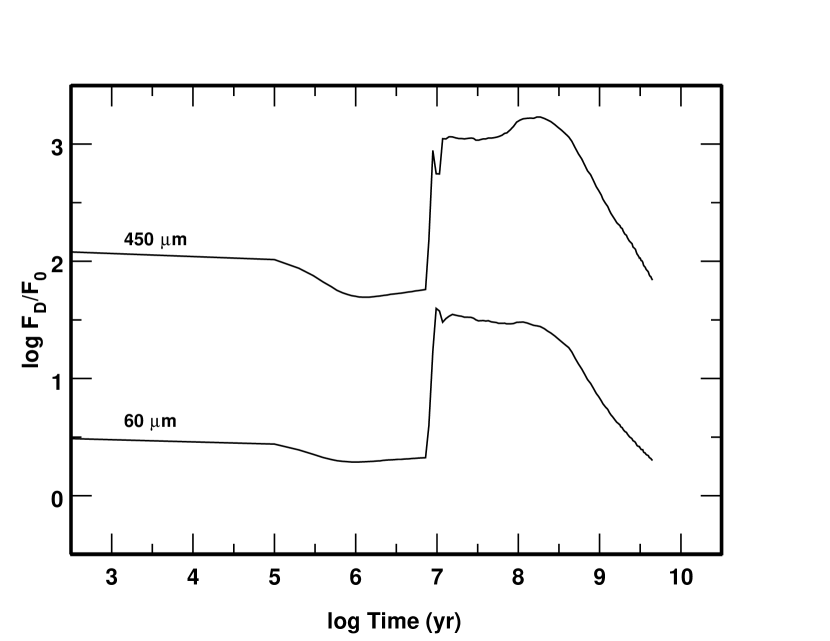
Once large planets form, their gravity stirs up the leftover planetesimals along their orbits. Collisions then produce fragments instead of mergers, and the collisional cascade begins. In simulations at 3–20 AU, the dust luminosity starts to rise at yr and peaks at yr (Figure 7). As planet formation moves from 10 AU to 20 AU, the dust produced in the collisional cascade has smaller optical depth and subtends a smaller solid angle as seen from the central star. Thus, the dust luminosity declines. Once planet formation reaches the outer edge of the 20 AU disk, Poynting-Robertson drag removes dust more rapidly than collisions can replenish it. The dust luminosity then declines more rapidly and falls to very small levels in yr.
In calculations at 30–150 AU (Kenyon & Bromley, 2004a), planet formation leads to dust production on much longer timescales. In these models, large planets begin to form at the inner edge of the disk at 10–20 Myr. After 1 Gyr, planet formation reaches the outer edge of the disk. Throughout this period, the collisional cascade maintains a large reservoir of small dust grains, which produce a measurable dust luminosity (Figure 7). From 10 Myr to 1 Gyr, the dust luminosity smoothly declines from to . After 1 Gyr, Poynting-Robertson drag rapidly removes dust and the dust luminosity declines more rapidly.
Figure 8 shows the evolution of the 25 m excess for a planetesimal disk around an A-type star with mass = 3 , luminosity = 50 , and temperature = 9500 K. In both cases, the excess first declines with time as small bodies merge into larger and larger bodies. Once the collisional cascade begins, the 24 m excess rises. Small fluctuations from individual collisions mark the rise of the excess at 3 AU. At 30 AU, the rise is smooth. At the peak of both calculations, small fluctuations in the excess are apparent. At 3 AU, individual collisions produce the small fluctuations. At 30 AU, the occasional merger of large objects produces more stirring and a temporary increase in the dust production rate.
These results also confirm the basic predictions of the analytic collision model. In planetesimal disks surrounding A-type stars, binary collisions at 3–5 AU produce modest, 10%, fluctuations in the mid-IR excess. Farther out in the disk, binary collisions do not produce enough dust to change the amount of mid-IR excess. However, mergers of larger objects can produce modest fluctuations in the mid-IR excess by increasing the local stirring rate, which leads to more dust and a larger mid-IR excess.
4 N-BODY CALCULATIONS
When binary collisions occur, our model predicts two observable changes in the luminosity. After a collision produces a debris cloud, we expect a rapid rise in infrared brightness. As orbital shear spreads the debris cloud into a ring, secondary collisions with material in the rest of the disk remove smaller particles. The mid-infrared flux then declines. In our picture, this decline occurs on the timescale for the cloud to spread into a ring, orbital periods.
For edge-on systems, we expect the debris cloud to eclipse the central star. The predicted eclipse depth ranges from 0.5 mag for large collisions to less than 0.01 mag for smaller collisions. As the debris cloud spreads into a ring, the eclipses should last longer and become shallower. This behavior distinguishes a debris cloud from the transit of an exosolar planet, where the eclipse depth and duration are constant (see, for example, Alonso et al., 2004, and references therein).
To illustrate the appearance of eclipses from a debris cloud, we use -body simulations to follow the evolution of debris following a major two body collision. For these examples, we consider collisions between equal mass bodies with radius 300 km and 1000 km.
To begin the evolution, we place 10,000 “dust” particles in a small volume of radius around a guiding center on a circular orbit around a star of mass = 1 . We give each dust particle a relative velocity . In one configuration, the positions and velocities have Gaussian random distributions (generating a “random blob”). In another configuration, the particle density declines as out to radius , with velocities proportional to the distance from the guiding center (yielding a homologous “explosion”). These two configurations represent two reasonable choices for the initial velocity distribution (e.g., Michel et al, 2001).
Each -body particle represents a population of dust with mass distributed according to equation (10), with . The minimum size of the dust particles is 1 m. We set the maximum size in one of two ways. In the first case, we assume that all of the mass in the collision goes into “dust particles” with a single-index power law size distribution and a single large remnant containing 10%–15% of the mass. In the second model we suppose that 20% of the mass ends up in a single large object, with the remaining 80% in dust with a maximum radius of 10 km. Although these choices do not exhaust the possible mass configurations following a completely disruptive collision, they provide a good illustration of the range of eclipse depths and evolution with time.
To derive the properties of the eclipses, we calculate the position of the particles on Keplerian orbits evaluated with an -order ODE solver. We divide the surface of a star with radius 1 into elements and project the particle positions onto the stellar disk. For each path from the observer through the particles to the stellar disk, we compute the optical depth (t) and the emergent intensity , where the unobscured intensity from the star is . This procedure assumes that the mass distribution for all particles is identical. We then derive a light curve from -2.5 log .
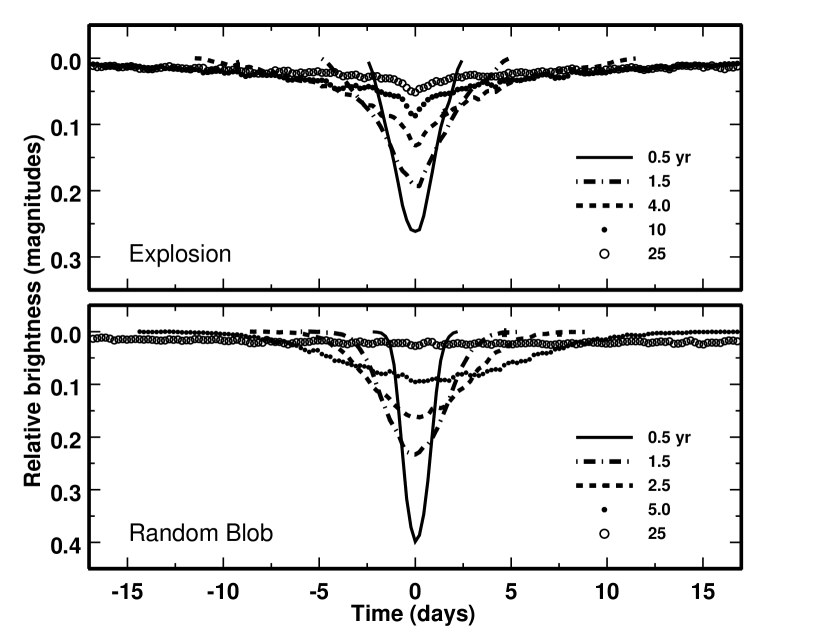
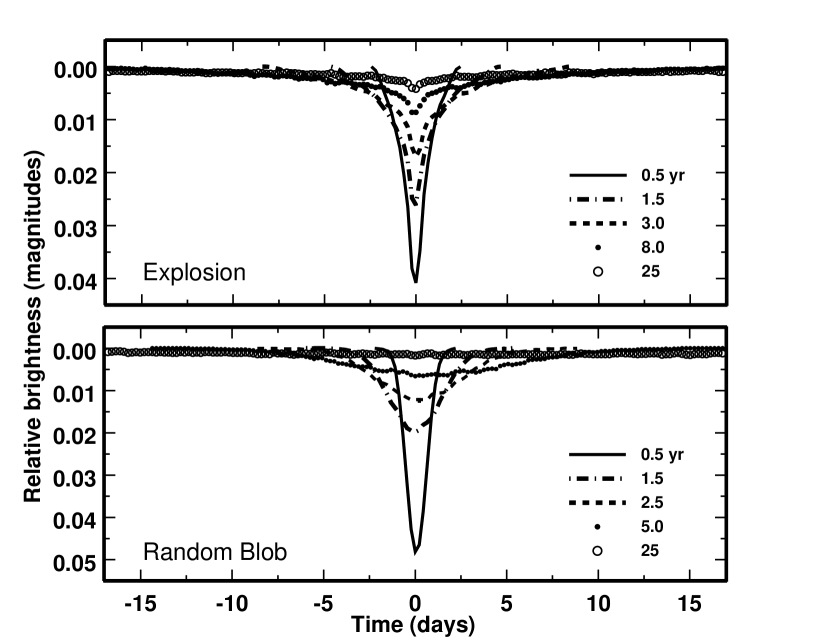
Figure 9 illustrates light curves for the collision of two 1000 km objects. The lower (upper) panel shows results for a random blob (explosion) when a large remnant contains 20% of the initial mass. In both simulations, the eclipse depth is 0.5–0.7 mag 6 months after the collision. Each eclipse lasts 5–10 days, 2% to 4% of the orbital period. After 10–20 orbits, the eclipses are 10% of their original depth and last 10 times longer than eclipses immediately after the collision. After 100 orbits, dust from both the blob and the explosion lies in a roughly uniform ring around the star. Although tiny eclipses remain visible, most of the dust produces a uniform extinction of 2% to 3% of the stellar flux.
In these simulations, dust from the random blob expands more rapidly and merges into the background debris disk faster than dust from the explosion. This behavior is a feature of the initial conditions. In the homologous explosion, the dust particles are less concentrated to the center, which produces shallower eclipses relative to the random blob. However, particles close to the center of the explosion expand more slowly than those in the blob. Thus, these particles remain closer to the point of the collision and continue to produce narrow, shallow eclipses when most of the rest of the blob has expanded into a ring.
Figure 10 repeats Figure 9 for the collision of two 300 km bodies. Because these collisions produce less dust, the eclipses have roughly the same duration but are shallower. As for the collision of 1000 km bodies, the eclipses slowly fade away and last a longer and longer fraction of the orbital period. After 30–100 orbits, orbital shear transforms the debris cloud into a ring, which obscures 1% to 2% of the stellar surface.
Figure 11 compares results for configurations where we place all of the debris in “dust” particles with radii of 10 km or smaller. The lower (upper) panel shows light curves for the collision of two 1000 km (300 km) bodies. Compared to configurations where 20% of the initial mass in contained in a single large object (Figures 9–10), the optical depth in the debris cloud is larger and eclipses are much deeper. The timescale for the cloud to expand into a ring is identical to the timescale derived for the other cases. Thus, the magnitude of the eclipses declines over 30–100 orbital periods.
These calculations illustrate the simplest evolution of a debris cloud formed in a large binary collision. Calculations with more complex initial configurations produce a remarkable variety of eclipse light curves. Shepherd moons or planets can confine the debris cloud and thus can slow the decline of the eclipse depth with time. Planets in orbits inclined to the orbital plane of the debris cloud lead to a precessing cloud or ring with very different eclipse morphology. Winn et al. (2004) and Chiang & Murray-Clay (2004) show how the eclipse morphology changes when an opaque cloud or ring orbits an eccentric binary star and apply their results to the young variable star KH 15D (Hamilton et al., 2001). We derive similar results when a debris cloud spreads into a ring. Because the range of possible geometries is large, the discovery of additional eclipsing systems with rings or blobs of dust will guide future numerical calculations.
5 DISCUSSION AND SUMMARY
During the late stages of planet formation, binary collisions between leftover, large planetesimals in orbit around solar-type stars are potentially observable. At 1 AU, these collisions produce large spikes, 1 mag or less, in the mid-infrared luminosity (Figure 4). In systems viewed edge-on, the debris cloud eclipses the parent star (Figures 9–11). Maximum eclipse depths range from 0.5 mag for collisions between 1000 km objects to 0.01 mag or less for collisions between 100–300 km objects. Typical eclipses last 5–10 days. As the debris cloud expands into a ring, the eclipses fade and grow longer. The lifetime of the debris cloud as a distinct entity is orbital periods.
At large distances from the parent star, 3 AU, binary collisions are more difficult to detect. Because collisions are less frequent and produce less dust, they are harder to detect against the emission from the background debris disk. Our results indicate that the maximum luminosity from individual collisions declines as (equation 12). Wyatt & Dent (2002) derive similar conclusions from different approaches.
To estimate the likelihood of detecting binary collisions, we consider Kepler333http:www.kepler.arc.nasa.gov, a satellite designed to detect the transits of exosolar planets across their parent star. During a 4 yr mission, the Kepler team plans to acquire very high precision photometry for stars. Roughly 0.5% of these stars have favorable orbital inclinations to detect transits from terrestrial planets. For the planned observing frequency of once every few hours and an expected precision of 0.01% or better, the expected detection rate is 50–100 terrestrial planets per stars.
To modify this estimate for the detection of debris clouds, we use the results from our coagulation and -body calculations. Because the scale height of the debris disk is larger than the radius of a terrestrial planet, 2% to 3% of potential solar systems have orientations that produce eclipses. If the lifetime of the collision phase is a few hundred Myr, 10% of Kepler targets are young enough to observe collisions. Thus, eclipses from debris clouds are possible in a few hundred stars of the Kepler sample.
To estimate the probability of detecting binary collisions in these stars, we adopt the collision rates from the coagulation calculations and the lifetimes derived from the -body results. For the anticipated precision of Kepler, binary collisions between 100 km objects yield a detectable eclipse. With a collision rate of yr-1 for these objects, the probability of a collision during the Kepler lifetime is roughly 100%. In a 4 yr mission, the eclipse depth can change by a factor of two or more. The duration of each eclipse lengthens to maintain a roughly constant total optical depth, integrated over the complete eclipse.
The prospect for observing collisions between the largest objects is poorer but still significant. The rate for collisions between two 1000 km objects is yr-1. This rate yields a 1% probability for detecting one large collision during the Kepler mission. However, with a typical lifetime of 30–100 yr, the probability of observing eclipses after a large collision is 10 times larger than observing a collision during the mission. Thus, it is possible that Kepler will detect eclipses from the aftermath of one large collision between two 1000 km objects. These eclipses should lengthen and decrease in depth throughout the 4 yr Kepler mission.
Ground-based surveys could also detect collisions in the terrestrial zone. The OGLE and TRES projects have identified several transiting exosolar planets (Alonso et al., 2004; Konacki et al., 2003; Pont et al., 2004). The PASS project envisions a complete survey of planetary transits for all stars with V 5.5–10.5 (Deeg et al., 2004). As part of a much deeper all-sky survey, Pan-STARRS444http://pan-starrs.ifa.hawaii.edu/public/index.html might also detect eclipses from debris clouds. To detect the unique signal from a large two body collision, these projects need to distinguish real events with diminishing depth and lengthening duration from spurious signals and from repetitive eclipses with constant depth and duration.
Successful detections of the dust produced in large two body collisions can teach us about terrestrial planet formation. Characterizing the frequency of events associated with stars of different ages and spectral types yields estimates for the space density of large bodies as a function of stellar mass and age. Simultaneous optical, infrared, and submm observations provide measures of the dust albedo and size distribution. Coupled with direct detection of exosolar terrestrial planets, measurements of the properties of the terrestrial environment allow a better understanding of the formation of the Earth-Moon system and, ultimately, the formation of the current environment on the Earth and other terrestrial planets.
We acknowledge a generous allotment, 1000 cpu days, of computer time on the Silicon Graphics Origin-2000 ‘Alhena’ at the Jet Propulsion Laboratory through funding from the NASA Offices of Mission to Planet Earth, Aeronautics, and Space Science. T. Currie, M. Geller, J. Winn, and an anonymous referee provided helpful comments on the manuscript. The NASA Astrophysics Theory Program supported part of this project through grant NAG5-13278.
References
- Adachi et al. (1976) Adachi, I., Hayashi, C., & Nakazawa, K. 1976, Progress of Theoretical Physics 56, 1756
- Agnor, Canup, & Levison (1999) Agnor, C. B., Canup, R. M., & Levison, H. F. 1999, Icarus, 142, 219
- Alonso et al. (2004) Alonso, R., et al. 2004, ApJ, 613, L153
- Alvarez et al. (1980) Alvarez, L. W., Alvarez, W., Asaro, F., & Michel, H. V. 1980, Science, 208, 1095
- Artymowicz (1997) Artymowicz, P. 1997, ARE&PS, 25, 175
- Asphaug & Benz (1996) Asphaug, E., & Benz, W. 1996, Icarus, 121, 225
- Aumann et al. (1984) Aumann, H. H., Beichman, C. A., Gillett, F. C., de Jong, T., Houck, J. R., Low, F. J., Neugebauer, G., Walker, R. G., & Wesselius, P. R. 1984, ApJ, 278, L23
- Backman & Paresce (1993) Backman, D. E., & Paresce, F. 1993, in Protostars and Planets III, eds. E. H. Levy & J. I. Lunine, Tucson, Univ of Arizona, p. 1253
- Bernstein et al. (2004) Bernstein, G. M., Trilling, D. E., Allen, R. L., Brown, M. E., Holman, M., & Malhotra, R. 2004, AJ, 128, 1364
- Benz & Asphaug (1999) Benz, W., & Asphaug, E. 1999, Icarus, 142, 5
- Benz, Slattery, & Cameron (1986) Benz, W., Slattery, W. L., & Cameron, A. G. W. 1986, Icarus, 66, 515
- Cameron & Ward (1976) Cameron, A. G. W., & Ward, W. R. 1976, Abstracts of the Lunar and Planetary Science Conference, vol 7, p. 120
- Campo Bagatin & Petit (2001) Campo Bagatin, A., & Petit, J.-M. 2001, Icarus, 149, 210
- Canup (2004a) Canup, R. 2004a, Icarus, 168, 433
- Canup (2004b) Canup, R. 2004b, ARA&A, 42, 441
- Chambers (2001) Chambers, J. E. 2001, Icarus, 152, 205
- Chiang & Murray-Clay (2004) Chiang, E. I., & Murray-Clay, R. A. 2004, ApJ, 607, 913
- Cohen, Swindle, & Kring (2000) Cohen, B. A., Swindle, T. D., & Kring, D. A. 2000, Science, 290, 1754
- Connolly (2005) Connolly, Jr., H. C. 2005, Science, 307, 75
- Davis et al. (1985) Davis, D. R., Chapman, C. R., Weidenschilling, S. J., & Greenberg, R. 1985, Icarus, 62, 30
- Deeg et al. (2004) Deeg, H. J., Alonso, R., Belmonte, J. A., Alsubai, K., Horne, K., Doyle, L. 2004, PASP, 116, 985
- Dohnanyi (1969) Dohnanyi, J. W. 1969, J. Geophys. Res., 74, 2531
- Dominik & Decin (2003) Dominik, C., & Decin, G. 2003, ApJ, 598, 626
- Durda & Dermott (2002) Durda, D. D., & Dermott, S. F. 2002, Icarus, 130, 140
- Durda, Greenberg, & Jedicke (1998) Durda, D. D., Greenberg, R., Jedicke, R. 1998, Icarus, 135, 431
- Durda et al. (2004) Durda, D. D., Bottke, W. F., Enke, B. L., Merline, W. J., Asphaug, E., Richardson, D. C., & Leinhardt, Z. M. 2004, Icarus, 170, 242
- Grogan et al. (2001) Grogan, K., Dermott, S. F., & Durda, D. D. 2001, Icarus, 152, 251
- Greaves (2005) Greaves, J. S. 2005, Sci., 307, 68
- Greaves et al. (2005) Greaves, J. S., Holland, W. S., Wyatt, M. C., Dent, W. R. F., Robson, E. I., Coulson, I. M., Jenness, T., Moriarty-Schieven, G. H., Davis, G. R., Butner, H. M., Gear, W. K., Dominik, C., & Walker, H. J. 2005, ApJ, 619, L187
- Habing et al. (2001) Habing, H. J., et al. 2001, A&A, 365, 545
- Hamilton et al. (2001) Hamilton, C. M., Herbst, W., Shih, C., & Ferro, A. 2001, ApJ, 554, L201
- Hartmann (1975) Hartmann, W. K. 1975, Icarus, 24, 181
- Hartmann (1980) Hartmann, W. K. 1980, In Conference on the Lunar Highlands Crust, edited by J. Papike & R. Merrill, Pergamon, New York, p. 155
- Hartmann & Davis (1975) Hartmann, W. K., & Davis, D. R. 1975, Icarus, 24, 504
- Hartmann et al. (2000) Hartmann, W. K., Ryder, G., Dones, L., & Grinspoon, D. H. 2000, In Origin of the Earth and Moon, edited by R. Canup & K. Righter, UofA Press, Tucson, p. 493
- Hayashi (1981) Hayashi, C. 1981, Prog Theor Phys Suppl, 70, 35
- Holsapple (1994) Holsapple, K. A. 1994, Planet. Space Sci., 42, 1067
- Housen & Holsapple (1990) Housen, K., & Holsapple, K. 1990, Icarus, 84, 226
- Housen & Holsapple (1999) Housen, K., & Holsapple, K. 1999, Icarus, 142, 21
- Itoh & Yurimoto (2003) Itoh, S., & Yurimoto, H. 2003, Nature, 423, 7281
- Kalas (1998) Kalas, P. 1998, Earth, Moon, & Planets, 81, 27
- Kenyon & Bromley (2002) Kenyon, S. J., & Bromley, B. C., 2002, AJ, 123, 1757
- Kenyon & Bromley (2004a) Kenyon, S. J., & Bromley, B. C., 2004a, AJ, 127, 513
- Kenyon & Bromley (2004b) Kenyon, S. J., & Bromley, B. C., 2004b, ApJ, 602, L133
- Kenyon & Bromley (2004c) Kenyon, S. J., & Bromley, B. C., 2004c, AJ, 128, 1916
- Kenyon & Luu (1998) Kenyon, S. J., & Luu, J. X. 1998, AJ, 115, 2136
- Kenyon & Luu (1999) Kenyon, S. J., & Luu, J. X. 1999, AJ, 118, 1101
- Koeberl (2003) Koeberl, C. 2003, EM&P, 92, 79
- Konacki et al. (2003) Konacki, M., Torres, G., Sasselov, D. D., Pietrzyski, G., Udalski, A., Jha, S., Ruiz, M. T.; Gieren, W., Minniti, D. 2003, ApJ, 609, L37
- Leinhardt & Richardson (2000) Leinhardt, Z. M., & Richardson, D. C. 2000, Icarus, 146, 133
- Leinhardt & Richardson (2002) Leinhardt, Z. M., & Richardson, D. C. 2002, Icarus, 159, 306
- Levison et al. (2001) Levison, H. F., Dones, L. Chapman, C. R., Stern, S. A., Duncan, M. J., & Zahnle, K. 2001, Icarus, 151, 286
- Lissauer (1987) Lissauer, J. J. 1987, Icarus, 69, 249
- Melosh, Vickery, & Tonks (1993) Melosh, H. J., Vockery, A. M., & Tonks, W. B. 1993, in Protostars and Planets III, eds. E. H. Levy & J. I. Lunine, Tucson, Univ of Arizona, p. 1339
- Michel et al (2004) Michel, P., Benz, W., & Richardson, D. C. 2004, P&SS, 52, 1109
- Michel et al (2001) Michel, P., Benz, W., Tanga, P., & Richardson, D. C. 2001, Science, 294, 1696
- Michel et al (2002) Michel, P., Tanga, P., Benz, W., & Richardson, D. C. 2002, Icarus, 160, 10
- Nesvorný et al. (2002a) Nesvorný, D., Bottke, W. F., Dones, L., & Levison, H. F. 2002a, Nature, 417, 720
- Nesvorný et al. (2002b) Nesvorný, D., Morbidelli, A., Vokrouhlický, D., Bottke, W. F., & Bro, M. 2002b, Icarus, 157, 155
- Neukum (1983) Neukum, G. 1983, Meteoritenbombardement und Datierung Planetarer Oberflaechen
- Ohtsuki, Stewart, & Ida (2002) Ohtsuki, K., Stewart, G. R., & Ida, S. 2002, Icarus, 155, 436
- Pan & Sari (2005) Pan, M., & Sari, R. 2005, Icarus, 173, 342
- Pont et al. (2004) Pont, F., Bouchy, F., Queloz, D., Santos, N. C., Melo, C., Mayor, M., & Udry, S. 2004, A&A, 426, L15
- Rieke et al. (2005) Rieke, G. H., Su, K. Y. L., Stansberry, J. A., Trilling, D., Bryden, G., Muzerolle, J., White, B., Gorlova, N., Young, E. T., Beichman, C. A., Stapelfeldt, K. R., & hines, D. C. 2005, ApJ, 620, 1010
- Ryder (1988) Ryder, G. 1988, in it Workshop on Moon and Transition: Apollo 14, KREEP, and Evolved Lunar Rocks, p. 71
- Ryder (2002) Ryder, G. 2002, J. Geophys. Res., 107, E4, 6-1
- Safronov (1969) Safronov, V. S. 1969, Evolution of the Protoplanetary Cloud and Formation of the Earth and Planets, Nauka, Moscow [Translation 1972, NASA TT F-677]
- Stern (1994) Stern, S. A. 1994, AJ, 108, 2312
- Stern & Colwell (1997) Stern, S. A., & Colwell, J. E. 1997, AJ, 114, 841
- Strom, Schaber, & Dawsow (1994) Strom, R. G., Schaber, G. G., & Dawsow, D. D. 1994, JGR, 99, 10899
- Swindle (1993) Swindle, T. D. 1993, in Protostars and Planets III, eds. E. H. Levy & J. I. Lunine, Tucson, Univ of Arizona, p. 867
- Tera, Papanastassiou, & Wasserburg (1974) Tera, F., Papanastassiou, D. A., & Wasserburg, G. J. 1974, Earth Planet. Sci. Lett., 22, 1
- Thébault, Augereau, & Beust (2003) Thébault, P., Augereau, J. C., & Beust, H. 2003, A&A, 408, 775
- Uzzo et al. (2001) Uzzo, M., Raymond, J. C., Biesecker, D., Marsden, B., Wood, C., Ko, Y.-K., & Wu, R. 2001, ApJ, 558, 403
- Wadhwa & Russell (2000) Wadhwa, M., & Russell, S. S. 2000, in Protostars abd Planets IV, eds. V. Mannings, A. P. Boss, & S. S. Russell, Tucson, Univ. of Arizona, p. 995
- Weidenschilling (1977) Weidenschilling, S. J. 1977, Astrophys Sp Sci, 51, 153
- Weidenschilling et al. (1997) Weidenschilling, S. J., Spaute, D., Davis, D. R., Marzari, F., & Ohtsuki, K. 1997, Icarus, 128, 429
- Wetherill & Stewart (1993) Wetherill, G. W., & Stewart, G. R. 1993, Icarus, 106, 190
- Wilhelms (1987) USGS Prof. Pap, 1348, 1987
- Williams & Wetherill (1994) Williams, D. R., & Wetherill, G. W. 1994, Icarus, 107, 117
- Winn et al. (2004) Winn, J. N., Holman, M. J., Johnson, J. A.; Stanek, K. Z., & Garnavich, Peter M. 2004, ApJ, 603, L45
- Wood (2004) Wood, J. A. Geochimica & Cosmochimica Acta, 68, 4007
- Wyatt & Dent (2002) Wyatt, M. C., & Dent, W. R. F. 2002, MNRAS, 334, 589
- Yin et al. (2002) Yin, Q., Jacobsen, S. B., Yamashita, K., Blichert-Toft, J., Télouk, P.; Albarède, F. 2002, Nature, 418, 949
- Zhang & Sigurdsson (2003) Zhang, B., & Sigurdsson, S. 2003, ApJ, 596, L95
- Zuckerman (2001) Zuckerman, B. 2001, ARA&A, 39, 549


| Parameter | Symbol | G Star Models | A Star Models | ||
|---|---|---|---|---|---|
| A | B | A | B | ||
| Stellar mass () | 1 | 1 | 3 | 3 | |
| Stellar luminosity () | 1 | 1 | 75 | 75 | |
| Inner radius (AU) | 0.4 | 30 | 3 | 30 | |
| Outer radius (AU) | 2.0 | 150 | 20 | 150 | |
| Particle mass density (g cm-3) | 3.0 | 1.5 | 3.0 | 1.5 | |
| Surface density at 1 AU (g cm-2) | 7.5–30 | 15–60 | 5–50 | 5–50 | |
| Gas removal timescale (yr) | – | – | |||