The project: III. Gas mass fraction shape in high redshift clusters
We study the gas mass fraction behavior in distant galaxy clusters observed within the project. The typical gas mass fraction shape of high redshift galaxy clusters follows the global shape inferred at low redshift quite well, once scaled appropriately : the gas mass fraction increases with radius and flattens outward. This result is consistent with the simple picture in which clusters essentially form by gravitational collapse, leading to self similar structures for both the dark and baryonic matter. However, we find that the mean gas profile in distant clusters shows some differences to local ones, indicating a departure from strict scaling. Assuming an Einstein-de Sitter cosmology, we find a slight deficit of gas in the central part of high- clusters. This result is consistent with the observed evolution in the luminosity-temperature relation. We quantitatively investigate this departure from scaling laws by comparing from a sample of nearby galaxy clusters (Vikhlinin, Forman & Jones, 1999) to our eight high-z clusters. Within the local sample, a moderate but clear variation of the amplitude of the gas mass fraction with temperature is found, a trend that weakens in the outer regions. Taking into account these variations with radius and temperature, the apparent scaled gas mass fractions in our distant clusters still systematically differ from local clusters. This reveals that the gas fraction does not strictly follow a scaling law with redshift. This provides clues to understand the redshift evolution of the relation whose origin is probably due to non-gravitational processes during cluster formation. An important implication of our results is that the gas fraction evolution, a test of the cosmological parameters, can lead to biased values when applied at radii smaller than the virial radius. From our clusters, as well as clusters in the same redshift range, the apparent gas fraction at the virial radius obtained by extrapolation of the inner gas profile is consistent with a non-evolving universal value in a high matter density model while in a concordance, model high redshift clusters show an apparent higher at the virial radius than to local clusters.
Key Words.:
Galaxies: clusters: general-galaxies:intergalactic medium–Cosmology:cosmological parameters – dark matter – X-rays: galaxies: clusters1 Introduction
Clusters of galaxies are unique cosmological probes whose statistical properties represent major sources of information for understanding the history of structure formation as well as for the determination of the cosmological parameters. X-ray observations are particularly relevant in this perspective as they allow one to estimate the distribution of both the baryonic and total mass components, a rather unique situation when studying structures in cosmology. In the simplest picture of purely gravitationally-driven formation of virialized systems like galaxy clusters, it is expected that such objects exhibit self-similarity (Kaiser 1986). In this model physical properties of galaxy clusters obey scaling laws which naturally emerge from the fact that there is no preferred scale and therefore two clusters of different masses should have identical internal structure when normalized to the virial radius. Furthermore, such internal structure should be independent of redshift. Self-similarity applies to both the dark matter component and to the hot X–ray emitting intra-cluster medium (ICM). As clusters of different masses arise from fluctuations of different amplitude (relative to the r.m.s. value), such a scaling is not expected to hold exactly. Furthermore, in cosmological models different from the Einsten-de Sitter model, the strict self-similarity of the expansion of the universe might be broken. Nevertheless numerical simulations have shown that the relations between physical quantities expected from the scaling laws hold very well (Bryan & Norman 1998). Comparison of expected relations to observations is therefore expected to provide key information on their formation processes.
The observed properties of clusters are different from the
scaling predictions, for example the observations lead to a luminosity-temperature relation which scales as while theoretical models predict . Such
deviations from scaling laws are interpreted as due to non-gravitational
processes such as preheating by early galactic winds
(e.g. Kaiser 1991; Evrard & Henry 1991,
David et al. 1995, Cavaliere, Menci, & Tozzi 1998) or to radiative cooling
(Pearce
et al. 2000; Muawong et al. 2002) and feedback from star formation or AGN (Voit
& Bryan 2001, Valageas & Silk 1999). The excess of entropy (the so-called
”entropy floor”) in cold system, provides further evidence of the
importance of non-gravitational processes (Ponman et al. 1999;
Lloyd-Davis et al. 2000). Although some numerical simulations including
radiative cooling and/or pre-heating were able to reproduce the observed
steepening in the – relation consistent with the
observations (Bialek et al. 2001, Borgani et al. 2001), it is yet unclear
whether the relevant physics has been properly identified and implemented.
Self-similar models also make predictions on the evolution of cluster properties. In particular the – relation should scale as where should be equal to 3/2 in an Einstein de Sitter (EdS) universe. Several studies have found evidence of a weak evolution in the – relation (Sadat et al. 1998; Reichart et al. 1999). However, the luminosity estimates depend on the assumed cosmological parameters as does the constraint on the amount of evolution. From the analysis of recent data of high-z clusters it has been found that in an EdS Universe while in a concordance model this value is close to 1.5, close to the value expected accordingly to standard scaling laws (Lumb et al. 2004). This result is consistent with previous investigations based on ASCA and data (Sadat et al. 1998; Novicki et al. 2002; Vikhlinin et al. 2002). The cosmological implication of such evolution has been presented in Vauclair et al. (2003). The aim of the present study is to better understand the evolution of the gas mass fraction with redshift. We will show that understanding these properties is important to put constraints on the cosmological parameters by requiring that the gas mass fraction remains constant with look-back time. Indeed, comparing the profiles of clusters at different redshifts provides more information than simply considering global quantities such as the total X-ray luminosity.
We base our analysis on the XMM data obtained on a sample of eight distant clusters observed as part of the project, a systematic guaranteed time follow-up of the most distant SHARC clusters (Bartlett et al. 2002). The high sensitivity of allows us to investigate emissivity in high redshift clusters beyond half the virial radius, a remarkable result (Arnaud et al. 2002). Our sample represents an homogeneous sample of eight bona fide clusters with median luminosities between 2 and 15 erg/s (in an Einstein de Sitter cosmology with a Hubble constant of 50 km/s/Mpc) with redshifts in a relatively restricted range, between 0.45 and 0.65. This sample is therefore expected to be fairly representative of the cluster population at high redshift, allowing a systematic analysis of the gas mass profiles and therefore allowing us to address the issue of gas mass fraction self-similarity and its implications in constraining the cosmological parameters. Moreover, the high sensitivity of makes possible a statistical investigation of the outer gas distribution in this sample, a key aspect as we will see. The detailed data reduction and analysis of this sample is presented in Lumb et al. (2004). The present paper is organized as follows. In section 2 we discuss the expectation of the gas mass fraction from scaling arguments as well as the results of the comparison of gas mass fraction in distant clusters to low redshift ones. In section 3, we discuss the consequence of our findings for the use of clusters as cosmological probes. Finally, our conclusions are given in section 4. We used a Hubble constant of 50 km/s/Mpc unless the dependence is explicitly given (with km/s/Mpc).
2 Scaling properties
Self-similar assumptions imply that the radial profile of any physical
quantity should exhibit a similar shape independently of the cluster mass and at
any
redshift, once normalized to the virial radius. Numerical simulations
in which only gravitational physics is taken into account indicate
that halos of different masses follow
a universal density profile, the so-called NFW profile
(Navarro, Frenk & White
1996). On the observational side, the X-ray emissivity profiles
in hot galaxy clusters have been also found to
be very similar, at least in the outer part (Ponman et al. 1999;
Neumann & Arnaud 1999, Arnaud, Neumann & Aghanim 2001). Furthermore, evidence has been found that radial profiles of the , as well as the baryon fraction
, are similar and seem
to follow a roughly universal shape (Roussel et al. 2000, hereafter RSB00).
It has been found that such a universal profile is in reasonable agreement
with the predictions of numerical simulations (Sadat & Blanchard
2001; hereafter SB01).
This supports the idea that the gas structure has not been strongly
disturbed by non-gravitational processes and supports the principle
of using their properties to constrain cosmological parameters.
Previous studies of the baryonic content in clusters indicated that baryons
contribute 15-20% of the total cluster mass (for ); if the baryon
fraction is representative of the universe as a whole
and, provided that the actual baryon abundance is known,
the cosmological matter density parameter should lie in the range
(White et al. 1993, David et al. 1995, Evrard 1997).
However, although the gas mass fraction profile follows quite well the
self-similarity assumption (RSB00), the density parameter
derived from the baryon fraction
estimation might be corrupted by different effects that are related
to the internal structure of the gas and that
could alter the inferred value (SB01).
2.1 Estimation of the cluster under the scaling hypothesis
As already mentioned, the self-similarity hypothesis implies that the spatial variation of any physical quantity depends solely on ; the virial radius can be obtained from its definition :
| (1) |
where is the virial contrast density compared to the universe. In an Einstein-de Sitter universe, one has . In other cosmological models, there is some ambiguity as to how to define the proper reference radius for scaling relations. Commonly, the virial radius is defined from the spherical top-hat model (see for instance Bryan & Norman, 1998; note that these authors provide useful fits to compute with formulae involving , the contrast density, compared to a critical universe of density ). The scaling of the mass-temperature relation is then obtained from :
| (2) |
The normalization can be obtained from
numerical simulations (Evrard, Metzler, Navarro 1996, Bryan & Norman 1998)
or inferred from observations.
In the following, we use the same calibration as in
SB01, , allowing a direct comparison with their results. Several studies have been performed in order to test the –
relation as predicted from numerical simulations by means of X-ray observations
(see e.g. Horner et al. 1999, Nevalainen et al. 2000, Finoguenov et al. 2001,
Sanderson et al. 2003). Disagreements have been found concerning both the
normalization and the slope (steeper than the predicted 1.5) for
cooler systems ( less than 4 keV). Note however that different
normalizations of the – relation are not
expected to make a difference in the comparison
between local and high redshift samples, therefore the test
is essentially based on the assumption that scaling of the relation
is correct.
The gas mass fraction at a given radius is
computed for each cluster. The gas mass profile follows directly from the
electron number density profile:
| (3) |
where is the helium mass fraction (hereafter ). We assume a fully ionized gas, spherically distributed, and a –model for its distribution, which is known to provide a good representation of the gas out to the outer regions (VFJ99):
| (4) |
where end corresponding to the best fit values derived in Lumb et al. (2004). The central gas density was derived from the normalization K of the XSPEC Mekal model defined by
| (5) |
where and are respectively the electron and proton number densities and is the angular distance to the cluster. We assume in the ionized intra-cluster plasma. The emission integral was evaluated assuming that the x-ray emission extends up to the virial radius, in order to be fully consistent with Lumb et al. (2004). There is some arbitrariness in the assumption of the radius up to which the emission has to be taken into account, ranging from the largest radius at which the emission is detected up to infinity. For our sample, the contribution to the flux of the emission, estimated by extrapolation of the fitted profile, beyond the detection radius is less than 1%, and therefore represents a negligible source of uncertainty on our derived gas masses.
The normalization K value of each cluster was taken from Table 2 of
Lumb et al. (2004).
The dark matter profile was assumed to follow the NFW analytical profile
(Navarro et al. 1996) with a concentration parameter in order to
allow direct comparison with RSB00 (again, changing the value of the
concentration parameter
is not expected to modify the relative comparison of local and distant
clusters).
In this study we will consider two cosmologies: an Einstein-de-Sitter (EdS)
Universe () and a concordance model (CDM) Universe with
(). The apparent values
of our clusters estimated at are given in Table
1 for both cosmologies. The mean value at
is in an EdS model and
in a CDM model.
| Cluster name | RXJ0337.7 | RXJ0505.3 | RXJ0847.2 | RXJ1120.1 | RXJ1325.5 | RXJ1334.3 | RXJ1354.2 | RXJ1701.3 |
|---|---|---|---|---|---|---|---|---|
| 0.577 | 0.51 | 0.56 | 0.60 | 0.445 | 0.62 | 0.551 | 0.45 | |
| T (keV) | 2.6 | 2.5 | 3.62 | 5.45 | 4.15 | 5.2 | 3.66 | 4.5 |
| 0.3 | 0.3 | |||||||
| (EdS) | 0.723 | 0.757 | 0.867 | 1.024 | 1.041 | 0.982 | 0.879 | 1.079 |
| (EdS) | 0.0782 | 0.0987 | 0.0959 | 0.1054 | 0.0703 | 0.095 | 0.1162 | 0.1016 |
| (CDM) | 1.315 | 1.358 | 1.572 | 1.87 | 1.843 | 1.799 | 1.591 | 1.911 |
| (CDM) | 0.1109 | 0.1500 | 0.1431 | 0.1495 | 0.1007 | 0.1446 | 0.1825 | 0.1424 |
2.2 The shape of the apparent gas mass fraction
In order to investigate the global shape of profile we have followed the procedure similar to RSB00. We compute up to the maximum radius of detection (published in Lumb et al. 2004). Beyond this limit, this limit is obtained by extrapolating up to the virial radius. The radial distribution in the local sample is derived using the published values up to the X-ray limiting radius (RSB00), upward of this radius we computed at the two fiducial radii and defined by Vikhlinin, Forman & Jones (1999, hereafter VFJ99) for which they published the gas masses (), allowing a comparison in the most outer regions. For this comparison we do not correct for clumping (Mathiesen et al. 1999) as the radial variation of this quantity is unknown. Moreover, if the scaling holds, the emission of both local and distant clusters should be biased by the same amount by this effect, still allowing a meaningful direct comparison.
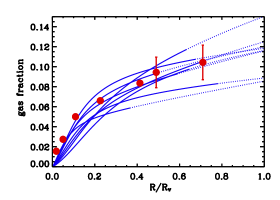
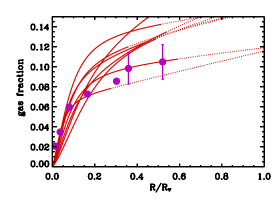
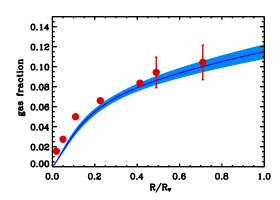
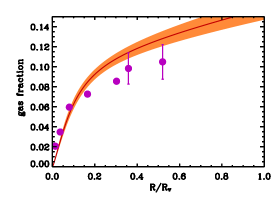
The scaled radial profiles of the individual high-z clusters and the mean profile of the local sample derived for both EdS and CDM models are displayed in Fig. 1. For a given value of the normalization , the virial radius (for a given temperature) depends on the cosmology through equation 1 and 2. However, in practice for a NFW profile the masses inferred in a fixed physical radius for low redshift clusters are very similar in both cosmologies. As expected, a noticeable difference in the amplitude of in distant clusters appears, depending on the cosmological model. For both cosmological models, the scaled profile of distant clusters is globally in good agreement with what has been inferred for clusters at low redshift by SB01: the apparent mean gas profile of our distant clusters increases from the center to outer shells following roughly a universal gas mass fraction shape. Interestingly, these exhibit a level of dispersion consistent with what has been found previously (RSB00, VFJ99). In the EdS model the most central values of seem smaller in high redshift clusters. Such a deviation is consistent with the measured evolution of the – relation, weaker than expected if the scaling strictly hold. Conversely, in the low density flat model, values in the central parts of distant clusters seem to agree more with the scaling, again in agreement with the evolution of the – relation in this cosmology. However, in the outer regions the mean in the distant sample seems not to match the local one very well. Examination of the average compared to the local one more clearly reveals a systematic difference: the inner mean gas mass fraction in distant clusters does not rise in as rapidly as in the local sample. It is unclear whether this difference is real, given the various origins of clusters used in the local sample.
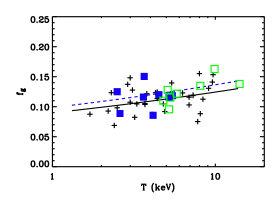
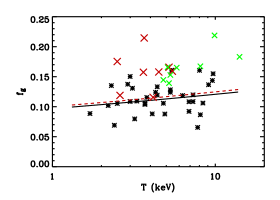
2.3 fgas–Tx correlation
In order to understand whether the above difference is meaningful, an accurate knowledge of the gas mass fraction is needed. By examination of the RSB01 sample, restricted to clusters for which the actual X-ray extension was known, we found a clear trend of increasing with temperature (this trend is much less clear in the global sample). However, this sample was not designed to offer a uniform sample for X-ray studies, therefore it has been used only as a guideline in the present study. To examine in a more systematic and uniform way whether varies with temperature, we have computed of nearby clusters at the two fiducial radii , used in VFJ99 as well at the virial radius. The gas mass fraction in our high-z cluster sample has been estimated at the same average radii (in units of the virial radius) allowing a direct comparison between the local and distant values. In our distant clusters, X-ray emission is detected up to a radius comparable to so direct comparison is meaningful. Emission has to be extrapolated up to ; it was extrapolated in both samples in similar ways. For further comparison we have also computed the baryon fraction for clusters within the same redshift range from data obtained by Vikhlinin et al. (2002) whose x-ray detection extends typically up to the virial radius.
| Radius | Gas fraction | Gas fraction |
|---|---|---|
| () | () | |
| (17%) | (16%) | |
| (17%) | (17%) | |
| Virial | (18.8%) | (22%) |
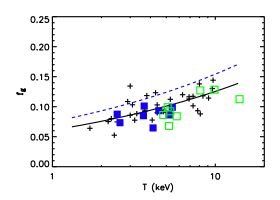
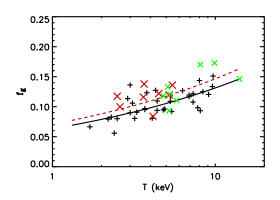
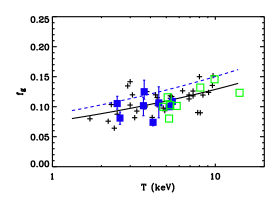
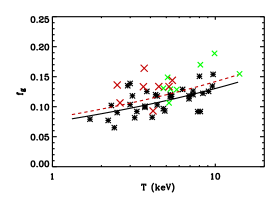
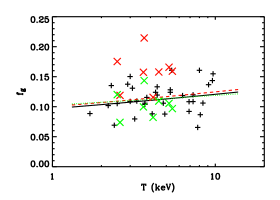
For a fixed value of the normalization of the mass–temperature relation, the virial radius and the total mass enclosed in a given physical radius depend on the cosmological model. In Figure 2, we have plotted in the local and high redshift clusters versus temperature for the two cosmological models. Results from least square fits of the local data are given in Table 2, as well as dispersions around the best fit line. values derived from the local sample reveal a clear trend with temperature: the gas mass fraction at a fixed scaled radius increases with temperature. This trend is stronger in the inner radius () than at the outer radius (). At the virial radius, the inferred gas fractions are marginally consistent with gas mass fractions being independent of temperature ( in the Einstein–de Sitter model and in the concordance model). This shows that the apparent in local clusters possesses internal structure variations correlated with temperature, therefore the scaling in local clusters is only approximate. The origin of these variations is unclear: it might either be an actual variation of in clusters, but it might also be due to a variation of the clumping of the gas with temperature. The distant sample does not reveal any clear trend with temperature, due to its limited temperature range. However, when combined with clusters, a sequence appears similar to the one observed in local clusters. Comparison of the high- at and radii reveals that this internal structure also varies with redshift: the observed mean profile of distant clusters seems to increase toward the outer part less rapidly than in local clusters. This introduces an additional degree of complexity when it comes to the description of the scaling predictions. Indeed if the gas mass fraction varies with , scaling would imply:
| (6) |
where is the characteristic temperature associated with a
characteristic mass scale at the epoch
(defined by ). Therefore, we plot the
predicted variations of under this scaling assumption.
Comparing predictions from this scaling scheme at the three different radii
shows that the variations with redshift of the
internal structure do not follow the scaling either.
This is a clear indication that clumping arising from
hierarchical building of clusters in a purely gravitational picture
is not the only origin of the observed complexity. Rather, it is
likely to originate from non-gravitational heating processes,
whose modifications
of the internal structure of clusters are
not expected to follow standard scaling. It is interesting that
at the virial radius, the values we obtained for and clusters
are consistent and suggest that the gas fraction may not vary any longer with
temperature. As our gas quantities are extrapolated beyond emission
detection (although not by much, especially in the case of the clusters), it
would be important to have deeper observations of the outer
regions of clusters to confirm this result, both for local and distant clusters.
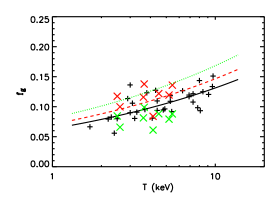
Finally we have also considered another possibility. Vauclair et al. (2003) have shown that the concordance model when properly normalized to local cluster abundances, could not reproduce the observed numbers counts of distant clusters unless the mass temperature scaling with redshift is modified:
| (7) |
(i.e. the () term in Eq. 2 has been removed). This changes the apparent gas mass fraction in distant clusters as well as the predictions of the scaling model. The gas mass fractions on both low and high redshift clusters were recomputed, as was the expected scaled variation of with temperature. The results are shown as green symbols and lines in the colored version of Figure 3. Again, the scaling hypothesis seems not to work well under this scheme, perhaps not surprisingly given that the scaling has been already abandoned.
3 Cosmological application
The idea that the actual in clusters should be universal is the starting point of an interesting cosmological test that has been proposed based on the apparent evolution of with redshift (Sasaki 1996; Pen, 1997; Cooray 1998). The principle of this test is based on the fact that the inferred gas mass fraction from X-ray data depends on the assumed cosmology through the angular distance. Comparing the high redshift value to what is inferred from local clusters provides us in this way with a new test to constrain the cosmological parameters.
However, from our study, it appears that there are several sources of complexity when applying this test. A first fact that should be taken into account is that varies with radius inside clusters. This variation can be accommodated if the shapes are self-similar, by working at identical scaled radius, i.e. (or in a nearly equivalent way, at similar density contrast). Clearly, in order to prevent any bias one should compare at identical radii (in units of virial radius) up to which gas emission is detected. The second problem is that the apparent has been found to vary with temperature (mass). There has been some debate on the strength of this effect (David et al 1995, Arnaud & Evrard 1999, Mohr et al 1999, RSB00), but such a possibility should be kept in mind when applied to cosmological purposes. What we have obtained from the analysis of the VFJ99 sample is that in the inner part of clusters both the shape and the amplitude of the gas mass fraction varies with temperature. In such a regime, it is unclear whether arguments based on the scaling hypothesis are valid. However, our result are consistent with the hypothesis that the gas fraction is constant at the virial radius. It is therefore vital to have better data on the behavior in clusters in their outer part, in order to reach conclusions of cosmological relevance.
The fact that the dispersion in measurements in our
distant sample is similar to that obtained in local clusters is
very positive. Indeed, uncertainties on (from
uncertainties on temperature and flux) in our distant clusters
are significantly smaller than the intrinsic scatter (see Fig 2). From
our study it appears that although the global shape in
distant clusters is similar to the shape obtained at low redshift, the
complex internal structure, i.e. the variation of the gas mass
fraction with radius, with temperature and with redshift reveals
differences that cannot be described in a simple scalable
scheme. The observed variations in the central parts are clear
indications that evolution argument cannot be used in
this regime, given the present (lack of) understanding of the gas
physics in clusters. However, the fact that appears to
be almost constant against temperature at the virial radius is an
important piece of information indicating that the argument of a
non-evolving could be valid at this radius. From
Fig. 2, we can see that derived from
clusters as well as from clusters are consistent with the values obtained in low redshift
clusters for the EdS model, while we observe a clear offset between
values in distant and nearby clusters computed in the
case of a CDM model. The concordance model under
the assumption of standard scaling has been found to be ruled out at a
level of significance of more than 4 from the XMM data (6
when combined with Chandra measurements) while the Einstein–de
Sitter model lies at better than .
Several aspects however make the direct cosmological interpretation
difficult. First our sample is quite small and it would be
invaluable to have an extended version with a significantly larger
number of clusters. However, the fact that similar results are obtained from the
data is very encouraging. As a trend has been found with
temperature, it is possible that similar trends exist with luminosity.
Therefore
meaningful statistical comparisons require data from X-ray selected cluster samples
and as much as
possible from comprehensive analysis. The second point is
that a clear trend with temperature exists and could be a source of
confusion: temperatures in our sample are lower
than in the local sample and therefore
expected average values are smaller (for the same
). Comparing in our clusters with the
hottest local cluster, would have led to a systematic bias, at least
for the inner regions.
Indeed, it is expected that the brightest clusters (at a fixed
temperature and at a given redshift) would have a higher inner baryon
fraction than the average population. Therefore it is natural that
the trend observed with temperature is also present with luminosity.
Finally, we showed that the internal structure of the gas is
not strictly identical in high and low redshift clusters, declining
faster in the central part of high redshift clusters. This is
consistent with what seems already to emerge from Fig. 1. This complex
internal structure is probably the result of non-gravitational (pre)
heating of the gas which is currently advocated to explain the
observed – relation, but might also result from
more fundamental departure of scaling laws in the dark matter, for instance
if evolved with redshift. These systematic
variations with radius, temperature and redshift imply that the
baryon fraction test should be performed with caution and probably
only at the virial radius, although one expects that
outer regions are more affected by clumping and it is not clear
that clumping should follow simple scaling relations in a low density
universe.
4 Conclusion
The observations of distant clusters with offer an unique possibility to investigate the outer emissivity of the gas distribution in distant X-ray clusters. These observations have revealed for the first time the existence of a complex internal structure which does not follow simple scaling laws but still does show some regularities. The observations of the distant SHARC clusters reveal some interesting results on this issue: the shape of the apparent derived for these clusters is in good agreement with the shape inferred by SB01 for local clusters. This is an independent confirmation that the scaled shape of the gas mass fraction in clusters is in rough agreement with numerical simulations. However, our analysis reveals some deviations from the standard scaling in the profile of high redshift clusters. Furthermore, by comparing our distant clusters to a sequence of local clusters, we found a clear variation of the internal structure with temperature and redshift which cannot be described by simple scaling relations. This implies that the baryon fraction evolution, or lack thereof, cannot be used as a reliable cosmological test without better understanding of the internal structure of clusters. Nevertheless, at the virial radius the gas fraction seems to be independent of temperature in the low redshift sample and therefore that the high-redshift clusters might be used to apply the cosmological test based on the assumption that at the virial radius has a universal value independent of redshift, although existing data do not allow a firm statement about this hypothesis. From our sample of high redshift clusters at the virial radius the data are found to be roughly consistent with a non-evolving in an Einstein-de Sitter model, but not within the standard concordance model in which the inferred apparent appears systematically higher than in local clusters, unless a non-standard scaling with redshift of the relation (Vauclair et al. 2004) is used. However, the complex internal structure of the gas revealed by the present analysis of clusters prevents us from drawing definitive conclusions on cosmological parameters, as the relevant quantities were extrapolated at the virial radius. In the concordance model the mean value estimated inside the radius of detections, is still found to lie at 4 above the mean gas mass fraction of nearby clusters with similar temperature.
Acknowledgements.
This research made use of the X-Ray Clusters Database (BAX) which is operated by the Laboratoire d’Astrophysique de Toulouse-Tarbes (LATT), under contract with the Centre National d’Etudes Spatiales (CNES). We acknowledge useful comments from the referee which contributed improving the content of this paper.References
- (1) Arnaud, M., Neumann, D. & Aghanim, N. 2001, A&A 365, 80
- arnaud02 (2002) Arnaud, M., Majerowicz, S., Lumb, D. H, Neumann, D. M., Aghanim N., Blanchard, A., Boer, M., Burke, D., Collins, C., Giard, M., Nevalainen, J., Nichol, R. C., Romer, K. & Sadat, R. 2002, A&A 390, 27
- (3) Arnaud, M. & Evrard, A. E. 1999, MNRAS 305, 631
- omegaP (2000) Bartlett, J. G. et al., 2001, proceedings of the XXI rencontres de Moriond, astro-ph/0106098
- (5) Bialek, J.J., Evrard, A.E. & Mohr, J.J. 2001, ApJ, 555, 597
- (6) Borgani, S., Governato, F., Wadslay, J. et al., 2001, ApJ 559, L71
- Bryan (1998) Bryan, G.L. & Norman, M.L. 1998, ApJ 495, 80
- caval (1998) Cavaliere, A., Menci, N. & Tozzi, P. 1998, ApJ 501, 493
- Cooray (1998) Cooray, A. R., 1998, A&A 337, 71
- David et al (1995) David, L. P., Jones, C. & Forman, W. 1995, ApJ 445, 578
- Evrard (1997) Evrard, A. E, 1997, MNRAS 292, 289
- (12) Evrard, A. E. & Henry, J. P. 1991, ApJ, 383, 95
- Evrard et al (1996) Evrard, A. E, Metzler, C. A., & Navarro, J. F., 1996 ApJ 469, 494
- Finoguenov et al. (1999) Finoguenov, A., Reiprich, T. H. & Bohringer, H. 2001, A&A 368, 749
- Horner et al. (1999) Horner, D. J., Mushotzky, R. F. & Scharf, C. A. 1999, ApJ 520, 78
- Kaiser86 (1996) Kaiser, N. 1986, MNRAS 222, 323
- Kaiser91 (1991) Kaiser, N. 1991, ApJ 383, 104
- (18) Lloyd-Davies, E. J., Ponman, T. J. & Cannon, D. B. 2000, MNRAS 315, 689
- Lumb, (2004) Lumb, D. H., Bartlett, J. G., Romer, K., Blanchard, A., Burke, D., Collins, C., Nichol, R. C., Giard, M., Marty, P., Nevalainen, J., Sadat, R. & Vauclair, S. 2004, A&A 420, 853
- Mathiesen et al (1999) Mathiesen, B., Evrard, A. E. & Mohr, J. J. 1999, ApJ 520, L21
- (21) Mohr, J. J., Mathiesen, B. & Evrard, A. E., 1999, ApJ 517, 627
- Mohr et al (1999) Mohr, J. J., Mathiesen, B. & Evrard, A. E. 1999, ApJ 517, 627
- Muowang (M) Muanwong, O., Thomas, Peter A. K., Scott T. P. & Frazer R. 2002, MNRAS 336, 527
- (24) Navarro, J. F., Frenk, C. S. & White, S. D. M. 1997, ApJ 490, 493
- Nevalainen (2000) Nevalainen, J., Markevitch, M. & Forman, W. 2000, ApJ 532, 694
- novicki (2002) Novicki, M. C., Sornig, M. & Henry, J. P. 2002, AJ 124, 2413
- dorisI (1999) Neumann, D. & Arnaud, M. 1999, A&A 348, 711
- Pearce (2000) Pearce, F. R., Thomas, P. A., Couchman, H. M. P. & Edge, A. C. 2000, MNRAS, 317, 1029
- Pen (1997) Pen, Ue-Li 1997, NewA, 2, 309
- Ponman (1999) Ponman, T.J., Cannon, D. B. & Navarro, J. F. 1999, Nature 397, 135
- (31) Reichart, D. E., Castander, F. J. & Nichol, R. C. 1999, ApJ 516, 1
- Roussel00 et al. (2000) Roussel, H., Sadat, R. & Blanchard, A. 2000, A&A 361, 429
- Sadat (1996) Sadat, R., Blanchard, A. & Oukbir, J. 1998, A&A 329, 21
- Sadat01 (2001) Sadat, R. & Blanchard, A. 2001, A&A 329, 21
- Sanserson (2003) Sanderson, A. J. R., Ponman, T. J., Finoguenov, A., Lloyd-Davies, E. J. & Markevitch, M. 2003, MNRAS 340, 989
- Sasaki96 (1996) Sasaki, S. 1996, PASJ 48, 119
- (37) Vauclair, S. C., Blanchard, A., Sadat, R., Bartlett, J. G., Bernard, J.-P., Boer, M., Giard, M., Lumb, D. H., Marty, P. & Nevalainen, J. 2003, A&AL, 412, L37
- (38) Valageas, P. & Silk, J. 1999, A&A, 347, 1
- Vikhlinin et al. (1999) Vikhlinin, A., Forman, W. R. & Jones, C. 1999 (VFJ99), ApJ 525, 47
- Vikhlinin et al. (1999) Vikhlinin, A., Van Speybroeck, Markevitch, M., Forman, W. R. & Grego, L. 2002, ApJ 578, L107
- (41) Voit, G. M.& Bryan, G. L. 2001, Nature, 414, 425
- White et al (1993) White, S. D. M., Navarro, J. F., Evrard, A. E. & Frenk, C. 1993, Nature 366, 429