Evolution in the Cluster Early-type Galaxy Size-Surface Brightness Relation at 11affiliation: Based on observations with the NASA/ESA Hubble Space Telescope, obtained at the Space Telescope Science Institute, which is operated by the Association of Universities for Research in Astronomy, Inc. under NASA contract No. NAS5-26555. Based on observations obtained at the European Southern Observatory using the ESO Very Large Telescope on Cerro Paranal (ESO Large Programme 166.A-0701).
Abstract
We investigate the evolution in the distribution of surface brightness, as a function of size, for elliptical and S0 galaxies in the two clusters RDCS J1252.9-2927, and RX J0152.7-1357, . We use multi-color imaging with the Advanced Camera for Surveys on the Hubble Space Telescope to determine these sizes and surface brightnesses. Using three different estimates of the surface brightnesses, we find that we reliably estimate the surface brightness for the galaxies in our sample with a scatter of mag and with systematic shifts of mag. We construct samples of galaxies with early-type morphologies in both clusters. For each cluster, we use a magnitude limit in a band which closely corresponds to the rest-frame , to magnitude limit of at , and select only those galaxies within the color-magnitude sequence of the cluster or by using our spectroscopic redshifts. We measure evolution in the rest-frame surface brightness, and find mag from the Coma cluster of galaxies for RDCS J1252.9-2927 and mag of evolution for RX J0152.7-1357, or an average evolution of mag. Our statistical errors are dominated by the observed scatter in the size-surface brightness relation, mag for RX J0152.7-1357 and mag for RDCS J1252.9-2927. We find no statistically significant evolution in this scatter, though an increase in the scatter could be expected. Overall, the pace of luminosity evolution we measure agrees with that of the Fundamental Plane of early-type galaxies, implying that the majority of massive early-type galaxies observed at formed at high redshifts.
Subject headings:
galaxies: clusters: general — galaxies: elliptical and lenticular, cD — galaxies: evolution — galaxies: fundamental parameters — galaxies: photometry — galaxies: clusters: individual (RDCS J1252.9-2927, RX J1052.7-1357)1. Introduction
The apparent evolution in the colors and magnitudes of early-type cluster galaxies has long been used as a test of the history of galaxy evolution. The relations between magnitude and size or velocity dispersion play an important role, as they give the observer a way to predict the apparent luminosity of a galaxy based on some other observable property (Faber & Jackson, 1976; Tully & Fisher, 1977; Kormendy, 1977; Djorgovski & Davis, 1987). Using these scaling relations, it has been observed that there is remarkable uniformity in cluster early-type galaxy properties at low redshifts, , (Sandage & Perelmuter, 1991; Jørgensen et al., 1996; Bernardi et al., 2003, for example). At redshifts up to , there have been a number of papers that have established a decrease in the mass-to-light ratio, using the Fundamental Plane. These studies find that the trend with redshift corresponds to a passively evolving stellar population which has a luminosity-weighted last epoch of major star-formation around (van Dokkum & Franx, 1996; Kelson et al., 1997; van Dokkum et al., 1998; Kelson et al., 2000c; van Dokkum & Franx, 2001; van Dokkum & Stanford, 2003; Wuyts et al., 2004; Holden et al., 2005). These systems also appear to have old stellar populations when examined using their colors (e. g.; Bower et al., 1992; Aragón-Salamanca et al., 1993; Ellis et al., 1997; Stanford et al., 1998; Blakeslee et al., 2003b; Holden et al., 2004), with a similar last epoch of star formation of . Combining the evolution in colors and in the scaling relations provide us with the data to measure the luminosity-weighted age of early-type galaxies and, therefore, the epoch when most of the constituent stars formed.
The size-magnitude relation is a projection of the Fundamental Plane (FP) along the velocity dispersion axis. It has long been known that low redshift early-type galaxies follow such a relation (Kormendy, 1977). By examining how the apparent magnitude changes as a function of redshift at a fixed size, we can measure the apparent luminosity evolution in early-type galaxies. Earlier measurements of this at (Sandage & Perelmuter, 1990a, b, 1991), and at (Schade et al., 1996, 1997, 1999; Sandage & Lubin, 2001; Lubin & Sandage, 2001a, b, c), found the same pace of evolution as found by the evolution of colors or from the FP of early-type galaxies.
We investigate the size-surface brightness relation for two complementary goals. First, we can extend the measured evolution to , which corresponds to the highest redshifts that the FP has been measured to date (van Dokkum & Stanford, 2003; Holden et al., 2005). However, because we have a much larger sample, we can also examine the distribution of the size-surface brightness relation to see if we find evidence for early-type galaxies that have younger stellar populations. Traditionally, this has been done with colors or spectroscopically (see Tran et al., 2003, for “E+A” galaxies that have early-type morphologies). van Dokkum & Stanford (2003), however, find that one of their early-type galaxies has an “E+A” like spectrum and appears to be an outlier from the distribution of sizes and magnitudes for that cluster (Holden et al., 2004). A significant population of such objects would imply that we are finding the epoch when intermediate mass cluster galaxies are completing their evolution into cluster early-type galaxies.
Our sample has two clusters, RDCS J1252.9-2927 at (Rosati et al., 2004) and RX J0152.7-1357 at (Della Ceca et al., 2000). For each we use Hubble Space Telescope imaging data and other supporting ground-based data, discussed in §2, to construct a sample of early-type cluster galaxies. For each galaxy in our sample, we measure three different total magnitudes and two different half-light radii (). The comparison of these measurements are discussed in §3. We verify that our sizes and total magnitudes are consistent, then use those two quantities to measure the mean surface brightness interior to the galaxy’s half-light radius (). In §4, we use and to estimate the amount of luminosity evolution seen from low redshift to the clusters in our sample. In addition, we examine the scatter in the relation and search for galaxies out of the norm. We discuss and summarize, in §5, our results in the context of other work. Throughout the paper we compute distances and absolute magnitudes using the cosmological parameters of , and . We use the AB magnitude system (Oke, 1990) unless otherwise noted.
2. Data
We combine a number of different datasets to explore the evolution of the size-magnitude relation. For our high redshift samples, we use the Advanced Camera for Surveys (ACS) imaging data for RDCS J1252.9-2927, already discussed in Blakeslee et al. (2003b), and for RX J0152.7-1357. Both clusters are described in Postman et al. (2005) which focuses specifically on morphological classification and the morphology-density relation. Both clusters have additional ground-based data in the form of spectra and multi-wavelength imaging. We compare our high redshift result with the data for MS 1358+62, at , from Kelson et al. (2000a). We select this particular dataset because of the similarities in methods used by the authors.
2.1. RDCS J1252.9-2927

As described in Blakeslee et al. (2003b), the Advanced Camera for Surveys (ACS) imaged RDCS J1252.9-2927, at , for 12 orbits in the F775W filter, or , and 20 orbits in the F850LP filter, or . The cluster was imaged as a mosaic of two by two positions, with three orbits in and five orbits in at each position. The central area was covered by each of the four positions, resulting in deeper imaging over the central arcminute. In Figure 1, we plot the filter transmission curves and a representative spectral energy distribution. We note here that the 850 in the F850LP designation refers to the wavelength where the filter begins. The central wavelength of the filter, when combined with the CCD performance is 9077Å, sampling at 4058Å in the rest-frame of RDCS J1252.9-2927.
The data were processed using APSIS, the ACS pipeline science investigation software, described in Blakeslee et al. (2003a). This pipeline generates drizzled images in each band, a detection image made by combining all of the drizzled data, and photometric catalogs constructed using a combination of the detection image and the final images in each filter.
As discussed in Blakeslee et al. (2003b), we selected objects in RDCS J1252.9-2927 with to ensure adequate signal-to-noise for the fits. Each galaxy was fit with a single component Sérsic model (Sérsic, 1968) using v1.7a, Rev 3 of the GALFIT package (Peng et al., 2002). The approach of Peng et al. (2002) is to construct a model, convolve it with a point spread function and then compare the of the resulting model with the data. For a noise model, we use the variance maps produced by the APSIS pipeline. Our point spread functions are based on ACS imaging data of crowded star fields. We will discuss this further in §3.1.
Each galaxy with was morphologically identified by four of us (BH, NC, MP, and MF). These identifications will be discussed in another paper (Postman et al., 2005). The identifications were made using the T-type morphological classification system (de Vaucouleurs et al., 1991). For the classifications, we found that 75% of the time all four classifiers agreed on the morphological type, and three out of four agreed 80% of the time. These statistics are for the whole of the sample and the agreement is much higher for the brighter galaxies. However, what matters for this work is how robust the classification for early-type galaxies in the final sample. There are only two galaxies in RDCS J1252.9-2927 that appear in our final sample where a majority of the four classifiers did not agree on a classification as an early type (i.e.; lenticular or elliptical). Both of those galaxies appear near the magnitude limit of our sample and neither are part of the spectroscopic sample we will discuss below. At , 15 out of the 20 early-type galaxies were classified unanimously. From , the fraction drops to 20 unanimous identifications out of 32 early-type galaxies, or 63%, but for 30 out of 32 times at least three out of the four classifiers agreed, higher than the 80% average for the whole sample.
Despite the high degree of internal consistency, one potential concern is a systematic offset in our classifications as compared with other publications. To control for this, one of the classifiers, MP, assigned types to every galaxy in the MS 1358+62 sample of Fabricant et al. (2000). The classifications by MP of MS 1358+62 agreed 80% of the time with those from Fabricant et al. (2000).
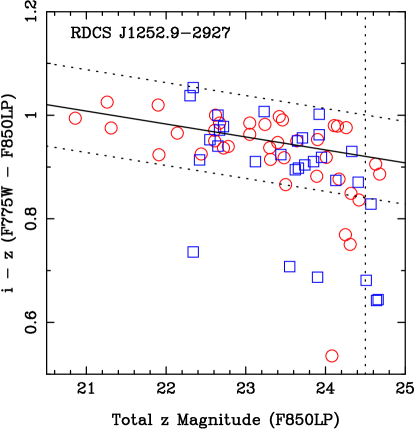
In Figure 2, we plot the color-magnitude diagram of the early-type galaxies with that are within 1 Mpc, or 192, of the cluster center and have mag. The circles represent galaxies classified as ellipticals () and squares represent S0 () galaxies. The solid line is the color-magnitude relation . The dotted diagonal line represents two standard deviations, or 0.08 mag, from this relation, see Blakeslee et al. (2003b) for details. We will use this color criteria for selecting early-type galaxies in the cluster. We remove spectroscopic non-members that, nonetheless, have the colors of the early-type red sequence in RDCS J1252.9-2927. We plot the magnitude limit for morphological identification, , as a vertical, dotted line in Figure 2. This magnitude limit corresponds to . We calculate starting with the value from Norberg et al. (2002) and evolving it with the relation of van Dokkum & Stanford (2003). At , in AB magnitudes using the previous results (Blakeslee et al., 2003b).
In addition to the ACS imaging data described above, we also use the photometric and spectroscopic data collected in Demarco (2003); Rosati et al. (2004); Lidman et al. (2004); Toft et al. (2004). The catalog for RDCS J1252.9-2927 contains photometry in the B, V, R, i, z, J and bands. The near-infrared images were obtained with ISAAC on the VLT (Lidman et al., 2004), while the optical images were observed using the FORS1 and FORS2 (Appenzeller & Rupprecht, 1992) instrument on the VLT. These optical and near-infrared images were used to create a sample of galaxies for a redshift survey of potential cluster members. All galaxies have and and (Demarco, 2003; Rosati et al., 2005). These colors were chosen to preferentially select galaxies at the redshift of the cluster regardless of the spectral energy distribution while ignoring redder stars as well as low redshift systems. A total of 383 objects were observed, of which 235 have secure redshifts. This yields a sample of 36 cluster members. The sample is almost complete for , which is . When comparing other samples with the redshift sample of RDCS J1252.9-2927, we will move the magnitude limit to but we will not use the color selection, shown with the two dotted lines, of Figure 2. This only adds one object to the sample that would not be included in the color-selected sample.
2.2. RX J0152.7-1357
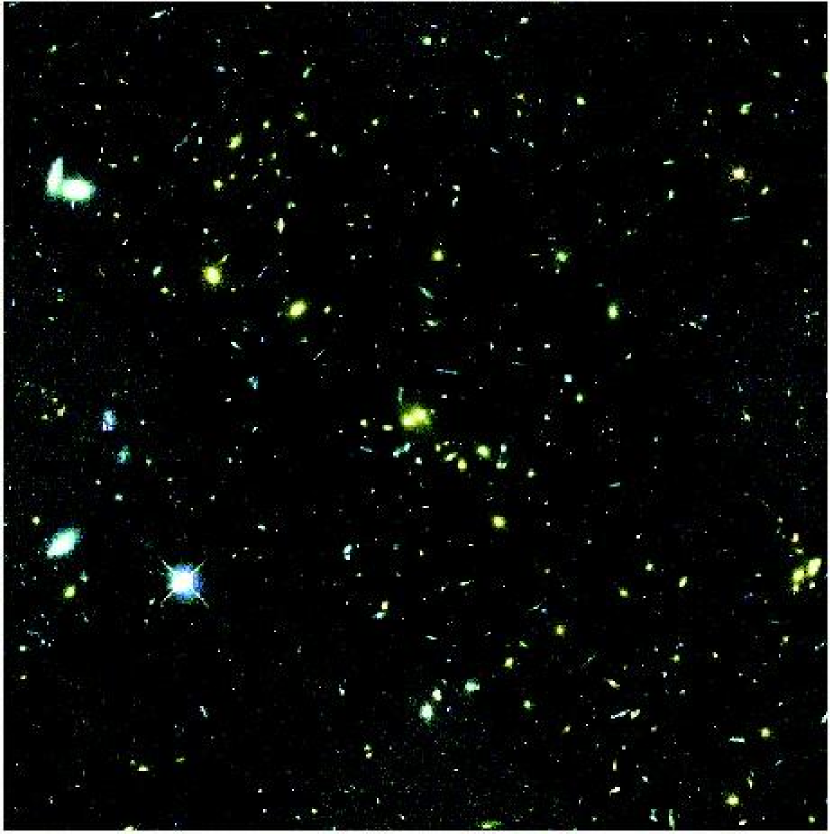
For RX J0152.7-1357, at , the ACS images were taken with the F625W, or , filter along with the and filters. Each of the three filters was observed for two orbits. As with RDCS J1252.9-2927, RX J0152.7-1357 was observed using a two-by-two mosaic pattern with deeper imaging in the cluster core. In Figure 3, we show the inner 2′ around the cluster center. This color image was made from the combination of all three filters.
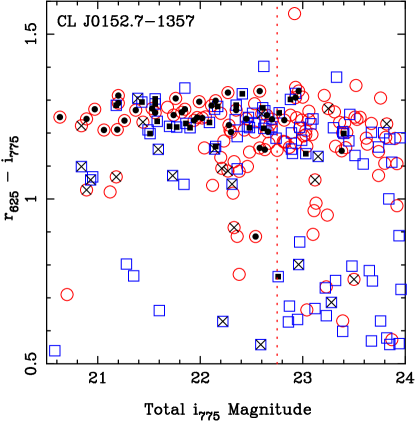
Our sample for RX J0152.7-1357 was constructed in as similar a manner as possible as our sample for RDCS J1252.9-2927. We used the SExtractor detection catalog to find galaxies. All objects with isophotal were fit with a Sérsic model with and visually typed (Postman et al., 2005). The model fits were determined in the filter as that filter corresponds closest to the rest-frame (see Figure 1), and the resulting apertures were used to measure the apparent colors. These results are shown in Figure 4.
For RX J0152.7-1357, we have obtained B, V, R, and I imaging data using the Keck telescope with the LRIS (Oke et al., 1995). We used SOFI (Moorwood et al., 1998) on the New Technology Telescope (Demarco et al., 2005a) to observe in the J and bands. Using FORS1 and FORS2 on the VLT, Demarco et al. (2005a) targeted galaxies with using the photometric redshift selection criterion of . 262 objects were observed resulting in 102 cluster members out of 227 measured redshifts.
As discussed in Postman et al. (2005), the classifications for RX J0152.7-1357 were done by three of us (MP, NC, and BH). The error rates are effectively the same as for RDCS J1252.9-2927 but we examined all galaxies down to , a fainter limit than our completeness for the redshift survey (discussed below).
In the field of RX J0152.7-1357, Demarco et al. (2005a) found a group at which has a significant number of early-type galaxies. These objects are, at best, slightly bluer than the cluster members (see Figure 4). The inclusion of these early-type galaxies in the photometric redshift selected sample reaffirms this. As such, we will not make a color selected sample for RX J0152.7-1357 but, rather, will only use the spectroscopic redshift sample. In the magnitude range of , the completeness of early-type galaxies ranges from 80% to 0%. The effective magnitude limit of the survey is as there is only one early-type galaxy fainter than that with a measured redshift. In the range , roughly 70% of the early-type galaxies with spectra are cluster members. In that same magnitude range, 60% of all early-type galaxies have spectra. This completeness is roughly the same as MS 1358+62 (Kelson et al., 2000c) against which we will compare our data. However, it should be realized that the photometric redshift selection imposes, in effect, a color selection as photometric redshifts are based on colors. Objects with stronger 4000 Å breaks are more likely to be selected for spectroscopic follow-up. For the remainder of the paper, we select all early-type galaxies in RX J0152.7-1357 with that are spectroscopically confirmed cluster members. This corresponds to .
2.3. MS 1358+62
For our sample in RDCS J1252.9-2927 and RX J0152.7-1357, we used filters that straddled the 4000 Å break for cluster members (see Figure 1). To measure the amount of apparent luminosity evolution, at a fixed size, requires that we measure the magnitudes and sizes in filters that match, as closely as possible, the same rest-frame band pass.
For a low redshift sample, we use the results from MS1358+62, at , from Kelson et al. (2000a, b, c) because of the thorough study of the surface brightness profiles in the rest-frame band. For MS 1358+62, Kelson et al. (2000a, b) conducted a spectroscopic survey to determine the velocity dispersion for a flux-limited sample of galaxies. The 52 objects were selected from the Fisher et al. (1998) study of MS 1358+62 to . The total sample of Kelson et al. (2000a, b) includes an additional three galaxies that are below the magnitude limit, but we used only those with . The selection for this sample was done regardless of morphology, so we include only galaxies that are classified earlier than 0, or the S0/a morphological class, according to the scheme of de Vaucouleurs et al. (1991).
We use the tabulated values of the observed rest-frame band surface brightnesses from Kelson et al. (2000a) along with the half-light radii in that paper. To convert the band surface brightness into a band surface brightness, we use the color from Kelson et al. (2000c) (taken from van Dokkum et al., 1998). The apertures used to define these colors are the half-light radii measured by fitting a de Vaucouleurs profile. In addition, the authors fit Sérsic models. There is a difference in their Sérsic models, however, when compared to the Sérsic models in this paper. In Kelson et al. (2000a) the authors allowed the Sérsic parameter to the range . We restricted over a smaller range, for our fits of RDCS J1252.9-2927 and RX J0152.7-1357. So, in all cases where Kelson et al. (2000a) finds , we replace the results of that fit, namely and , with corresponding results from Kelson et al. (2000a).
3. Measures of the size and magnitude
In order to measure the evolution in the Kormendy relation (Kormendy, 1977), we need robust measures of the half-light radius and surface brightness. Below we discuss two methods, one parametric and one non-parametric, we used to measure both the total magnitudes, from which we infer the surface brightness, and the half-light radii.
3.1. Model Fitting
To determine the colors of each of the galaxies, we used models to establish the appropriate size of the apertures. We fit a single Sérsic profile and allowed the parameter to vary over the range . We imposed this restriction because we found that, if we did not, a few objects would settle to very high numbers and, correspondingly large half-light radii. As the goal for the fits was to provide radii for measuring the colors of the red-sequence galaxies, large radii potentially could lead to systematic errors in the measurements.
The models were fitted using GALFIT (Peng et al., 2002), and yield the half-light radius and total magnitude of the model. The mean interior surface brightness within the half-light radius for that model can then be computed as (Jørgensen et al., 1995). The GALFIT output for the size is actually the semi-major axis of the best fitting elliptical model. We convert this radius into the effective radius, , where and are the semi-major and semi-minor axes respectively, when we discuss the half-light radius. As mentioned above, the fitting procedure constructs a model, convolves it with the point spread function, and then compares the resulting between the model and the data. Because the modeling process explicitly includes the point spread function, even for objects with sizes smaller than the point spread function, a full width at half maximum of 009, could be, in principle, reliably measured. However, errors in our point spread functions could cause systematic biases in our resulting half-light radii. Thus, we will exclude from our analysis objects with model half-light radii less than 01 for the rest of the paper.
One of the advantages of the GALFIT software is the ability to fit multiple component models to multiple galaxies simultaneously. For most of the galaxies, however, we masked out neighboring objects using the results of the SExtractor segmentation map, i. e., the map of pixels above the isophotal detection threshold. At minimum, each postage stamp was 50 by 50 pixels. The actual size was four times the square root of SExtractor’s isophotal area, the number of pixels one above the sky. For close galaxies, however, we had to fit models simultaneously. This was often the case for the luminous ellipticals in the cores of the clusters. In cases where a multiple galaxies had to be fit, we ensured that all of the pixels that would be in the individual stamps using the above recipe were included in the stamp containing multiple galaxies.
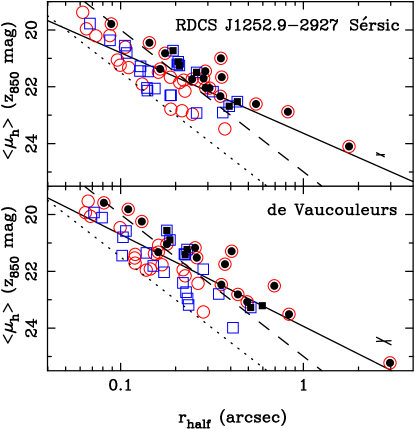
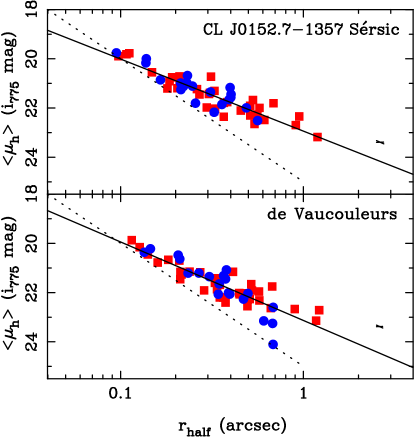
For every object in the color-selected and spectroscopic redshift sample of RDCS J1252.9-2927 and spectroscopic redshift sample of RX J0152.7-1357 we fit a pure de Vaucouleurs, or Sérsic profile, in addition to the already existing Sérsic model. We selected a fixed model, in addition to the Sérsic fits, for two reasons. First, the models have one less degree of freedom and therefore the potential to be more robust. Second, a de Vaucouleurs’ model has traditionally been used. Thus, we can compare with a broader range of results from the literature. We plot in Figures 5 and 6 the observed size-surface brightness relation using the results from pure de Vaucouleurs model fits. The relation appears linear but with a large scatter for RDCS J1252.9-2927. This scatter likely comes from a combination of observational errors, the inclusion of non-cluster members and systematic biases in addition to the intrinsic scatter in the relation. The size-surface brightness relation for RX J0152.7-1357 is much tighter. The biweight scale (Beers et al., 1990) of the scatter around the mean relation for RX J0152.7-1357 is for the de Vaucouleurs models and for the Sérsic models as opposed to for the de Vaucouleurs and for the Sérsic models for RDCS J1252.9-2927. We estimate the errors on the scatter using a jackknife process (Beers et al., 1990; Lupton, 1996).
In general, the error bars in Figures 5 and 6 are somewhat misleading. GALFIT reports the errors on the individual terms but it is well known that there are significant anti-correlations between the errors for the surface brightness and size (Hamabe & Kormendy, 1987; Jørgensen et al., 1993). Fortunately, these errors are almost parallel with the actual size-surface brightness relation, so objects will be scattered along the relation. We illustrate the expected anti-correlation in Figures 5 and 6. Both figures show a good deal of incompleteness for objects with sizes 01. For RX J0152.7-1357, this appears to be from the magnitude limit of the sample. However, for RDCS J1252.9-2927 we see a lack of objects with 01 and faint surface brightness even though such galaxies would be above our magnitude limit. We assume that this is a point spread function effect, as discussed above, and will not use galaxies with sizes 01 for our analysis.
3.2. Non-Parametric Magnitudes
The main problem with both of our current measurements of the size and total magnitude is that they depend on fitting models to the data. To complement these model magnitudes, we implemented the approach of Wirth et al. (1994) and Wirth (1996). This approach uses the Petrosian measure (Petrosian, 1976) to derive a model independent aperture. To review, the Petrosian computes the ratio of the surface brightness, at a particular radius, to the average surface brightness within that radius . This is the inverse of the function originally developed by Petrosian, but this version produces more tractable errors. Given for our galaxies, we need to decide on how to use it to derive an aperture. In the literature there are two choices. Wirth et al. (1994) and Wirth (1996) selected the aperture at which to measure the magnitude. This aperture contains 95% of the total light of an exponential disk and 87% of the light of a de Vaucouleurs profile (Wirth, 1996). The Sloan Digital Sky Survey (SDSS Strauss et al., 2002) use Petrosian derived apertures as well, specifically the aperture containing twice the diameter at which . This aperture contains 99% of the total light of an exponential disk but only 82% of the light of a de Vaucouleurs profile (Strauss et al., 2002). Given that early-type galaxies are dominated by de Vaucouleurs profiles, we select the approach of Wirth et al. (1994) instead of the approach of the SDSS outlined in Strauss et al. (2002).
When computing the distribution, we do not fit elliptical isophotes, as did Wirth (1996), but use circular apertures as is done in the SDSS (Strauss et al., 2002). Lubin & Sandage (2001a) show that circular apertures, when plotted against effective radii, reproduce the results of fitting elliptical isophotes. To compensate for the lower signal-to-noise at larger radii, instead of using the adaptive bin size approach of Wirth (1996), we choose to bin logarithmically in radius. Finally, to determine at what radius , we interpolate our distributions for each object using a low order polynomial.
This still leaves the question of correcting the aperture magnitude to a total magnitude. For each object, we measure the aperture where crosses 0.1 and then use that size to measure a total magnitude. This magnitude is computed by interpolating from the curve of growth of the galaxy. This magnitude is not, however, the total magnitude of the galaxy. As we do not want to use a model-dependent aperture correction, we add 0.1 mag to this magnitude. This would yield a magnitude 5% larger than the true total magnitude for an exponential disk and 3% less than the true total magnitude of a de Vaucouleurs profile. As most of our galaxies have Sérsic values of , this aperture correction should, in principle, yield around 97% to 99% of the total light for the galaxies. For the rest of this paper, we will refer to this as our Petrosian total magnitude.
3.3. Magnitude and Size Comparisons
With two different models used for fitting and an additional non-parametric total magnitude for each galaxy in each cluster, we can independently estimate the sizes of the errors on the sizes and total magnitudes. The statistical errors based on the expected variance in the photon flux for these galaxies are tiny, on the order of a hundredth of a mag. However, this ignores the errors caused by how well the model describes the data or the size of aperture. The formal errors in the fits are also small, with a per degree of freedom around for the residuals. However, it is straightforward to construct models that fits a given distribution well, in the sense that the models yield a small per degree of freedom, but actually deviates systematically from the model. A good illustration of this are galaxies which are well fit by models but, when fit with a Sérsic, yield a value of far from 4. Our non-parametric measure of the total magnitude checks for this.

In Figure 7, we show the distribution of the differences in magnitude for RX J0152.7-1357 as a function of the two different sizes. We show the difference between the total magnitude as measured by either the Sérsic model (squares) or the Petrosian total magnitude (circles) and the de Vaucouleurs model plotted as a function of the half-light radius from the de Vaucouleurs model in the bottom panel. In the top panel, we plot the difference between the de Vaucouleurs model magnitude and the Sérsic model magnitudes as squares while the solid dots are the difference between the Petrosian total magnitudes and the Sérsic model magnitudes but this time as a function of the Sérsic model half light radius. We find 0.11 mag of scatter between the Sérsic and the de Vaucouleurs magnitudes, 0.15 mag of scatter between the Petrosian and the de Vaucouleurs magnitudes and only 0.06 mag of scatter in the differences between the Sérsic and Petrosian magnitudes. In addition, there are systematic shifts, the de Vaucouleurs magnitudes are on average mag or mag brighter than the Sérsic or Petrosian magnitudes respectively. However, the Petrosian magnitudes are only dimmer by mag than the Sérsic magnitudes. We expect that the Petrosian total magnitudes should be somewhat smaller than the Sérsic magnitudes by 0.03 mag.

We show the same quantities for RDCS J1252.9-2927 in Figure 8. The scatter around the mean is larger, 0.17 mag for the Sérsic model magnitudes and 0.21 mag for the Petrosian magnitudes as compared with the de Vaucouleurs model magnitudes. As before, there are small systematic shifts. We find that the Sérsic magnitudes are mag dimmer than the de Vaucouleurs magnitudes, while the Petrosian magnitudes are mag dimmer. The scatter between the Sérsic magnitude and the Petrosian magnitude is smaller, 0.16 mag, and the systematic shift is also smaller, mag.
In Figures 7 and 8 there is an apparent correlation between the plotted differences and some of the measured sizes. We examine the data using a Spearman Rank Correlation test. This test yields a parameter, referred hereafter as , which is the estimate of the degree of the correlation and can range . Examining the data for RDCS J1252.9-2927, we find that for the correlation between the de Vaucouleurs magnitudes minus the Sérsic model magnitudes as a function of the de Vaucouleurs half-light radii. The expected error on this measurement of the correlation, assuming that there is no true correlation for our sample is , yielding 3.3 difference from 0 or no correlation. There is less of a correlation with Petrosian magnitude, and we find no correlation, between the difference in the Sérsic and the Petrosian magnitudes as a function of the Sérsic half-light radii. These positive correlations mean that the difference in the Sérsic model and the de Vaucouleurs model magnitudes increases with large size, or the Sérsic model magnitudes are fainter than the de Vaucouleurs model magnitudes as we measure larger sizes. This correlation exists regardless of whether we use the Sérsic model or de Vaucouleurs model half-light radii. These correlations do not appear for RX J0152.7-1357, however. For this cluster we find correlations with or smaller.
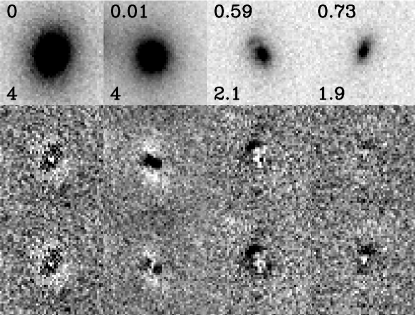
Most of the apparent correlation in Figures 7 8 comes from a handful of galaxies. In each case, the galaxy has a large de Vaucouleurs model magnitude when compared with the Sérsic or Petrosian magnitude. We examined each of these in detail. In every case where a galaxy lies more than three standard deviations from the mean of Figure 8, the best fitting Sérsic model has a low, Sérsic index and smaller half-light radius. Therefore, the de Vaucouleurs model is not a good fit to the data. In Figure 9, we show two examples of this, along with two examples of models where the Sérsic and de Vaucouleurs models are in good agreement. In Figure 10, we plot the distribution of Sérsic indices for the three data sets, RDCS J1252.9-2927, RX J0152.7-1357, and MS 1358+62. In each case, the galaxies are identified, by eye, as early-type galaxies. It appears that the higher redshift clusters have a broader range of Sérsic indices than MS 1358+62. This will be further discussed in Postman et al. (2005). Nevertheless, the de Vaucouleurs models appear to be a bad fit to a number of galaxies, which should explain the scatter in Figure 8.

When comparing the Petrosian magnitudes with the de Vaucouleurs model magnitudes for RDCS J1252.9-2927, there are four strong outliers. Each of these outliers is caused by neighboring galaxies that contaminate the Petrosian total magnitude. This is because our measure of the Petrosian total magnitude assumes nothing about the underlying surface brightness profile. We simply use the SExtractor segmentation maps to mask out bright pixels. We do not attempt to compute the contribution to the galaxy’s flux by the surrounding objects. Thus, in crowded areas where a larger number of pixels are contaminated by luminous or extended objects such as the brightest cluster members, our Petrosian estimates are significantly overestimated and so appear as large negative values in Figures 7 and 8.
To compliment our Petrosian, or non-parametric total magnitudes, we can estimate a half-light radius by determining the radius where the curve of growth contains half of the total light from the galaxy. However, unless we make an attempt to remove the effect of the point spread function, we will find a bias towards larger sizes as the galaxies become intrinsically smaller. We computed these half-light radii and find that, on average for RDCS J1252.9-2927, the Petrosian sizes are 2% larger than the Sérsic model sizes and 5% larger than the de Vaucouleurs model sizes for objects with model sizes of at least 015. This size bias grows markedly at smaller model radii, as expected. We find no statistically significant difference between the de Vaucouleurs model sizes and the Sérsic model sizes. For RX J0152.7-1357, we find very similar numbers. The scatter in the size as determined by the de Vaucouleurs model as compared with the Sérsic model is slightly larger because of the handful of cases where the best fitting Sérsic parameter is low, which causes large magnitude discrepancies as well. Overall, the agreement between the Petrosian estimated half-light radii and the model radii are good. However, because of the bias towards larger sizes in our Petrosian half-light radii, we rely on the model half-light radii for the rest of this paper.
Overall, it is encouraging that our different magnitude and size measurements yield a small scatter and little or no systematic offsets. Nonetheless, it is prudent not to mix the various measurements because of the small correlations seen above. The Petrosian magnitudes, which yield numbers close to the Sérsic model magnitudes, could potentially be used in conjunction with the Sérsic half-light radii. However, for the rest of the paper, we will measure evolution using the sizes and surface brightnesses determined by the model fits and we will only compare Sérsic model fits with other Sérsic model fits, not with pure de Vaucouleurs models.
3.4. Rest-frame Magnitudes
To measure the amount of evolution, we need to compare the surface brightnesses in the same rest-frame pass band. Most measurements of the evolution of the FP are given in terms of the rest-frame Johnson B, or mass-to-light ratio. We used the templates of Benítez et al. (2004), which are modified versions of the templates from Coleman et al. (1980), to compute the value as a function of an observed filter and a color. For RDCS J1252.9-2927, we computed as a function of while for RX J0152.7-1357 we computed as a function of . For a given galaxy in RDCS J1252.9-2927 or RX J0152.7-1357, we then interpolate between the colors of the templates from Benítez et al. (2004) to then compute the or color. Why we chose these particular filter combinations is illustrated in Figure 1, namely that the and filters match the filter at the redshifts of RDCS J1252.9-2927 and RX J0152.7-1357 respectively. The color was selected to span, roughly, the color in the rest frame of the galaxy. This process is very similar to what was employed by Holden et al. (2004). In that paper, the authors found that when the filter was spanned by the observed colors, the error on the magnitude transformation was on the order of 2%. In a case like RDCS J1252.9-2927, however, the error was higher, at around 5%.
4. Apparent Luminosity Evolution
4.1. Measuring the offset at a fixed size
We would like to investigate how much apparent evolution there is in the size-surface brightness relation. First, we shall examine if the zero-point in this relation changes with redshift. The simplest way to measure this is to fit a linear relation to the size-surface brightness relation for the low redshift cluster, and then compute the constant required to minimize the deviation around the same slope for the higher redshift cluster.
To determine the slope of the size-surface brightness relation at low redshift, we fit all of the data in MS 1358+62. We then transform the MS 1358+62 data to the or band in the manner described in §3.4, and rescale the sizes as appropriate for the cluster, either RDCS J1252.9-2927 or RX J0152.7-1357. We limit both the cluster and MS 1358+62 to the same magnitude. We then apply a series of cuts in the half-light radius, starting at a size of 025 and working down to 01, below which the effects of the point spread function will become important. At each size, we compute the zero-point in the size-surface brightness relation required to minimize the scatter around a line defined by the slope as measured for the whole of the MS 1358+62 sample. We compute this zero-point for both the trimmed MS 1358+62 and cluster samples. We then change the magnitude limit of the sample of MS 1358+62 by the currently measured amount of evolution. We trim the data at the new magnitude limit and continue iterating until we converge. To compute the zero-point for both distributions, we simply compute the biweight center for the deviations between the average surface brightnesses and the slope times the half-light radii.

We find mag of evolution is required to match the size-surface brightness relation of MS 1358+62 when comparing the de Vaucouleurs model results for galaxies with 015 and in RDCS J1252.9-2927. In rest-frame , corresponds to at and at after assuming the FP evolution of van Dokkum & Stanford (2003). We plot, in Figure 11, the data from MS 1358+62 as open squares, both for the pure de Vaucouleurs models. The results for RDCS J1252.9-2927 are represented by solid dots. The solid line represents the fit to the whole data for MS 1358+62. The dotted line is the same but shifted by mag. This shift was calculated by minimizing the scatter around a line with the slope specified by the whole sample. Repeating the process but using the Sérsic model profiles, we find mag of evolution (see Figure 12). We note here, that, as we discussed above, Kelson et al. (2000a) allows a larger range of the parameter in their fits. All galaxies with in Sérsic models in Kelson et al. (2000a) were replaced by the corresponding de Vaucouleurs model.

We make the same computation for RX J0152.7-1357 and find mag of band evolution for 015, the size limit for the smallest galaxies in MS 1358+62, and mag of evolution in the band for the Sérsic models. If we restrict ourselves to only those galaxies in RDCS J1252.9-2927 with redshift information and with , we find mag (de Vaucouleurs model) and (Sérsic model) mag of band evolution for 015.
We summarize the results of these fits in Table 1. In that table, we also show the results for a selection of cutoff radii and for each of the samples of RDCS J1252.9-2927. We selected a number of half-light radii thresholds. We decided to not examine galaxies with 010 as they are close in size to the full-width at half-maximum of the point spread function and the samples appear incomplete at those sizes, see §3.1. However, there are few galaxies in the sample of MS 1358+62 that have 015, so we selected that for our practical limit. We included a cutoff of 020 along with 010 to illustrate that our results are insensitive to the exact threshold selected.
The error we quote is the error on the mean shift between the low redshift size-surface brightness relation and the high redshift relation. We assume no error on the slope measurement, simply taking the scatter around the mean relation and dividing it by the square root of the number of galaxies in our high redshift sample. This raises the question of how our particular choice of the slope of the size-surface brightness relation affects our results. It appears, when looking at Figures 11 and 12, that the slope of the size-surface brightness relation is different for the different samples. We compare the data from MS 1358+62 and RDCS J1252.9-2927 using the slope of the best fitting relation for RDCS J1252.9-2927 instead the slope of the relation for MS 1358+62. We find almost the same results with small changes, mag, in the measured evolution. For RX J0152.7-1357, our changes in measured evolution are larger, on the order of mag to, at most, mag. This provides an additional source of uncertainty which we will add in quadrature.
4.2. Comparison with the Fundamental Plane
van Dokkum & Stanford (2003) measured the velocity dispersions for three
galaxies in
CL 0848+4453, a low mass cluster of galaxies at
. Holden et al. (2005) measured velocity dispersions for four
galaxies in RDCS J1252.9-2927, which, when combined with van Dokkum & Stanford (2003),
yields a sample of seven objects with .
Using those values along with sizes and surface brightness from HST
imaging, the authors measured the offset in the FP from to the
redshift of the cluster. The evolution corresponds to a change in the
mass-to-light ratio (M/L) with redshift of in the rest-frame
filter, or mag of band evolution
at a fixed mass. For RDCS J1252.9-2927, this should correspond to
mag of evolution in the rest-frame band. To compare our
relative measurements between clusters at different redshifts with
those made using the FP, we need to compare our measured evolution
with the Coma cluster, the baseline for van Dokkum & Stanford (2003)
and Holden et al. (2005).
To measure how much evolution occurs between MS 1358+62 and Coma, we implemented the same procedure as we used for comparing RDCS J1252.9-2927 and RX J0152.7-1357 with MS 1358+62. For the data for the Coma cluster, we use the half-light radii and surface brightnesses, listed in Table A 7 of Jørgensen et al. (1996). In Kelson et al. (2000a), the authors compare the techniques used to measure the half-light radii and surface brightnesses in Jørgensen et al. (1996) with the two-dimensional fitting techniques they used and find no significant offsets. Thus, we compare the Coma radii and surface brightnesses directly with the values tabulated in Kelson et al. (2000c). We measure a shift of mag in the rest-frame band between Coma and MS 1358+62. These measurements were done with the whole sample of Coma and MS 1358+62, as both are magnitude limited, redshift selected samples.
The amount of evolution expected between and is mag in rest-frame using the best fitting relation from van Dokkum & Stanford (2003), in good agreement with the mag expected from van Dokkum & Franx (1996) and the mag from Kelson et al. (1997). Our result of mag is in excellent agreement but with smaller statistical error bars. The systematic errors are the same as the FP, see Kelson et al. (2000a).
We add the measured evolution between Coma and MS 1358+62 to the measured evolution we find for RDCS J1252.9-2927 and RX J0152.7-1357. We plot both in Figure 13 along with the FP results from van Dokkum & Stanford (2003) and Holden et al. (2005). We fit a line to the data for RX J0152.7-1357 and for the color-selected sample of RDCS J1252.9-2927 and find mag of evolution, very close to the mag found with the FP. We find mag of evolution if we use the redshift-selected sample of RDCS J1252.9-2927, a result not statistically different from the FP because of the much error estimate.
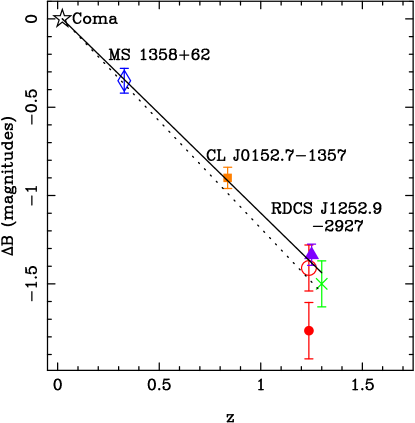
Overall, our agreement with the measurements from the FP are good, with the caveat that it is clear that sample selection plays a critical role. Our first sample of early-type galaxies in RDCS J1252.9-2927 was constructed by finding all galaxies with the correct morphologies that also fall within the color-magnitude sequence of RDCS J1252.9-2927. Restricting our sample to galaxies with sizes of 015, we find a result in almost perfect agreement with restuls from the Fundamental Plane (van Dokkum & Stanford, 2003; Holden et al., 2005), regardless of whether we use Sérsic or de Vaucouleurs models. If, however, we restrict ourselves to those galaxies identified only by redshift, we find more evolution at the highest redshifts. The redshift selection was made using a magnitude-limited sample, with some color selection. As shown in Figures 2 and 5, almost all early-type galaxies with are included. Therefore, it is puzzling why such a sample would appear to show so much more evolution.
4.3. Scatter in the Size-Surface Brightness Relation

In Figure 14, we plot the the histogram of the scatter around the size-surface brightness relation. This is the difference, in magnitudes, between the measured surface brightnesses and those predicted by the size-surface brightness relation. We plot the residuals for RDCS J1252.9-2927 as compared with those from MS 1358+62, using the de Vaucouleurs model sizes and surface brightnesses. The solid line represents the results for RDCS J1252.9-2927, while the dotted line is scatter for the comparison sample of MS 1358+62. We plot the histogram containing only confirmed cluster members in the top panel while the bottom panel shows all color selected galaxies. In both panels, the histograms are normalized to one. For this figure, we plot all galaxies with projected sizes of 15 at . The magnitudes for the galaxies in MS 1358+62 have been brightened by the measured mag of evolution in the band for the bottom panel and mag in the top panel.
Examining Figure 5 again, however, we see that the objects below the mean relation have, on average, a larger error in both the size and average surface brightness than those above the mean relation. Thus, a low tail towards large deviations is expected. At brighter magnitudes there are three galaxies brighter than expected based on the distribution of MS 1358+62. The observed scatter is, as mentioned before, mag around a fixed size. Given that the errors in our total magnitude measurements are, based on the comparisons between the de Vaucouleurs model magnitudes and the Petrosian total magnitudes, around mag, most of the scatter must be intrinsic or systematic. For RX J0152.7-1357, there are 55 early-type galaxies cluster members that meet our magnitude and size criteria. In Figure 15, we plot the distribution of the two sets of galaxies, and note that the scatter is mag. For comparison, we find in the sample from MS 1358+62a scatter of mag.
We calculate for each of our scatter measurements an error based on the jackknife of the data as recommended by Beers et al. (1990). It seems that the scatter measurements are statistically very different. For example, the difference between the scatter in RX J0152.7-1357 and in MS 1358+62 is mag, a 2.5 standard deviation difference. If we make the assumption that scatter in the size-surface brightness relation comes from a Gaussian parent population, we can use the F-ratio test to compare the variances of two different scatter measurements. When we compare the scatter for RDCS J1252.9-2927, mag, with that of MS 1358+62, mag, we find that, despite the mag difference, the odds of the two populations being drawn from the same parent population is around 2%, not a statistically significant difference. We find a better agreement when comparing RX J0152.7-1357 with MS 1358+62, a 15% probability that variance measurements of the two samples are drawn from the same distribution, despite the apparent 2.5 standard deviation difference.
In §2.1, we discussed the accuracy of our morphological classifications. At fainter magnitudes, we found that our scatter in classification was higher, as measured by the disagreement amongst the classifiers. The inclusion of later-type galaxies could cause a bias in the estimate of the evolution. We measured the evolution using only those galaxies with unanimous agreement amongst the four classifiers and found a larger result, mag for the color selected sample. This agrees well with the mag found for the redshift selected sample. The inclusion of late-type galaxies should bias towards more evolution, as spiral structure and large disks usually hold star formation, yet the inclusion of the more uncertain classifications actually lessens the amount of evolution. However, the lower surface brightness galaxies are also the galaxies with more uncertainty in their classification. Thus, by removing the galaxies with higher uncertainy in their classification, we naturally remove the lower surface brightness galaxies. The scatter for the color-selected sample, with uncertain objects removed, is mag, very close to mag we find for the spectroscopically selected sample. Thus, we raise the possiblity that the difference in the two samples could come from classification errors as the majority of uncertain classifications are in the mag range, and below the cutoff for the spectroscopically selected sample. Removing these less certain classifications lower the scatter and raises the amount of evolution measured in the color-selected sample. However, these objects have, on average, a lower surface brightness, 0.35 mag in , than the objects with unanimous classifications. These lower surface brightnesses could also explain why the classifications are uncertain.

5. Discussion
We observe, using the size-surface brightness relation, mag of luminosity evolution from to . If we restrict our highest redshift sample to only those galaxies with spectroscopic redshifts, instead of the large sample of galaxies with red colors, we find mag of evolution, which is in statistical agreement with our other result. If we use only the color selection for RDCS J1252.9-2927, we find that both of the measurements agree well with the FP results at the same redshifts (van Dokkum et al., 1998; van Dokkum & Stanford, 2003; Holden et al., 2005) and, thus, with the overall trend in luminosity evolution found from other size-surface brightness studies (Schade et al., 1997, 1999; Lubin & Sandage, 2001c). The overall agreement points towards the conclusion that the majority of massive elliptical galaxies at these redshifts are passively evolving, in agreement with their color evolution.
Given that we find slow luminosity evolution for the majority of cluster early-type galaxies in our samples, this is another indication that the luminosity-weighted redshift of formation is high for these objects. van Dokkum & Stanford (2003) finds , though for a different cosmology, using the FP, while Holden et al. (2005) finds for certain assumptions about early-type galaxy evolution. As the evolution found in that paper agrees with the evolution in offset of the size-surface brightness relation, we would find a similar result. This epoch of formation is also in agreement with Blakeslee et al. (2003b) from the colors of galaxies in RDCS J1252.9-2927. In general, the large scatter on the size-surface brightness relation prevents us from making significantly more accurate measurements of . Since we selected galaxies for red colors in RDCS J1252.9-2927, we could very well be missing an important part of the cluster early-type population, namely those galaxies that will become red early-types but are bluer than our selection criteria at the epoch of the observations. This would bias our results to higher redshifts.
The redshift selected sample of RDCS J1252.9-2927, however, shows much more evolution, mag as compared with the color-selected sample. It is possible that this is a selection effect. Namely, it is easier to measure redshifts for higher surface brightnesses objects. We attempted to mitigate this by trimming the redshift-selected sample at , where the redshift-selected sample is almost complete, containing 17 out of 20 early-type galaxies with 015, regardless of color. One possible explanation for this result is the scatter around the mean size-surface brightness relation.
We observe that the apparent scatter for RDCS J1252.9-2927 around the size-surface brightness relation is larger than for RX J0152.7-1357. This result is not statistically siginificant though an increase in the scatter would be expected at higher redshifts. There are a couple of lines of evidence that, at , there are elliptical galaxies that show evidence of recent star formation. Such objects would show a smaller than average . Both van Dokkum & Stanford (2003) and Tran et al. (2003) find galaxies morphologically classified as early-type galaxies but with strong Balmer absorption lines indicating recent starbursts. The example galaxy in the Fundamental Plane sample of van Dokkum & Stanford (2003) has a much lower than expected value, a factor of 13 lower than the massive galaxies in that sample, and Holden et al. (2005) finds a large scatter in the value for a purely luminosity selected sample, much larger than the scatter for lower redshift clusters such as Coma or MS 1358+62. The inclusion of a handful of such galaxies in our sample would increase the scatter but disentangling them requires spectra or good information. Spectroscopic evidence for recent bursts of star-formation in RDCS J1252.9-2927, which could explain both the larger scatter and the larger apparent evolution when using only the spectroscopically-selected sample, will be discussed in a future paper (Rosati et al., 2005).
6. Summary
We have investigated the size-surface brightness relation for two clusters of galaxies, RDCS J1252.9-2927 at and RX J0152.7-1357 at . For each cluster, we identified, by eye, a sample of early-type galaxies across a broad range in color and in magnitude (Postman et al., 2005). Using our ACS imaging, which covers the rest-frame , we created a magnitude limited sample for each cluster. The magnitude limits correspond to approximately for RDCS J1252.9-2927 and for RX J0152.7-1357. For RX J0152.7-1357, we selected galaxies based on the 102 spectroscopic redshifts (Demarco, 2003). RDCS J1252.9-2927 has 36 spectroscopic members (Demarco, 2003; Rosati et al., 2004, 2005) and we expanded the sample for that cluster using a color selection. Our color criteria for RDCS J1252.9-2927 utilizes the color-magnitude relation and scatter from Blakeslee et al. (2003b), including all galaxies within two standard deviations of the mean relation. In each case, we chose the observed magnitude limit in the filter that corresponds most closely to the rest-frame band.
We fit both Sérsic and de Vaucouleurs models to each galaxy in our two cluster samples. These models provide total magnitudes and half-light radii with the point spread function broadening removed. We converted the total magnitudes to the average surface brightness within the half-light radius. In addition to the model total magnitudes, we implemented a third total magnitude measurement. We used the Petrosian magnitudes as implemented in Wirth (1996) and found excellent agreement between these non-parametric measurements and the Sérsic model magnitudes. The disagreement with the de Vaucouleurs models in general involved a small systematic of mag depending on the cluster. In addition, we found that the difference between the de Vaucouleurs model magnitudes and either the Sérsic or Petrosian magnitudes correlated with the model sizes for one of the two clusters. In general, we find that our overall trends are robust, regardless of which size and magnitude we used for determining the surface brightness as long as we compare a given cluster measurement with a measurement made using the same model in a different cluster.
We measured the amount of rest-frame magnitude evolution by computing the shift in apparent surface brightness at a fixed size. We compare the clusters in this paper to the results from MS 1358+62 in Kelson et al. (2000a), which contains both Sérsic and de Vaucouleurs average surface brightnesses and half-light radii. For MS 1358+62, we compute the amount of evolution required to match the size-surface brightness relation between MS 1358+62 and either RDCS J1252.9-2927 or RX J0152.7-1357, with the data trimmed at a fixed size and magnitude limit. We apply this correction to the data in MS 1358+62, recompute which galaxies would fall above our magnitude limit, and repeat until we converge. We also apply this to MS 1358+62 and the band Coma cluster data of Jørgensen et al. (1996). For that, we measure mag of evolution, in excellent agreement with the Fundamental Plane, or FP, measurements (van Dokkum & Franx, 1996; Kelson et al., 1997, 2000c). The rest of the evolution measurements, summarized in Table 1, show results consistent with the FP in most cases. We find that the average surface brightness at a fixed sized changes with redshift as , very close to the found with the FP. Only when we examine the subset of galaxies in RDCS J1252.9-2927 selected by spectroscopic membership do we find a deviation.
The overall trend in the luminosity evolution that we find agrees with this. At the redshift of RDCS J1252.9-2927, we are likely within a Gyrs of observing epoch when most of the stars formed in cluster early-type galaxies.
We would like to thank Greg Wirth for advice on measuring Petrosian magnitudes and for supplying copy of his software package. BH would also like to thank S. Adam Stanford and Daniel Kelson for useful discussions. ACS was developed under NASA contract NAS5-32865, this research was supported by NASA grant NAG5-7697. We are grateful to K. Anderson, J. McCann, S. Busching, A. Framarini, S. Barkhouser, and T. Allen for their invaluable contributions to the ACS project at JHU.
References
- Appenzeller & Rupprecht (1992) Appenzeller, I. & Rupprecht, G. 1992, ESO Messenger, 67, 18
- Aragón-Salamanca et al. (1993) Aragón-Salamanca, A., Ellis, R. S., Couch, W. J., & Carter, D. 1993, MNRAS, 262, 764
- Beers et al. (1990) Beers, T. C., Flynn, K., & Gebhardt, K. 1990, AJ, 100, 32
- Benítez et al. (2004) Benítez, N., Ford, H., Bouwens, R., Menanteau, F., Blakeslee, J., Gronwall, C., Illingworth, G., Meurer, G., Broadhurst, T. J., Clampin, M., Franx, M., Hartig, G. F., Magee, D., Sirianni, M., Ardila, D. R., Bartko, F., Brown, R. A., Burrows, C. J., Cheng, E. S., Cross, N. J. G., Feldman, P. D., Golimowski, D. A., Infante, L., Kimble, R. A., Krist, J. E., Lesser, M. P., Levay, Z., Martel, A. R., Miley, G. K., Postman, M., Rosati, P., Sparks, W. B., Tran, H. D., Tsvetanov, Z. I., White, R. L., & Zheng, W. 2004, ApJS, 150, 1
- Bernardi et al. (2003) Bernardi, M., Sheth, R. K., Annis, J., Burles, S., Eisenstein, D. J., Finkbeiner, D. P., Hogg, D. W., Lupton, R. H., Schlegel, D. J., SubbaRao, M., Bahcall, N. A., Blakeslee, J. P., Brinkmann, J., Castander, F. J., Connolly, A. J., Csabai, I., Doi, M., Fukugita, M., Frieman, J., Heckman, T., Hennessy, G. S., Ivezić, Ž., Knapp, G. R., Lamb, D. Q., McKay, T., Munn, J. A., Nichol, R., Okamura, S., Schneider, D. P., Thakar, A. R., & York, D. G. 2003, AJ, 125, 1866
- Blakeslee et al. (2003a) Blakeslee, J. P., Anderson, K. R., Meurer, G. R., Benítez, N., & Magee, D. 2003a, in ASP Conf. Ser. 295: Astronomical Data Analysis Software and Systems XII, 257
- Blakeslee et al. (2003b) Blakeslee, J. P., Franx, M., Postman, M., Rosati, P., Holden, B. P., Illingworth, G. D., Ford, H. C., Cross, N. J. G., Gronwall, C., Benítez, N., Bouwens, R. J., Broadhurst, T. J., Clampin, M., Demarco, R., Golimowski, D. A., Hartig, G. F., Infante, L., Martel, A. R., Miley, G. K., Menanteau, F., Meurer, G. R., Sirianni, M., & White, R. L. 2003b, ApJ, 596, L143
- Bower et al. (1992) Bower, R. G., Lucey, J. R., & Ellis, R. S. 1992, MNRAS, 254, 601
- Coleman et al. (1980) Coleman, G. D., Wu, C.-C., & Weedman, D. W. 1980, ApJS, 43, 393
- de Vaucouleurs et al. (1991) de Vaucouleurs, G., de Vaucouleurs, A., Corwin, H. G., Buta, R. J., Paturel, G., & Fouque, P. 1991, Third Reference Catalogue of Bright Galaxies (Volume 1-3, XII, 2069 pp. 7 figs.. Springer-Verlag Berlin Heidelberg New York)
- Della Ceca et al. (2000) Della Ceca, R., Scaramella, R., Gioia, I., Rosati, P., Fiore, F., & Squires, G. 2000, A&A, 353, 498
- Demarco (2003) Demarco, R. 2003, Ph.D. Thesis
- Demarco et al. (2005a) Demarco, R., Rosati, P., Lidman, C., Homeier, N. L., Scannapieco, E., Benitez, N., Mainieri, V., Nonino, M., Girardi, M., Stanford, S. A., Tozzi, P., Borgani, S., Silk, J., Squires, G., & Broadhurst, T. J. 2005a, A&A, in press (astro-ph/0411386)
- Djorgovski & Davis (1987) Djorgovski, S. & Davis, M. 1987, ApJ, 313, 59
- Ellis et al. (1997) Ellis, R. S., Smail, I., Dressler, A., Couch, W. J., Oemler, A. J., Butcher, H., & Sharples, R. M. 1997, ApJ, 483, 582
- Faber & Jackson (1976) Faber, S. M. & Jackson, R. E. 1976, ApJ, 204, 668
- Fabricant et al. (2000) Fabricant, D., Franx, M., & van Dokkum, P. 2000, ApJ, 539, 577
- Fisher et al. (1998) Fisher, D., Fabricant, D., Franx, M., & van Dokkum, P. 1998, ApJ, 498, 195
- Hamabe & Kormendy (1987) Hamabe, M. & Kormendy, J. 1987, in IAU Symp. 127: Structure and Dynamics of Elliptical Galaxies, 379
- Holden et al. (2004) Holden, B. P., Stanford, S. A., Eisenhardt, P. R., & Dickinson, M. 2004, AJ, 127, 2484
- Holden et al. (2005) Holden, B. P., van der Wel, A., Franx, M., Illingworth, G. D., Blakeslee, J. P., van Dokkum, P. G., Ford, H., Magee, D., Rix, H.-W., & Rosati, P. 2005, ApJ, astro
- Jørgensen et al. (1993) Jørgensen, I., Franx, M., & Kjaergaard, P. 1993, ApJ, 411, 34
- Jørgensen et al. (1995) —. 1995, MNRAS, 273, 1097
- Jørgensen et al. (1996) —. 1996, MNRAS, 280, 167
- Kelson et al. (2000a) Kelson, D. D., Illingworth, G. D., van Dokkum, P. G., & Franx, M. 2000a, ApJ, 531, 137
- Kelson et al. (2000b) —. 2000b, ApJ, 531, 159
- Kelson et al. (2000c) —. 2000c, ApJ, 531, 184
- Kelson et al. (1997) Kelson, D. D., van Dokkum, P. G., Franx, M., Illingworth, G. D., & Fabricant, D. 1997, ApJ, 478, L13
- Kormendy (1977) Kormendy, J. 1977, ApJ, 218, 333
- Lidman et al. (2004) Lidman, C., Rosati, P., Demarco, R., Nonino, M., Mainieri, V., Stanford, S. A., & Toft, S. 2004, A&A, 416, 829
- Lubin & Sandage (2001a) Lubin, L. M. & Sandage, A. 2001a, AJ, 121, 2289
- Lubin & Sandage (2001b) —. 2001b, AJ, 122, 1071
- Lubin & Sandage (2001c) —. 2001c, AJ, 122, 1084
- Lupton (1996) Lupton, R. H. 1996, Statistics in Theory and Practice (Princeton: Princeton Univ. Press)
- Moorwood et al. (1998) Moorwood, A., Cuby, J.-G., & Lidman, C. 1998, ESO Messenger, 91, 9
- Norberg et al. (2002) Norberg, P., Cole, S., Baugh, C. M., Frenk, C. S., Baldry, I., Bland-Hawthorn, J., Bridges, T., Cannon, R., Colless, M., Collins, C., Couch, W., Cross, N. J. G., Dalton, G., De Propris, R., Driver, S. P., Efstathiou, G., Ellis, R. S., Glazebrook, K., Jackson, C., Lahav, O., Lewis, I., Lumsden, S., Maddox, S., Madgwick, D., Peacock, J. A., Peterson, B. A., Sutherland, W., & Taylor, K. 2002, MNRAS, 336, 907
- Oke (1990) Oke, J. B. 1990, AJ, 99, 1621
- Oke et al. (1995) Oke, J. B., Cohen, J. G., Carr, M., Cromer, J., Dingizian, A., Harris, F. H., Labrecque, S., Lucinio, R., Schaal, W., Epps, H., & Miller, J. 1995, PASP, 107, 375
- Peng et al. (2002) Peng, C. Y., Ho, L. C., Impey, C. D., & Rix, H. 2002, AJ, 124, 266
- Petrosian (1976) Petrosian, V. 1976, ApJ, 209, L1
- Postman et al. (2005) Postman, M. Franx, M., Cross, N., Holden, B., Ford, H., Illingworth, G., Goto, T., Demarco, R., Rosati, P., Blakeslee, J. P., Tran, K.-V., Benítez, T., Clampin, M., Hartig, G. F., Homeier, N., Ardila, D. R., Bartko, F., Bouwens, R., Bradley, L. D., Broadhurst, T. J., Brown, R. A., Burrows, C. J., Cheng, E. S., Feldman, P. D., Golimowski, D. A., Gronwall, C., Infante, L., Kimble, R. A., Krist, J. E., Lesser, M. P., Martel, A. R., Mei, S., Menanteau, F., Meurer, G. R., Miley, G. K., Motta, V., Sirianni, M., Sparks, W. B., Tran, H. D. Tsvetanov, Z. I., White, R. I., & Zheng, W. 2005, ApJ, accepted (astro-ph/0501224)
- Rosati et al. (2004) Rosati, P., Tozzi, P., Ettori, S., Mainieri, V., Demarco, R., Stanford, S. A., Lidman, C., Nonino, M., Borgani, S., Della Ceca, R., Eisenhardt, P., Holden, B. P., & Norman, C. 2004, AJ, 127, 230
- Rosati et al. (2005) —. 2005, AJ, in prep
- Sandage & Lubin (2001) Sandage, A. & Lubin, L. M. 2001, AJ, 121, 2271
- Sandage & Perelmuter (1990a) Sandage, A. & Perelmuter, J. 1990a, ApJ, 350, 481
- Sandage & Perelmuter (1990b) —. 1990b, ApJ, 361, 1
- Sandage & Perelmuter (1991) —. 1991, ApJ, 370, 455
- Schade et al. (1997) Schade, D., Barrientos, L. F., & Lopez-Cruz, O. 1997, ApJ, 477, L17
- Schade et al. (1996) Schade, D., Carlberg, R. G., Yee, H. K. C., Lopez-Cruz, O., & Ellingson, E. 1996, ApJ, 464, L63
- Schade et al. (1999) Schade, D., Lilly, S. J., Crampton, D., Ellis, R. S., Le Fèvre, O., Hammer, F., Brinchmann, J., Abraham, R., Colless, M., Glazebrook, K., Tresse, L., & Broadhurst, T. 1999, ApJ, 525, 31
- Sérsic (1968) Sérsic, J. L. 1968, Atlas de Galaxíes de Australes (Cǿrdoba, Argentina: Observatorio Astronomico, 1968)
- Stanford et al. (1998) Stanford, S. A., Eisenhardt, P. R., & Dickinson, M. 1998, ApJ, 492, 461
- Strauss et al. (2002) Strauss, M. A., Weinberg, D. H., Lupton, R. H., Narayanan, V. K., Annis, J., Bernardi, M., Blanton, M., Burles, S., Connolly, A. J., Dalcanton, J., Doi, M., Eisenstein, D., Frieman, J. A., Fukugita, M., Gunn, J. E., Ivezić, Ž., Kent, S., Kim, R. S. J., Knapp, G. R., Kron, R. G., Munn, J. A., Newberg, H. J., Nichol, R. C., Okamura, S., Quinn, T. R., Richmond, M. W., Schlegel, D. J., Shimasaku, K., SubbaRao, M., Szalay, A. S., Vanden Berk, D., Vogeley, M. S., Yanny, B., Yasuda, N., York, D. G., & Zehavi, I. 2002, AJ, 124, 1810
- Toft et al. (2004) Toft, S., Mainieri, V., Rosati, P., Lidman, C., Demarco, R., Nonino, M., & Stanford, S. A. 2004, A&A, accepted
- Tran et al. (2003) Tran, K. H., Franx, M., Illingworth, G., Kelson, D. D., & van Dokkum, P. 2003, ApJ, 599, 865
- Tully & Fisher (1977) Tully, R. B. & Fisher, J. R. 1977, A&A, 54, 661
- van Dokkum & Franx (1996) van Dokkum, P. G. & Franx, M. 1996, MNRAS, 281, 985
- van Dokkum & Franx (2001) —. 2001, ApJ, 553, 90
- van Dokkum et al. (1998) van Dokkum, P. G., Franx, M., Kelson, D. D., & Illingworth, G. D. 1998, ApJ, 504, L17
- van Dokkum & Stanford (2003) van Dokkum, P. G. & Stanford, S. A. 2003, ApJ, 585, 78
- Wirth (1996) Wirth, G. D. 1996, Ph.D. Thesis
- Wirth et al. (1994) Wirth, G. D., Koo, D. C., & Kron, R. G. 1994, ApJ, 435, L105
- Wuyts et al. (2004) Wuyts, S., van Dokkum, P. G., Kelson, D. D., Franx, M., & Illingworth, G. D. 2004, ApJ, 605, 677
| Cluster | z | MembershipaaThis column notes whether the galaxies in the sample were selected based on spectroscopic redshifts (z) or based on the galaxies’ colors. | Min. aaThis column notes whether the galaxies in the sample were selected based on spectroscopic redshifts (z) or based on the galaxies’ colors. | ccAverage change in surface brightness measured for the sample based on de Vaucouleurs models () or Sérsic models (.) | ccAverage change in surface brightness measured for the sample based on de Vaucouleurs models () or Sérsic models (.) |
|---|---|---|---|---|---|
| ( mag) | ( mag) | ||||
| RX J0152.7-1357 | 0.837 | z | 020 | -0.42 0.06 | -0.67 0.06 |
| RX J0152.7-1357 | 0.837 | z | 015 | -0.44 0.06 | -0.66 0.06 |
| RX J0152.7-1357 | 0.837 | z | 010 | -0.57 0.06 | -0.68 0.05 |
| RDCS J1252.9-2927 | 1.237 | color | 020 | -0.97 0.14 | -1.17 0.13 |
| RDCS J1252.9-2927 | 1.237 | color | 015 | -1.04 0.13 | -1.08 0.13 |
| RDCS J1252.9-2927 | 1.237 | color | 010 | -1.09 0.11 | -1.06 0.11 |
| RDCS J1252.9-2927 | 1.237 | z | 020 | -1.32 0.16 | -1.28 0.11 |
| RDCS J1252.9-2927 | 1.237 | z | 015 | -1.41 0.16 | -1.42 0.13 |
| RDCS J1252.9-2927 | 1.237 | z | 010 | -1.53 0.16 | -1.47 0.13 |