Spectroscopy of the type Ia supernova SN 2002er: days 11 to +215
We present an extensive set of optical spectroscopy of the nearby type Ia supernova, SN 2002er, with 24 epochs spanning 11 to +34 days. Its spectral evolution is fairly typical of a type Ia supernova although it suffers high extinction. Nevertheless, there are differences in the spectral evolution when compared to coeval spectra of other normal type Ia supernova with comparable decline-rate parameters. Modelling of the photospheric phase spectra using a homogeneous abundance distribution in the atmosphere provides a fair match to the observations, but only by pushing the adopted distance and risetime close to the observational limits. Future improvements here will require models with a more realtistic stratified abundance distribution. From simple modelling of a nebular spectrum obtained at +215 d, we infer a 56Ni mass of 0.69M⊙, consistent with that derived from the light curve.
Key Words.:
stars: supernovae: optical spectroscopy stars: supernovae: individual: SN 2002er1 Introduction
Type Ia supernovae (SNe Ia) are currently the most accurate high-z cosmological distance indicator. Through the light curve shape corrections, accuracies of better than 10% in distance are claimed (e.g. Phillips et al. 1999; Riess et al. 1998). However, a basic assumption is that the correlations hold at all universal epochs. Yet, even for the best nearby SN Ia sample it appears that the various incarnations of the light curve correction methods may not be wholly consistent with each other (Drell et al. 2000; Leibundgut 2000).
Although there is a general consensus that type Ia supernovae result from the thermonuclear fusion of C-O white dwarfs, observational support for the numerous progenitor channels that have been proposed (e.g. Branch et al. 1995) is only just beginning to be gathered (e.g. Ruiz-Lapuente et al. 2004; Hamuy et al. 2003; Kotak et al. 2004). In contrast, there is an increasing body of evidence for the observational diversity (e.g. Benetti et al. 2004b) among type Ia supernovae perhaps suggestive of diversity in the progenitor channels and/or explosion mechanism.
In the favoured scenario leading to a type Ia explosion, the white dwarf is one component of a close binary, and accretes hydrogen from its companion star. Other scenarios include the merging of binary white dwarfs, or the accretion of He rather than H (e.g. Hillebrandt & Niemeyer 2000). When the white dwarf reaches the Chandrasekhar limit, explosive carbon burning sets in. Burning to nuclear statistical equilibrium ensues, yielding mostly radioactive 56Ni. At lower densities, intermediate-mass nuclei, e.g. 28Si, are produced. Thus the typical observed early-time spectra of SNe Ia are dominated by lines of both iron-group and intermediate mass elements. However, the exact nature of the explosion mechanism is uncertain. Competing models can be tested using detailed spectral observations since they are highly sensitive to the nature of the explosion. For example, much higher velocities in intermediate-mass elements are observed in delayed-detonation model spectra than in those of deflagration models (e.g. Khokhlov 1991). Although the optical region is spectroscopically crowded and line-identification is difficult due to the additional complication of blending as a result of Doppler broadening (several thousand kms-1), it is also a region rich in diagnostic potential. For instance, based on measurements and modelling of lines such as SiII 6355 Å, CII 6578, 7231 Å, and the CaII H and K lines, Benetti et al. (2004a) argue that the combination of high-velocity intermediate mass elements, an unusually low temperature, and low abundance of carbon indicate that burning to Si penetrated to much higher layers than expected for ‘normal’ type Ia supernovae. This was interpreted as evidence for a delayed-detonation explosion. An alternative scenario could be additional nuclear burning in the so-called distibuted regime at low densities which would have a similar effect (Röpke & Hillebrandt 2004).
To date, good photometric and spectroscopic coverage extending from pre-maximum light to late times has been obtained for only a handful of supernovae. In order to better understand and quantify the various peculiarities that have been observed, high quality photometric and spectroscopic data from pre-maximum through to nebular epochs is a prerequisite, with detailed comparisons with the predictions of explosion models being made at every step. To this end, the European Supernova Collaboration (ESC)111 http://www.mpa-garching.mpg.de/~rtn/ aims to obtain unprecedented photometric and spectroscopic coverage for 10 nearby (v km s-1) type Ia supernovae. The potential of high quality early-time spectroscopy is illustrated by the method of “abundance tomography” (Stehle et al. 2004) whereby the detailed abundance stratification is derived by computing synthetic spectra for over ten epochs, using spectroscopy from the earliest epochs to constrain later ones.
We have already obtained excellent data sets for about eight nearby type Ia SNe. This is the third in a series of observational papers published on behalf of the ESC. We present early-time optical spectroscopy spanning 24 epochs of the second ESC target, SN 2002er. In a companion paper, Pignata et al. (2004) discuss the photometric evolution of SN 2002er.

1.1 SN 2002er
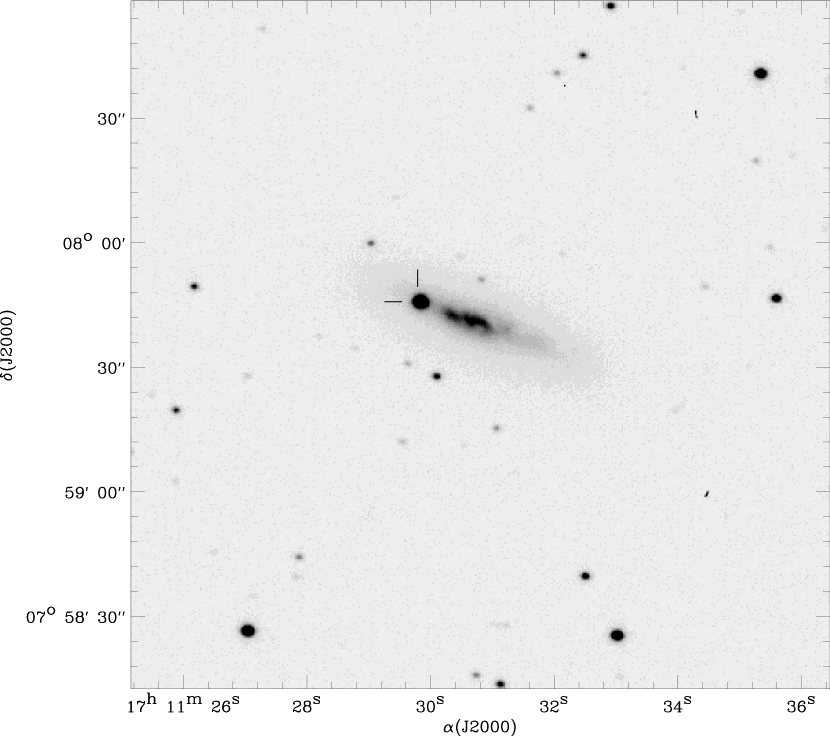
SN 2002er in UGC 10743 was discovered on 2002 Aug. 23.2 U.T. in NEAT images by Wood-Vasey et al. (2002). and was spectroscopically confirmed to be a type Ia supernova three days later by Smartt et al. (2004); comparison with SN 1994D suggested that it was discovered at an early phase (about d before maximum light) and that it was significantly redder. A list of basic parameters is given in Table 1.
| Host galaxy | UGC 10743 |
|---|---|
| Host galaxy type | Sa † |
| RA (2000) | |
| Dec (2000) | |
| Recession velocity ( km s-1) | |
| Distance modulus∗ | |
| (Hkms-1Mpc-1) | |
| E | 0.36 |
| Offset from nucleus | W N |
| Date of B maximum (MJD)∗ | 52524.2 (Sep. 07, 2002) |
| Magnitude at maximum∗ | U=14.72, B=14.89, V=14.59, |
| R=14.43, I=14.49 | |
| (B)∗ | 1.330.04 |
Notes. ∗ Taken from Pignata et al. (2004); † NED.
2 Data acquisition and reduction
The photospheric-phase observations span to +34 days. Somewhat unusually, the spectroscopic monitoring began several days before the photometric campaign. Optical spectra of SN 2002er were obtained from several different telescopes (Table LABEL:tab:obslog). The observations were carried out in service or target-of-opportunity mode usually using the configuration available at the time. This meant that the set-up varied with epoch and even with observations performed using the same instrument (see Table LABEL:tab:obslog).
The reduction of the data was carried out using standard NOAO IRAF and FIGARO routines (Shortridge 2002). The CCD frames were debiased and corrected for distortion and cosmic rays. Where a sufficient number of flatfield frames were available, the data were also flatfielded. Sky subtraction was carried out by fitting low-order polynomials to the background on either side of the supernova spectrum and optimally extracting one-dimensional spectra from the two-dimensional frames. The wavelength solution was derived using arc frames and was checked against the bright night-sky emission lines. Flux calibration was carried out with respect to spectrophotmetric standards usually taken using an identical instrument configuration and reduced as described above. No attempt was made to correct for the telluric absorption features between 6000 – 8000 Å.
To obtain full wavelength coverage in the optical region, an observation at any given epoch typically consisted of two or three spectra taken either with a single grating/grism at different central wavelengths or using different gratings/grisms. Severe distortion between the blue and red parts of the optical spectra was apparent on several nights and variable conditions exacerbated the situation. To correct for this distortion we multiplied the fluxed supernova spectra by the Bessell filter functions and integrated across the bands. A similar procedure was applied to the spectrum of Vega, and hence spectroscopic magnitudes for the supernova were derived. Comparison with near-contemporaneous photometry (from Pignata et al. 2004) was then used to derive scaling factors for each band. A low-order polynomial fit to the scaling factors was obtained which was then applied to full supernova spectrum. We estimate the flux calibration to be accurate to about 10-15%. For the earliest epochs (11 to 8 d) no photometry was available for comparison. Since it is the behaviour at the earliest epochs that we seek to understand, we did not scale these spectra in any preconceived manner.
| Date | M.J.D. | Epoch∗ | Approx. Range | Telescope+Instrument+ | Flux | ||
|---|---|---|---|---|---|---|---|
| (d) | (Å) | Grating/Grism | Standard | ||||
| 20020826 | 52512.93 | 11.3 | 3500–7200 | INT+IDS+R400V | HD 19445 | ||
| 20020828 | 52514.87 | 9.3 | 3600–7800 | INT+IDS+R632V | Kopff 27 | ||
| 20020829 | 52515.86 | 8.3 | 3300–8900 | INT+IDS+R632V | |||
| 20020830 | 52516.84 | 7.4 | 3600–9000 | A1.82+AFOSC+gm2,4 | BD+28 4211 | ||
| 20020831 | 52517.89 | 6.3 | 3400–9900 | INT+IDS+R632V | Kopff 27 | ||
| 20020901 | 52518.85 | 5.3 | 3200–9100 | CA+CAFOS+B,R200† | BD+28 4211 | ||
| 20020902 | 52519.88 | 4.3 | 3250–9300 | INT+IDS+R632V† | Kopff 27 | ||
| 20020903 | 52520.85 | 3.3 | 3200–10000 | CA+CAFOS+B,R200† | BD+28 4211 | ||
| 20020904 | 52521.83 | 2.4 | 3200–10000 | CA+CAFOS+B,R200† | BD+28 4211 | ||
| 20020905 | 52522.82 | 1.4 | 3200–10000 | CA+CAFOS+B,R200† | BD+28 4211 | ||
| 20020906 | 52523.85 | 0.3 | 3500–10000 | CA+CAFOS+B,R200 | BD+28 4211 | ||
| 20020907 | 52524.89 | +0.7 | 6200–10000 | CA+CAFOS+B,R200‡ | BD+28 4211 | ||
| 20020908 | 52525.88 | +1.7 | 3700–9300 | CA+CAFOS+B,R200† | BD+28 4211 | ||
| 20020910 | 52527.81 | +3.6 | 3200–10000 | CA+CAFOS+B,R200† | BD+28 4211 | ||
| 20020911 | 52528.81 | +4.6 | 3450–7600 | A1.82+AFOSC+gm4 | |||
| 20020912 | 52529.88 | +5.7 | 3250–9800 | CA+CAFOS+B,R20† | BD+28 4211 | ||
| 20020916 | 52533.84 | +9.6 | 3300–8700 | INT+IDS+R150V | Kopff 27 | ||
| 20020918 | 52535.03 | +10.8 | 3450–9600 | D1.54+DFOSC+gm4 | LTT 7987 | ||
| 20020919 | 52536.87 | +12.7 | 3450–8800 | INT+IDS+R150V† | Kopff 27 | ||
| 20020922 | 52540.00 | +15.8 | 3300–9750 | D1.54+DFOSC+gm5 | LTT 7987 | ||
| 20020923 | 52540.86 | +16.7 | 3300–9700 | INT+IDS+R150V | Kopff 27 | ||
| 20020924 | 52542.00 | +17.8 | 9400–24900 | NTT+SofI | HIP 95550 | ||
| 20020926 | 52544.02 | +19.8 | 3500–8800 | D1.54+DFOSC+gm5 | LTT 7987 | ||
| 20021001 | 52548.75 | +24.6 | 3500–7500 | A1.82+AFOSC+gm4 | BD+28 4211 | ||
| 20021010 | 52557.84 | +33.6 | 3600–9300 | INT+IDS+R150V | Kopff 27 | ||
| 20030410 | 52739.17 | +215.0 | 3500–8000 | TNG+LRB | Feige 66 |
Notes. ∗ Epoch relative to Bmax, which occurred on MJD=52524.2 (Pignata et al. 2004). A1.82 = Asiago 1.82 m telescope, CA = Calar Alto 2.2 m telescope, INT = Isaac Newton Telescope, D1.54 = Danish 1.54 m telescope, NTT = ESO New Technology Telescope, TNG = Telescopio Nazionale Galileo. For the 8.3 d spectrum we used the flux standard taken with the same set-up on the previous night, while for the +4.6 d spectrum we used a sensitivity function appropriate for the setup, kindly provided by N. Elias de la Rosa. data not flatfielded; missed target with blue grism.
| Reference | ||
|---|---|---|
| SN 1994D | 0.060.02 | Patat et al. (1996) |
| SN 1996X | 0.10.03 | Salvo et al. (2001) |
| SN 1998 aq | Branch et al. (2003) | |
| SN 1998bu | 0.320.04 | Hernandez et al. (2000) |
| SN 1999 ee | 0.32 | Hamuy et al. (2002) |
| SN 2002bo | 0.430.1 | Benetti et al. (2004a) |
Notes. The absence of narrow Na D absorption lines in SN 1998 aq (Ayani & Yamaoka 1998) implies little reddening.
3 Optical spectra at early times
This section is subdivided as follows: we detail the early spectral evolution of SN 2002er in Sect. 3.1 followed by a discussion on the presence of carbon in Sect. 3.2. We then describe the evolution of the expansion velocities in Sect. 3.3.
3.1 Spectral Evolution
The spectral evolution of SN 2002er from day to +34 is shown in Fig. 2. The rapid evolution at early times can be followed in detail given the excellent temporal coverage. The outermost material in the ejecta, composed mainly of intermediate mass elements is responsible for producing the spectrum up to about maximum light. The spectra shown in Fig. 2 are typical of normal type Ia supernovae, characterised at early epochs (up to about day +6) by the deep P Cygni absorption near 6150 Å due to SiII and the distinctive W-shaped SII feature near 5400 Å. Other prominent features at these phases are attributed to the CaII H and K blend, MgII 4481 Å and a multitude of blends due to FeII, SiII, and SII in the 4500 to 5000 Å range. The NaI D lines are clearly visible suggesting that substantial reddening due to intervening material.
A comparison with other type Ia supernovae at four representative epochs is shown in Fig. 3. The decline-rate parameters for these supernovae are fairly typical with the exception of the slow-decliner SN 1999 ee which shows markedly different behaviour at early epochs, but has been included for comparison. Although differences between the spectra are present at all epochs, these are most pronounced in the pre-maximum spectra (Fig. 3a). The obvious contrasts are in the shape and depth of the prominent features and in the amount of structure in the spectrum. The latter is probably due in part to the differences in the velocities of the ejecta; this is especially true of SN 2002bo for which the higher velocities have probably smeared out the weaker features. However, the similarity between SN 2002er and SN 1994D, down to the weakest of features is striking. The strength of the temperature- sensitive SiIII 4553,4568 Å line suggests that SN 2002er and SN 1994D spectra are intermediate in temperature compared with the hotter SN 1998bu and SN 1998aq spectra and the cooler SN 2002bo spectrum. The W-shaped SII feature at 5454,5460 Å is already apparent at d in the SN 2002er spectrum whereas it only became apparent at 2 d in the spectrum of SN 1999ee (Hamuy et al. 2002).
By maximum light (Fig. 3b), the CaII lines near 8500 Å have become significantly stronger and the W-shaped SII 5454,5640 Å feature is very well-developed. The CaII H & K feature (blended with the SiII 3858 Å) is more similar to that of SN 2002bo than to the double-dipped feature seen in SNe 1994D, 1996X and 1998bu. Lentz et al. (2000) have suggested that the presence or absence of a split in this feature is related to the relative strength of the SiII and Ca features. The strength and width of the SiII 6355 Å feature is comparable to that seen in SN 1994D and SN 1996X. The 4950 Å feature is stronger in SN 2002er at pre-maximum epochs than in the other supernovae shown in Fig. 3a; by maximum light, it has developed into a pronounced W-shaped feature. Unlike the W-shaped SII feature at 5400 Å which is ubiquitous at maximum in all normal type Ia supernovae, only in SN 1996X does the 4950 Å feature appear with comparable prominence to that of SN 2002er. The higher temperature of SN 2002er, as suggested by the SiIII lines, lends credence to the suggestion that the 4950 Å feature is due to FeIII (Mazzali et al. 1995). Note that the presence of lines of high excitation is to be expected given the somewhat higher than normal 56Ni mass inferred from the light curve by (0.7M⊙ Pignata et al. 2004).


Nugent et al. (1995) found a tight correlation between the ratio, (SiII) of the depths of the SiII 5972 Å and 6355 Å absorption troughs near maximum light and the luminosity of the supernova: the subluminous, faster decliners have larger values of (SiII). However, this correlation has been shown to break down for (see Fig. 8 in Benetti et al. 2004a). For SN 2002er we measure 0.23 for (SiII) which is consistent with the Nugent/Benetti relation to within the errors.
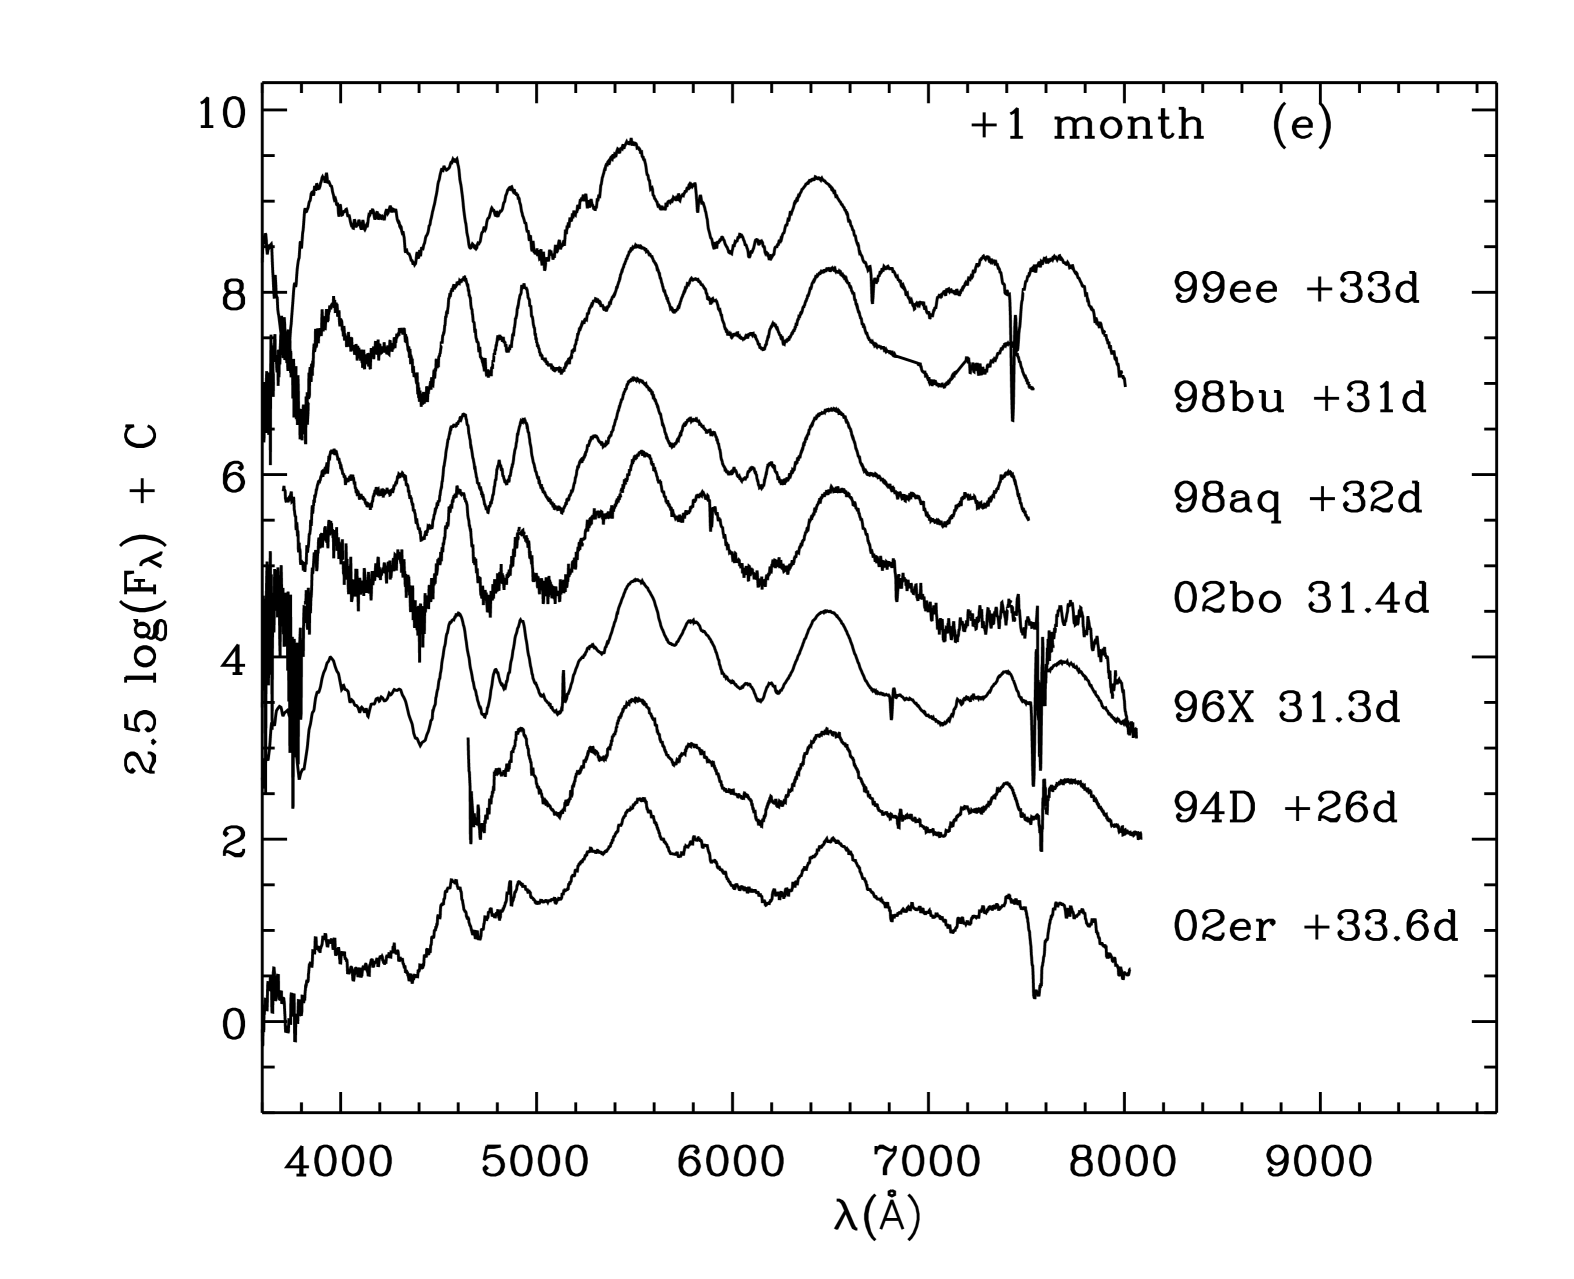
By about +20 d post maximum light, the SiII 6355 Å feature is still clearly visible (Fig. 3d). All the other supernovae, shown at comparable epochs, show kinks in the red wing of the SiII 6355 Å feature due to FeII. SN 2002er, on the other hand, shows a rather smooth red wing. This suggests that the SiII feature is not confined to a narrow range in velocity and corroborates the finding by Pignata et al. (2004) from light curve modelling, that the ejecta are highly mixed. Notice also that the strength of the CaII H&K feature is more similar to that of the slowest decliner shown in Fig. 3, SN 1999ee. By about a month post-maximum light (Fig. 3e), the SiII feature is barely perceptible as features due to Fe dominate this wavelength range. Figs. 3d,e together suggest that the intermediate-element phase was of slightly longer duration in SN 2002er (i.e. slower transition to Fe-peak elements) than for the other supernovae shown in Fig. 3.
Interestingly, although the similarity of SN 2002er with SN 1994D and SN 1996X remains impressive throughout its photospheric evolution, the differences become more apparent with time.
3.2 Carbon in pre-maximum spectra

Carbon is a diagnostically interesting element in pre-maximum spectra. Its abundance allows us to place limits on the composition of the progenitor white dwarf. In addition, the amount of carbon constrains the extent of burning in the outer layers thereby testing various explosion scenarios. For instance, current delayed-detonation models have very little carbon below about 30000 km s-1, while the 1-D deflagration model (W7) has unburnt carbon present down to velocities of about 14000 km s-1(e.g. Branch et al. 2003).
The first reported detection of carbon in a SN Ia was in the 14 d spectrum of SN 1990N (Fisher et al. 1997). However, carbon lines have also been identified at 10 d in the spectra of SN 1994D and at 9 d in SN 1998aq (Branch et al. 2003). The strongest line is at 6580 Å with weaker lines at 4267 Å and 7234 Å. In Fig. 4, we show tentative evidence for the presence of the CII 6580 Å line present up to about a week before maximum light at about 13000 km s-1. There is no evidence of the CII 7234 Å line (Fig. 4b) but this would, in any case, be expected to be much weaker.
3.3 Expansion velocities
As the photosphere recedes into deeper and slower moving material, the minima of the absorption features shift redwards with time. As already mentioned, this can provide a powerful “tomographic” picture of the SN ejecta. However, very strong lines may be less useful in this regard. Patat et al. (1996) point out that the velocities inferred from the strong features (e.g. the characteristic SiII line) are only representative of the photospheric velocity at early phases when the amount of material above the photosphere is small; as the photosphere retreats, it encounters flatter density gradients which results in strong lines being formed over a large velocity range, thus overestimating the photospheric velocity. In contrast, weak lines can provide good indicators of the photospheric position.
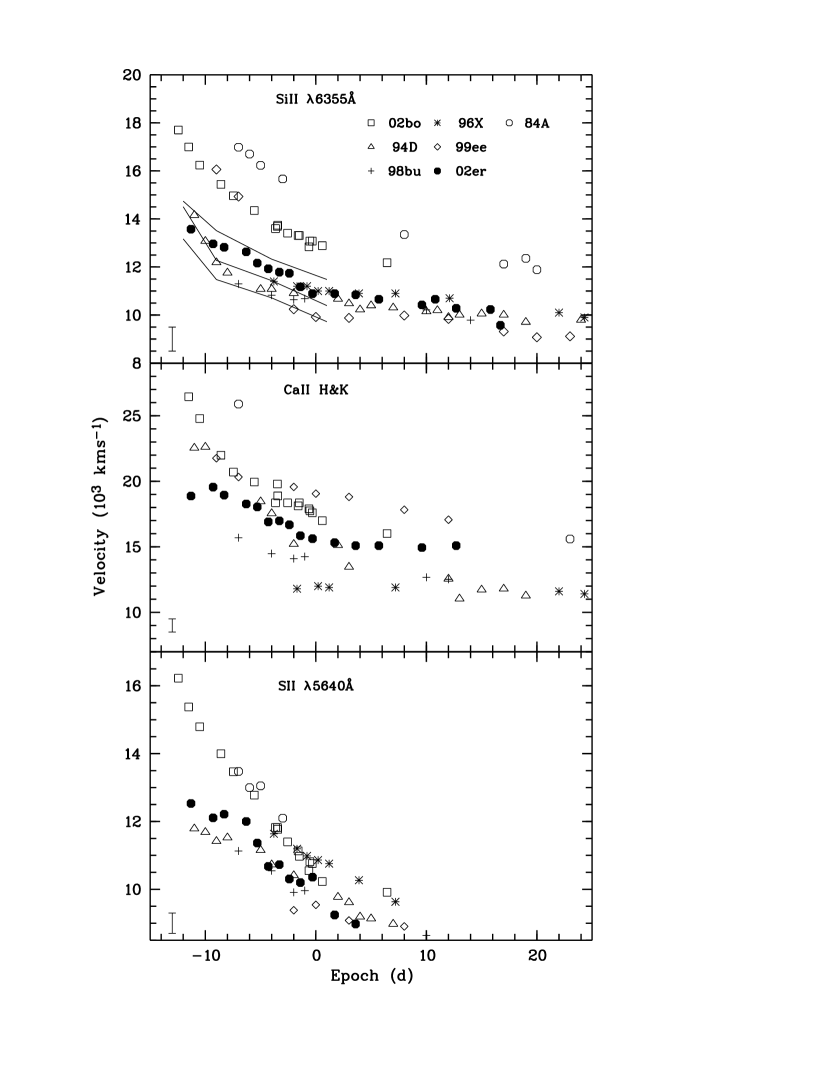
In SN 2002er, we examined the velocity evolution of the strong SiII 6355 Å and CaII H&K lines and the weak SII 5640 Å line. The results are shown in Fig. 5 together with those of other supernovae for comparison. All velocities have been corrected for the recession velocities of the respective host galaxies. As expected, the weak SII line exhibits lower velocities than do stronger lines. The strong SiII feature in the earliest spectrum of SN 2002er (11.3 d), has its minimum centred at about 6120 Å, with its blue edge lying at about 22000 km s-1. As has already been pointed out by several authors (e.g. Mazzali et al. 1993) such velocities are well in excess of the 15000 km s-1 limit in the unmixed W7 model (Nomoto et al. 1984).
Lentz et al. (2000) have computed the effects of varying the metallicity in the C+O layer of the standard deflagration model, W7, on the emergent pre-maximum spectra of type Ia supernovae. They find that the strength, profile, and velocity of the SiII 6355 Å feature is a function of metallicity. Their results are plotted in Fig. 5. Clearly the range of velocities seen between a number of SNe Ia may indeed be due to metallicity variations. However, even with implausibly large variations in the C+O layer metallicity (1/10 to 10 solar) we cannot reproduce the high velocities exhibited by SN 2002bo and SN 1984A. These large velocities could be due to other factors such as higher explosion energy.
4 Synthetic spectra
Comparison with observations of synthetic spectra based on specific explosion models provides a powerful tool for probing the physics of supernovae. Here we compare the SN 2002er early-time spectra with model spectra generated by a Monte Carlo (MC) code. The code is based on the Sobolev approximation, and it was discussed in a number of papers that the reader can turn to for details (Abbott & Lucy 1985; Mazzali & Lucy 1993; Lucy 1999; Mazzali 2000). The input parameters are the luminosity , the epoch where explosion occurs at d , the photospheric velocity , and a density distribution from an explosion model. The code iteratively computes the radiation field and the level populations in the SN ejecta under the assumption that there is no net exchange of energy between matter and radiation above a sharply defined photosphere. This means that no deposition of fast particles created in radioactive decays occurs above the photosphere, and that absorptive continuum opacities are ignored. This is a reasonable approximation at the earliest phases of a SN Ia.
The luminosity is chosen to match the observed value and the velocity adjusted to obtain a good match to the observed line blueshifts. The epoch relative to explosion is determined, inevitably with some uncertainty, from the time of observed maximum. This is because first observations are usually at least a few days after the SN exploded. Different models can be chosen for the density distribution. In this paper we base our calculations on W7(Nomoto et al. 1985), which is known to give a good description of typical type Ia SNe. Energy packets are released at the photosphere and travel through the SN envelope, where they can undergo line absorption and reemission (branching) and electron scattering. When a converged temperature structure is established and appropriate excitation and ionisation conditions are computed (using a modified nebular approximation (Abbott & Lucy 1985; Mazzali & Lucy 1993)), a synthetic spectrum is obtained using a formal integral scheme.
We calculated two spectral models for SN 2002er, one for an epoch near maximum light (day –2.4) and one for the earliest epoch at –11.3 days. These two epochs were chosen to cover a period in which the physical properties change significantly.
In the first iteration of the day –2.4 spectral model we adopted a typical value for the photospheric velocity at this epoch, of 9500 km s-1. The distance modulus () and the reddening () were taken from Pignata et al. (2004). This initial set of parameters provided a poor match to the observed spectrum. The problem was that, in order to match the observed bolometric luminosity of log 43.2 [erg s-1] (Pignata et al. 2004) and the observed line velocity (this work) the model temperature near the photosphere had the rather high value of K. Consequently the ionisation was much too high. For example, strong Si iii lines were predicted but not observed. The large observed line ratio of Si ii 5970 Å to Si ii 6350 Å also indicates a rather low temperature. Nugent et al. (1995) derived a temperature of K for SNe Ia with a line ratio similar to that of SN 2002er.
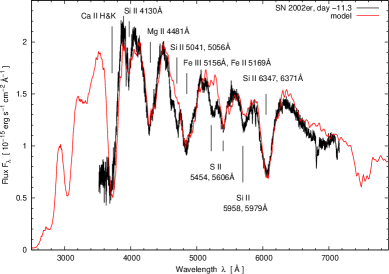
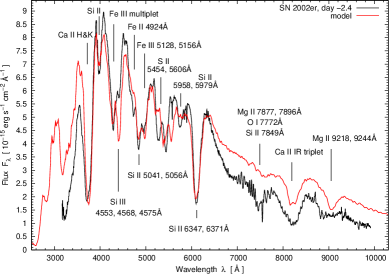
In order to try to resolve this discrepancy between the model and observations, we explored the range of parameter space available through the uncertainties in reddening, distance and explosion epoch. We found that even if we set the reddening at the 1 lower limit of (Pignata et al. 2004), we make little difference to the discrepancy. The best match was obtained by pushing the distance modulus to its 1 lower limit of , while keeping the formal value of the reddening, , and using a risetime of 20.0d. This risetime is 1.3d longer than estimated by Pignata et al. (2004), but is closer to the typical SN Ia risetime of d (Riess et al. 1999). This departure from the Pignata et al. (2004) value can be justified by the fact that the photometric data are not available earlier than –7.3 days. Nevertheless, even with these more extreme parameter values, the temperature was still found to be rather too high. The best match parameters are log[ erg s-1] and a velocity at photophere of 9200 km s-1, leading to a photospheric temperature of K. The model thus obtained is compared with the observed spectrum in Fig. 6b.
The main features are labelled with their rest wavelength in Fig. 6. We identify strong Si ii lines at 6360 Å, 5970 Å, and at 4130 Å. Additionally, the deep absorption near 4800 Å contains a significant amount of Si ii. The rest of this feature is caused by Fe ii. Weak Si iii lines can be seen in the observed spectrum at 4570 Å and 5740 Å, but they are both very strong in the model due to the high temperature. S ii produces the double line feature near 5400 Å. The absorption at 4400 Å is due to Mg ii 4481 Å, as well as the one near 7500 Å. Finally we recognise the strong Ca ii H&K lines and the Ca ii IR triplet. Although it is not as pronounced as in the case of SN 2002bo (Stehle et al. 2004), a high-velocity component in the Ca ii lines can be seen that is not reproduced by the model, which uses the density distribution of W7.
In constructing the spectral model for –11.3 days, we could not obtain the flux directly from observation since the earliest photometry epoch was at –7.3 days. [One possibility is to extrapolate the light curve to the early epochs using a quadratic function in time (Riess et al. 1999) (). This procedure gives log[ erg s-1]. This is however too bright, leading to a very hot model. An alternative approach is to used the synthetic light curve fit of Pignata et al. (2004) to extrapolate back to –11.3 days. This yielded log[ erg s-1]. This allowed the model to produce much more reasonable results. The best match was obtained with a velocity at the photosphere of 13000 km s-1, leading to K. The model spectrum is compared with the observed spectrum in Fig. 6. Although the agreement is good, it should be kept in mind that the synthetic light curve shape may change when a more realistic element distribution is adopted compared with that used in Pignata et al. (2004). It is interesting that in SN 2002er, as in SN 2002bo, the temperature rises as we approach maximum light. This behaviour is not typical of all SNe Ia (Benetti et al. 2004b)
While the strong Si ii line absorptions are well reproduced, Si ii 5970 Å is too weak owing to the temperature still being too high. The S ii double line feature near 5400 Å is not well reproduced in its blue part. Since these lines come from the same lower levels, there may be a problem in the model line list, in particular the values. The line at 4700 Å is not reproduced by the model. This feature was detected in other SNe Ia and can possibly be assigned to a high-velocity absorption of Fe ii (Hatano et al. 1999). All the other lines are well reproduced and have already been discussed for the day –2.4 model.
The above analysis indicates shortcomings in the modelling procedure. Specifically, owing to the homogenous abundance distribution of the model, to reproduce the strong Si ii absorptions we had to introduce a rather high Si abundance (63% by mass) throughout the envelope. But due to the high photospheric temperature, the Si is almost completely doubly-ionised near the photosphere at maximum, severely overproducing the Si iii features. Only further out in the envelope, where the temperature is sufficiently low, are the required Si ii absorptions formed. A similar problem was encountered with SN 2002bo (Benetti et al. 2004a). However, Stehle et al. (2004) find that, in a more recent analysis of SN 2002bo by the “Abundance Tomography” method, it is possible to reduce the Si abundance near the photosphere and yet simultaneously keep a desirably high Si abundance at the outer radii Stehle et al. (2004). Furthermore, Stehle et al. (2004) also find that improving the description of the radiation field at the inner boundary reduces the overestimate of the emergent flux in the red, leading to a decrease of the total luminosity and hence a lower temperature near the photosphere. In the case of SN 2002er, however, we also note that if the reddening and/or the distance are reduced by more than the 1 error boundaries estimated by (Pignata et al. 2004) then greater consistency with the spectral models is achieved. At present, there is no independent evidence that such reduction should be applied.
We conclude that the maximum light spectrum of SN 2002er can be fairly well modelled using a homogeneous abundance distribution in the atmosphere provided we push the adopted distance and risetime close to the observational limits. Modelling of the earliest spectrum depends sensitively on the adopted flux level, but unfortunately observations do not directly provide this value. However, extrapolation by means of a bolometric light curve model fit appears to provide a reasonable estimate of this quantity. Future progress will require a more realistic model which includes a stratified abundance distribution.


5 Near-IR spectroscopy of SN 2002er
Early-time IR spectroscopic observations can provide a particularly powerful diagnostic of the dynamic model because they probe different depths at the same epoch within the exploded white dwarf through the strongly variable line-blanketing opacity (Wheeler et al. 1998). Furthermore, the large number of lines in the optical/UV regions, coupled with the strong Doppler-broadening (several thousand kms-1) can make species identification difficult. Strong extinction effects often introduce additional error. In contrast, the near-IR has fewer lines and reduced sensitivity to extinction uncertainty, allowing firm line identification and accurate measurement of line strength and evolution. In addition, since there are much fewer strong resonance lines, it means that, in general, for a line to be detectable it needs a significant element abundance. In other words, IR lines suffer less from contamination by primordial elements.
After maximum light there is a rich mixture of Fe-group lines in the IR spectrum, allowing us to explore the innermost regions of the supernova and to ascertain the extent of incomplete silicon burning. Wheeler et al. (1998) find that the post-maximum-light features at 1.5–1.7 and 2.2–2.6 m are primarily due to iron group elements of the second ionisation stage. The blue extent of the feature at 1.55 m defines the transition from partial to complete Si burning (Marion et al. 2003). Due to the high optical depth, this feature is formed near the outer boundary of the Fe/Co/Ni core and demarcates the the Fe/Si edge (Fig. 7) Wheeler et al. (1998) particularly note that the minimum at 1.7 m provides a diagnostic tool for assessing the velocity spread of the region containing radioactive materials which, in turn, depends on the underlying explosion scenario. The 2.2–2.6 m features also contain significant contributions from intermediate mass elements such as Si. Indeed, these K-band features are formed in the transition region between complete and incomplete silicon burning and are sensitive to the composition structure and hence the explosion model.
Due to a combination of poor conditions and instrument availability, only a single epoch of near-IR spectroscopy was obtained, on 2002 September 24 (+17.8 d) using the NTT/SofI low-resolution blue and red grisms. The spectrum was reduced using standard procedures in the FIGARO 4 environment. Wavelength calibration of the 0.95-1.64 m spectrum was carried out using a Xe arc; as no arc frame was available for the 1.53-2.52 m spectrum, we used the OH sky lines. Flux calibration was carried out with respect to the bright F6V star HIP 95550 and compared with near-IR photometry taken at +19.9 d (Pignata et al. 2004). The spectrum, scaled by 20% to match the photometry, is shown in Fig. 7. For comparison, we also show the rest-frame near-IR spectra of other SNe Ia at comparable epochs. Owing to the sparsity of near-IR spectra at the appropriate epoch (3 weeks), we include two spectra of SN 2002bo that bracket the phase of the SN 2002er near-IR observation.
Inspection of Fig. 7 shows that the IR spectrum of SN 2002er is fairly typical for the epoch considered. As anticipated for this epoch, the spectrum is dominated by the increasingly exposed Fe-group elements. The 1.7m feature is considerably shallower in SN 2002er than in SN 1996X and is more reminiscent of the morphology seen in the somewhat faster decliners such as SN 1998bu and perhaps, SN 1999ee. As indicated above, this may be interpreted as a larger-than-average velocity spread in the radioactive materials. However, the measured Doppler blueshift in the 1.5m edge (rest wavelength 1.57m, Marion et al. 2003) is 8300500 km s-1 for SN 2002er compared with 10500500 km s-1 for SN 1996X at +19d. This suggests that silicon burning actually extended to higher velocities in SN 1996X.
6 The nebular spectrum at +215 days
In a Type Ia supernova, by about 60–100 days post-explosion the photosphere has receded to the centre, and the ejecta have become transparent to the optical/IR emission i.e. the forbidden-line-dominated nebular phase has been reached. The transparency of the ejecta means that the physical conditions and constituents of the innermost regions can be directly probed. Furthermore homologous expansion means that line profiles provide valuable information about the distribution of the nucleosynthesised materials. In particular, the mass and velocity distribution of 56Ni and its products can provide information on the nature of the explosion.
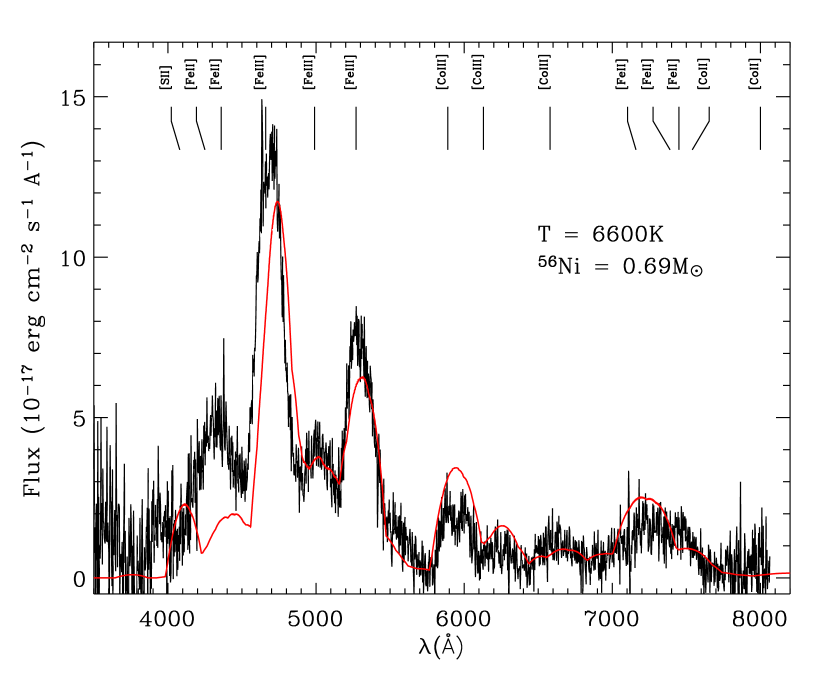
We obtained a single nebular phase spectrum at +215 d post -maximum. The spectrum was reduced as described in Sec. 2 and is shown in Fig. 8 together with spectra of other type Ia supernova at comparable epochs. As with the earlier epoch spectra, the form of the late time spectrum of SN 2002er is not unusual. The spectrum is dominated by forbidden lines of singly and doubly ionised Co and Fe. The FWHM of the 4700 Å feature (13000 km s-1) is consistent with the relation in Mazzali et al. (1998) that links the width of nebular lines to the luminosity of the supernova.
In order to exploit the information available in the nebular spectrum, we compared it with the non-LTE nebular spectral model described in Bowers et al. (1997), to which we refer the reader for details. Briefly, the model comprises a uniform density, homologous expanding sphere containing iron, cobalt, and sulphur with the relative abundances as specified by radioactive decay. Forbidden lines of these elements emitted by singly and doubly-ionised species are predicted to dominate the nebular phase at optical and near-IR wavelengths. Consequently only these two ionisation stages were included in the model. The distance and reddening were set at and respectively (see above). The 56Ni mass, expansion velocity, ionisation degree and temperature are free parameters. The best-match model is shown in Fig. 9, compared with the observed spectrum. The model parameter values are K, expansion velocity 9000 km s-1 fractional abundance of SII=0.5, and M(56Ni)= 0.69 . These clearly yield a fair match to the observed spectrum. We also note that the derived mass of 56Ni is close to the value obtained from the bolometric light curve (0.7 , Pignata et al. 2004). We conclude that (i) the masses of 56Ni derived by the two methods are consistent with each other, and (ii) the fraction of neutral and triply-ionised iron-group elements is indeed quite small.
7 Summary
We have presented extensive optical spectroscopy of SN 2002er at epochs spanning 11 to +215 days. The spectroscopic coverage at epochs up to +34 days is especially noteworthy. In most respects, SN 2002er bears the hallmarks of being a typical, albeit significantly reddened, type Ia supernova. Its spectral evolution was similar to those of other normal type Ia SNe such as SN 1994D and SN 1996X that suffered from minimal reddening. Nevertheless, differences are seen between the coeval spectra of SN 2002er and other normal SNe Ia. These are most pronounced in the pre-maximum spectra.
We compared the spectra at two early-time epochs with a homogeneous spectral synthesis model based on the deflagration model W7. The best match was obtained only by pushing the distance modulus to its 1 lower limit of , and using a risetime as high as 20.0d. Even then the model temperature is rather too high. A similar problem was encountered at both epochs. Nevertheless, most of the features of the early-time spectra were quite successfully reproduced by the model. Future modelling improvements will include stratified abundances, plus a better description of the radiation field.
Only one early-time IR spectrum was obtained. As with the optical spectra, this showed that SN 2002er was fairly typical but with some differences from other events.
An optical spectrum obtained at +215 d spectrum was modelled using a simple one-zone nebular code. This provided a fair match to the observed spectrum. A 56Ni mass of 0.69M⊙ was inferred – consistent with that derived from the light curve (0.7M⊙ Pignata et al. 2004), and indicating that the fraction of neutral and triply-ionised iron-group elements is quite small.
The principal contribution of this paper to the study of the SN Ia phenomenon has been its provision of an extensive, frequently-sampled set of early-time spectra. These spectra span the crucial phase during which the photosphere recedes from the outermost unburned layers into the innermost iron-group regions of the core. This provides a superb dataset against which explosion scenarios will be tested via “tomographic” spectral synthesis models. Such studies will be vital in order to understand the significance of the small differences seen between different type Ia supernovae.
Acknowledgments
We are grateful to all the observers who had to give up part of their observing time so that SN 2002er could be observed, and to the staff at the various observatories for efficiently scheduling/carrying out our service/override requests. R.K. would additionally like to thank U. Thiele for remeasuring the arcs used in the CAFOS observations. We also appreciate A. Pastorello’s help in acquiring the AFOSC observations. Support from the EC Programme ‘The Physics of Type Ia SNe’ (HPRN-CT-2002-00303) is acknowledged. This work is based on observations collected at the European Southern Observatory, Chile (ESO No 69.D-0670), the Italian Telescopio Nazionale Galileo (TNG), La Palma, and the Isaac Newton (INT), and William Herschel (WHT) Telescopes of the Isaac Newton Group, La Palma, The TNG is operated on the island of La Palma by the Centro Galileo Galilei of INAF (Instituto Nazionale di Astrofisica) at the Spanish Observatorio del Roque de los Muchachos of the Instituto de Astrofisica de Canarias. The INT and WHT are operated on the island of La Palma by the Isaac Newton Group (ING) in the Spanish Observatorio del Roque de los Muchachos of the Instituto de Astrofisica de Canarias. Also based in part on observations collected at the CAHA at Calar Alto, operated jointly by the Max-Planck Institut für Astronomie and the Instituto de Astrofisica de Andalucia (CSIC).
References
- Abbott & Lucy (1985) Abbott D.C., Lucy L.B., 1985, ApJ, 288, 679
- Ayani & Yamaoka (1998) Ayani,K., Yamaoka, H., 1998, IAUC 6878
- Benetti et al. (2004a) Benetti, S., Meikle, P., Stehle, M. et al., 2004a, MNRAS, 348, 261
- Benetti et al. (2004b) Benetti, S.et al., 2004b, ApJL (submitted)
- Bowers et al. (1997) Bowers, E.J.C., Meikle, W.P.S., Geballe, T.R., Walton, N.A., Pinto, P.A., Dhillon, V.S., Howell, S.B., Harrop-Allin, M.K., 1997, MNRAS, 290, 663
- Branch et al. (1995) Branch, D., Livio, M., Yungelson, L.R. et al., 1995, PASP, 107, 1019
- Branch et al. (2003) Branch, D., Garnavich, P., Matheson, T. et al.
- Cardelli et al. (1989) Cardelli, J.A., Clayton, G.C., Mathis, J.S., 1989, ApJ, 345, 245
- Drell et al. (2000) Drell, P.S., Loredo, T.J., Wasserman, I., 2000, ApJ, 530, 593
- Riess et al. (1999) Riess A.G., Filippenko A.V., Li W., et al., 1999, AJ, 118, 2675
- Fisher et al. (1997) Fisher A., Branch D., Nugent P., Baron E., 1997, ApJ, 481, L89
- Hamuy et al. (2002) Hamuy, M., Maza, J., Pinto, P.A. et al., 2002, ApJ, 124, 417
- Hamuy et al. (2003) Hamuy, M., Phillips, M. M., et al. 2003, Nature, 424, 651
- Hatano et al. (1999) Hatano K., Branch D., Fisher A., et al., 1999, ApJ, 525, 881
- Hernandez et al. (2000) Hernandez, M., Meikle, W.P.S., Aparicio, A. et al., 2000, MNRAS, 319, 223
- Hillebrandt & Niemeyer (2000) Hillebrandt & Niemeyer, 2000, ARA& A, 38, 191
- Jha et al. (1999) Jha, S., Garnavich, P., Kirshner, R. et al., ApJS, 125, 73
- Khokhlov (1991) Khokhlov, A.M., 1991, A&A, 245, 114
- Kotak et al. (2004) Kotak, R., Meikle, W.P.S., Adamson, A., Leggett, S.K., 2004, MNRAS, 354, L13
- Leibundgut (2000) Leibundgut, B., 2000, A&AR, 10, 179
- Lentz et al. (2000) Lentz, E.J., Baron, E., Branch, D. et al., 2000, ApJ, 530, 966
- Lucy (1999) Lucy L.B., 1999, A&A, 345, 211
- Marion et al. (2003) Marion, G.H., Höflich, P., Vacca, W.D. et al., 2003, ApJ, 591, 316
- Mazzali & Lucy (1993) Mazzali P.A., & Lucy L.B., 1993, A&A, 279, 447
- Mazzali et al. (1993) Mazzali, P.A. et al., 1993
- Mazzali et al. (1995) Mazzali, P.A., Danziger, I.J., & Turatto, M., 1995, A& A, 297, 509
- Mazzali et al. (1998) Mazzali, P.A., Cappellaro, E., Danziger, I.J., Turatto, M., Benetti, S., 1998, ApJ, 499, L49
- Mazzali (2000) Mazzali P.A., 2000, A&A, 363, 705
- Nomoto et al. (1984) Nomoto, K., Thielemann, F.-K, & Yokoi, K., 1984, ApJ, 286, 644
- Nomoto et al. (1985) Nomoto, K. et al., 1985
- Nugent et al. (1995) Nugent, P., Phillips, M., Baron, E., et al., 1995, ApJ, 455, L147
- Patat et al. (1996) Patat, F., Benetti, S., Cappellaro, E. et al. 1996, MNRAS, 278, 111
- Phillips (1993) Phillips M.M., 1993, ApJ, 413, L105
- Phillips et al. (1999) Phillips, M.M., Lira, P., Suntzeff, N.B. et al., 1999, AJ, 118, 1766
- Pignata et al. (2004) Pignata, G., et al., 2004, MNRAS (accepted)
- Riess et al. (1998) Riess, A. G., et al., 1998, AJ, 116, 1009
- Riess et al. (1999) Riess, A., Filippenko, A.V., Li., W., et al. 1999, ApJ, 118, 2675
- Röpke & Hillebrandt (2004) Röpke & Hillebrandt, 2004, A& A (in press) astro-ph/0411667
- Ruiz-Lapuente et al. (2004) Ruiz-Lapuente, P. et al. astro-ph/0410673
- Salvo et al. (2001) Salvo, M.E., Cappellaro, E., Mazzali, P.A., et al. 2001, MNRAS, 321, 254
- Shortridge (2002) Shortridge K., 2002, Star link User Note 86. 20
- Smartt et al. (2004) Smartt, S.J., Patat, F., Meikle, P., & Araujo, S., 2002, IAUC 7961
- Stehle et al. (2004) Stehle, M., Mazzali, P.A., Benetti, S., Hillebrandt, W., 2004, MNRAS (submitted) astro-ph/0409342
- Nomoto et al. (1984) Nomoto K., Thielemann F.-K., Yokoi K., 1984, ApJ, 286, 644
- Wheeler et al. (1998) Wheeler, J.C., Höflich, P., Harkness, R.P., Spyromilio, J., 1998, ApJ, 496, 908
- Wood-Vasey et al. (2002) Wood-Vasey, W.M., Li, W.D., Swift, B., & Ganeshalingam, M., 2002, IAUC 7959