Lopsided spiral galaxies:
evidence for gas accretion
We quantify the degree of lopsidedness for a sample of 149 galaxies observed in the near-infrared from the OSUBGS sample, and try to explain the physical origin of the observed disk lopsidedness. We confirm previous studies, but for a larger sample, that a large fraction of galaxies have significant lopsidedness in their stellar disks, measured as the Fourier amplitude of the component normalised to the average or component in the surface density. Late-type galaxies are found to be more lopsided, while the presence of spiral arms and bars is correlated with disk lopsidedness. We also show that the amplitude is uncorrelated with the presence of companions. Numerical simulations were carried out to study the generation of via different processes: galaxy tidal encounters, galaxy mergers, and external gas accretion with subsequent star formation. These simulations show that galaxy interactions and mergers can trigger strong lopsidedness, but do not explain several independent statistical properties of observed galaxies. To explain all the observational results, it is required that a large fraction of lopsidedness results from cosmological accretion of gas on galactic disks, which can create strongly lopsided disks when this accretion is asymmetrical enough.
Key Words.:
Galaxies: evolution – Galaxies: formation – Galaxies: structure – Galaxies: spiral.1 Introduction
It has been known for a long time that the gaseous component (HI) in galaxies is often strongly asymmetric and lopsided. Baldwin et al. (1980) have first studied this remarkable phenomenon in detail and proposed that the perturbations are waves built from off-centered elliptical orbits that may persist a long time against differential precession. However, they have derived a lifetime that is still not sufficient to explain the high frequency of lopsidedness in neutral gas disks. Richter & Sancisi (1994) have compiled a sample of 1700 galaxies from the literature and noticed on resolved maps of nearby galaxies (like M101) that there is a correspondence between lopsidedness and the global HI velocity profile of the galaxy. It is therefore possible to study the asymmetries directly on the global HI spectrum, for a much larger sample. They derive a lower limit of 50% for the fraction of lopsided galaxies, and conclude that HI asymmetries in disk galaxies are the rule rather than the exception. Lopsidedness is more frequent in late-type galaxies, where Matthews et al. (1998) found a frequency of 77% of HI-distorted profiles. However, it is difficult to get a precise quantitative indicator of the degree of lopsidedness with HI profiles without any spatial resolution.
The ubiquity of lopsidedness may not be the privilege of HI disks. The stellar disk potential, traced by near-infrared light, can be strongly lopsided, even in isolated galaxies, like the spectacular case of NGC 1637 (Block et al. 1994). The stellar light is definitely affected by the phenomenon, as shown by the studies of Rix & Zaritsky (1995) and Zaritsky & Rix (1997) with a total sample of 60 galaxies. They computed the Fourier amplitude of the density, and found that at least one third of these galaxies are significantly lopsided. Kornreich et al. (1998) quantify the asymmetry by comparing the optical light contained within trapezoidal sectors of galactic disks, and find also that 30% of galaxies are very lopsided. In addition to the spatial asymmetry discussed above, some galaxies also display kinematical lopsidedness though this has been less studied (Schoenmakers et al. 1997, Swaters et al. 1999).
To explain the high frequency of lopsidedness, two kinds of arguments have been proposed. First the perturbation might be longer-lived than previously thought, either because the winding out by differential precession is quite long in the outer parts of galaxies (Baldwin et al. 1980), because of weakly damped modes (Weinberg 1994), because of the amplification of density waves (Shu et al. 1990, Syer & Tremaine 1996), or alternatively that the disk is distorted in a lopsided halo (Jog 1997, 2002) or else off-centered with respect to a massive halo (Levine & Sparke 1998, Noordermeer et al. 2001). Second, the perturbations could be forced by tidal interactions (Kornreich et al. 2002) or minor mergers (Zaritsky & Rix 1997). In the last cases, the perturbations could be short-lived, and either lopsided galaxies should be observed with companions or the merger frequency is very high. For instance, Walker et al. (1996) have shown through N-body simulations that a minor merger can result in a lopsided disk with perturbations lasting at least 1 Gyr. But until now, there has been no observed strong correlation between the presence of companions and lopsidedness (Wilcots & Prescott 2004). Thus, what generates the large fraction of lopsidedness in the disks of spiral galaxies remains unknown.
In this paper, we measure the lopsidedness for a larger statistical sample of galaxies, and try to understand the physical origin of the observed disk lopsidedness. In Sect. 2 we quantify the Fourier amplitude of the surface density in a sample of 149 galaxies with available near-infrared images from the Ohio State University Bright Galaxy Survey (OSUBGS, Eskridge et al. 2002). Since the galaxies chosen are not lopsided a priori, this sample is expected to give a definitive measure of lopsidedness in typical disk galaxies. We also measure the HI asymmetry for the present sample of galaxies. The dependence of the degree of lopsidedness versus other physical parameters (presence of companions, bars and spiral arms, and Hubble type) is studied in Sect. 3. In order to understand the origin of the disk lopsidedness, we examine various scenarios via numerical simulations: distant tidal encounters, minor mergers, and gas accretion (Sect. 4). We show that galaxy interactions and mergers are not enough to explain all the properties of the observed galaxies. Cosmological accretion of gas seems to be responsible for a large fraction of lopsided disks. Observations of lopsided disks imply that galaxies have accreted large amounts of gas in past Gyrs, as already expected from the study of barred galaxies (Bournaud & Combes 2002, Block et al. 2002). These results are discussed and we give our conclusions in Sect. 5.
2 Analysis of observations
2.1 The OSUBGS sample
To quantify the amplitude of the mode both in the disk surface density and in the potential, we use near-infrared images from the Ohio State University Bright Galaxy Survey (OSUBGS, Eskridge et al. 2002). This is a magnitude-limited sample drawn from the Third Reference Catalog of Bright Galaxies (RC3, see Vaucouleurs et al. 1991). For a spiral galaxy to be included in OSUBGS sample, its magnitude has to be brighter than 12m, and its diameter less than . According to the RC3, the catalog is at least 95% complete for galaxies this bright. We use the same techniques for deriving the various -Fourier amplitudes as in Block et al. (2002).
From the 174 galaxies in the sample, 171 are appropriate for studies of surface density distribution. We include only galaxies that are inclined up to 70o with respect to the line of sight, which gives a total of 149 galaxies. The choice of this inclination cut-off is justified in Sect. 2.3.
2.2 The bulge/disk decomposition and deprojection
The bulge and disk components are decoupled through radial profile Fitting; the bulge in the center is fitted by an de Vaucouleurs profile, and the disk by an exponential profile.
To deproject the galaxies, a particular 3D shape has to be assumed for each component. We assume the disk is flat, with constant scale-height (which will be varied next). Bulge components are likely to be flattened, but less than disks, and the flattening of the bulge is quite difficult to derive for non edge-on galaxies. In a first study, we do not subtract the bulge in the image, and deproject it together with the disk, assuming that the bulge is as flattened as the disk. In a second study we subtract the bulge light from the image, before deprojecting the disk, and then we add it to the deprojected image, assuming the bulge is spherical. We believe that the two solutions will bracket the actual one, so we record the average value. However we checked that choosing one of the two solutions does not result in any significant change in our analysis of lopsidedness: in the following we mainly study the disk surface density outside of the bulge radius, so that assumptions about the bulge component are not critical.
A constant mass-to-light ratio and a constant scale-height are assumed. The value of amplitude in surface density is computed for three values of the scale-height (225, 325, and 425 pc) and we keep the average value.
2.3 The parameter: Lopsidedness in surface density
2.3.1 Definition
The near-IR light is assumed to be the best tracer of old stars that dominate the stellar mass, less affected by dust extinction or star formation. We compute the Fourier transforms of the stellar surface density, taken from the NIR images.
The surface density is decomposed as:
| (1) |
where the normalised strength of the Fourier component is . Thus, represents the normalized amplitude of the disk lopsidedness at a given radius, and represents the same for an distortion like a bar or spiral arms. The quantity denotes the position angle or the phase of the Fourier component . We further define as the average of the normalized amplitudes between 1.5 and 2.5 exponential radii.
Figure 1 shows a plot of the amplitude and the phase versus radius for NGC 1637, a typical lopsided galaxy (Block et al. 1994); the deprojected density map computed from the near-IR image from the OSUBGS data is shown later in Fig. 18. This illustrates the main features of disk lopsidedness, namely that increases with radius, and the phase is fairly constant with radius in the outer parts. This is the case for most galaxies in our sample, even though there are a few exceptions, and it confirms the previous result by Rix & Zaritsky (1995) for a larger sample studied here.

2.3.2 Statistical properties
The histogram of the parameter is displayed in Fig. 2, and the cumulative function111The cumulative function of displays the fraction of galaxies with larger than the x-axis value of in Fig. 3. The histogram confirms and extends the previous results by Rix & Zaritsky (1995) for a larger sample. A good threshold for deciding that a galaxy is ”lopsided” is : according to our numerical simulations in Sect. 4, a value of larger than 0.05 is unlikely to result from internal mechanisms. Internal mechanisms may in theory trigger asymmetries (e.g., Masset & Tagger 1997), but our simulations shown in Sect. 4, as well as other existing works, do not show strong lopsidedness arising spontaneously without any external perturbation. With this criterion, we find that 63% of the galaxies are lopsided. The mean value of over our sample is 0.11, and 34% of galaxies have larger than this average value.

In the above analysis, we have restricted the sample to galaxies inclined by less than . This value is chosen because the statistical distribution of the parameter is nearly identical whether the cut-off is chosen to be , or (see Fig. 3), and the higher value in this range was chosen as it gives a larger sample which is more useful for a statistical study. For higher values of the cut-off, statistical properties appeared to be changed, for the lopsidedness can no longer be correctly estimated.

2.4 The parameter
We next derive the gravitational potential of each galaxy from the near-infrared images. This potential gives a global estimation of the perturbation of the galaxy disks, but is weighted quite differently from the density distribution. This gives a complementary view of the perturbations, weighted more globally, while the parameter gives values which are weighted more locally.
The image of the galaxy is completed in the 3rd dimension, assuming an isothermal plane with a scale-height constant with radius and equal to 1/12th of the radial scale-length. The gravitational potential is deduced by the Fourier transform method on the grid assuming a constant mass-to-light ratio.
The potential is decomposed as:
| (2) |
We define the strength of the -Fourier component, , and its global strength over the disk as (e.g., Combes & Sanders 1981).
The maximal torque at a given radius is defined by
| (3) |
where represents the maximum amplitude of the tangential force at radius , and is the mean axisymmetric radial force inferred from the =0 component of the gravitational potential. Our interest is focussed here on the component, , defined as the maximum of between 1.5 and 2.5 disk scale-lengths.
We display the histogram of the values of in Fig. 4. This is similar to the histogram for as expected. We prefer to use , the Fourier amplitude of lopsidedness in surface density, as the main indicator of disk lopsidedness since it is a directly measured quantity, and is frequently used in the literature.

2.5 Lopsidedness of gaseous disks
The asymmetries in the HI component have been estimated in a large sample on global velocity profiles by Richter & Sancisi (1994). Since galaxies with interferometric HI maps are rare, they investigate the usability of global HI profiles as tracers of the lopsidedness of the HI disks in galaxies and notice that asymmetries in the global profiles usually correlate with those found on the HI maps. There are, however, cases where the HI map asymmetry does not translate into the HI global profile asymmetry, because of projection effects of the velocity along the line-of-sight, or because the asymmetry changes sign over the disk and conspires to reduce the global projected the perturbation. Therefore the velocity profile tracer is likely to underestimate the asymmetry level.
We gathered HI velocity profiles from the literature for our present sample, in order to estimate the neutral gas lopsidedness. The HI asymmetry was measured in terms of the second criterion from Richter & Sancisi (1994). We first compute the flux ratio between the two halves of the profiles (the two horns), as illustrated in Fig. 5, to compare the mass of the approaching side of the galaxy, and the mass of the receding side. To measure the flux of each horn, we took the total width at 20% of peak flux density, and determined both the extremities of the profile and its center, i.e. the division between the two halves.
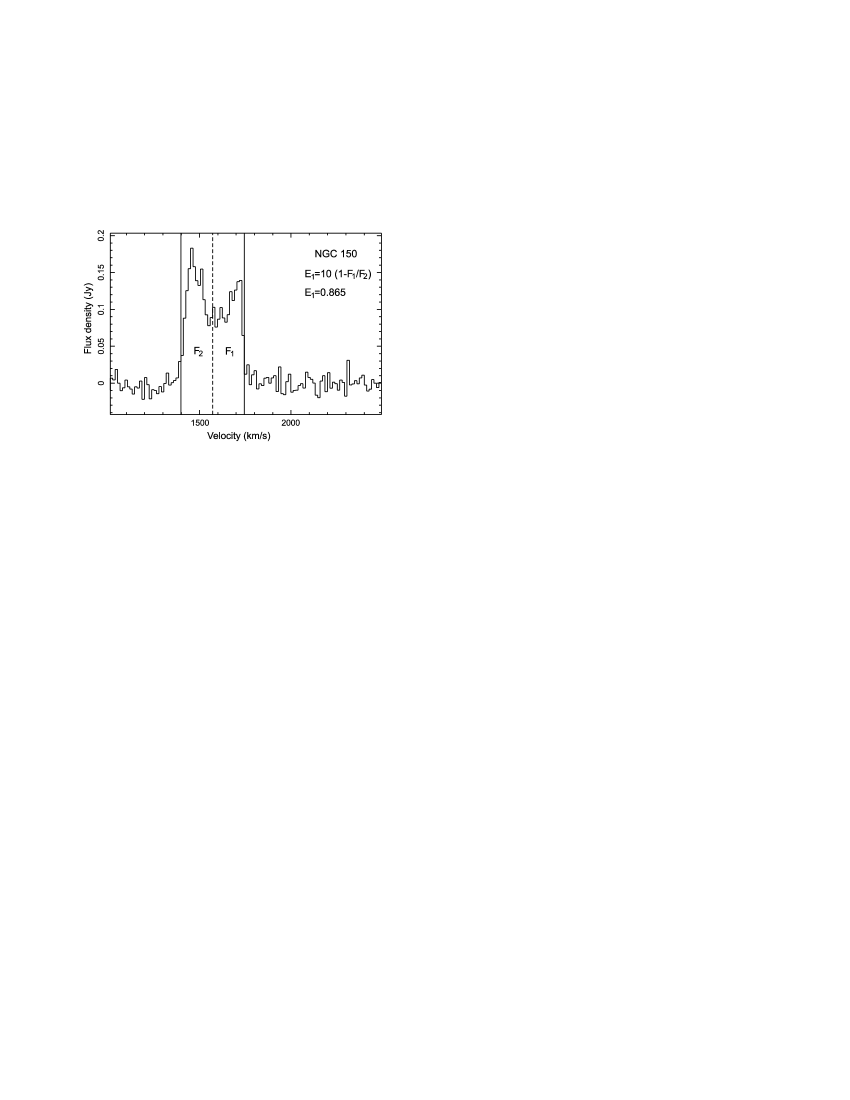
We define the asymmetry parameter as , where is the flux ratio of the two horns of the profile. HI data available for 76 galaxies of our sample. The corresponding histogram of is shown in Fig. 6, which shows that asymmetries in the HI component are very frequent. The asymmetry is larger than 10% ( larger than 1) for nearly two thirds of the galaxies in our sample, while in the stellar component only one third of galaxies have larger than 0.1. Asymmetries of more than 20% ( or ) are also much more common in the HI component than in NIR disks. Even if only provides a lower limit to the actual HI asymmetry, we find that in our sample lopsidedness is even more frequent and stronger in gas than in stars.

3 Dependence of the lopsidedness on various physical parameters
In this section, we study the statistical relations between lopsidedness and other parameters (the Hubble type, the presence of companions, and the presence of asymmetries like arms or bars). The results presented here are for the sample of galaxies below the inclination cut-off of , but we made sure that the results are not artifacts of deprojection by checking that they remain unchanged for a cut-off of and even for a cut-off of when the number of galaxies below was large enough to make this study possible.
3.1 Dependence of on galaxy type
To study the dependence of the lopsidedness on galaxy types, we plot the cumulative functions of for three groups of spiral galaxies in Fig. 7 : the early-types (), the intermediate-types (), and the late-types (). The correspondence between the Hubble type parameter and the Sa–Sd classification of early-type/late-type spiral galaxies, as explained for instance by Binney & Merrifield (1998), is: for Sa, for Sb, for Sc. The number of galaxies with in our sample is not large enough to give any representative result on the extremely late-type systems.

The late-type galaxies have a higher fraction of lopsided galaxies, as can be seen for any value of lopsidedness . This result is similar to what Matthews et al. (1998) found in HI data.
If we had employed instead of , we could think that this correlation between the asymmetry and the Hubble type is an artefact of bulge contamination, since the axisymmetrical contribution of the bulge to the potential reduces the value of in early-type spiral galaxies more than in late-type galaxies, even beyond the bulge radius. However, since we have used the parameter and taken its average value between 1.5 and 2.5 disk scale-length, our results are not affected by bulge contamination, except maybe in a few cases were the bulge has a large radial extent, but this is rare. Then, the correlation between and the Hubble type really means that late-type spirals are more lopsided than early-type ones.
3.2 Comparison of and
In Fig. 8, we show the cumulative distribution of for galaxies that have strong and weak asymmetries, and find that there is a clear correlation between and . A similar result is obtained when we measure as the average value between 0.5 and 1.5 disk scalelengths or between 2.5 and 3.5 disk scalelengths, suggesting that the presence/strength of a lopsidedness is correlated to the presence/strength of asymmetries, whatever the exact nature of this asymmetry (central bar and or outer spiral arms).

3.3 Dependence of on the presence of companions
To quantify the effect of tidal forces, we define the tidal parameter as
| (4) |
where the sum is computed over the companions, is the mass of the galaxy considered, and its scalelength. is the mass of each companion, and its projected distance on the sky. The ratio of masses is estimated from the ratio of blue luminosities. The search of neighbors was done with the NED database, with a search radius of 2.5 degrees on the sky. We take only the companions with measured radial velocities within 500 km s-1.
The parameter values for the most lopsided galaxies are displayed versus the tidal parameter in Fig. 9. No correlation is found. Strong lopsidedness with as large as 0.1 or larger is frequent in isolated galaxies (with ) without any close companion or any sign of a recent merger. NGC 1637 is a well-known example, but there are many other similar objects in our sample. The absence of correlation between strongly lopsided disks and the presence of companions agrees with what Wilcots & Prescott (2004) found. Note that at this stage, it does not rule out interactions/mergers as being responsible for disk lopsidedness: the explanation could be that lopsidedness is very long-lived.

4 Origin of disk lopsidedness
To understand the origin of lopsided disks, what must be explained is not only the frequency and strength of lopsidedness, but also the dependence on the Hubble type and asymmetries and the non-correlation of strong lopsidedness with the presence of interacting companions.
4.1 Scenarios for the origin of lopsidedness
Minor perturbations can spontaneously arise in a disk. For instance, a two-arm spiral structure is never perfectly symmetrical, which results in a non-zero value of . The numerical simulations detailed below, when run for isolated galaxies, show that the value of arising spontaneously in an isolated galaxy rarely exceeds 0.05 (in simulations of isolated galaxies, is smaller than this threshold 88% of the time), and is never as large as 0.1 between 1.5 and 2.5 disk scale-lengths (the inner lopsidedness, at small radii, can be stronger, but is not studied in this paper). Thus, the lopsidedness observed in most spiral galaxies is the result of an external perturbation. Three scenarios to explain a galaxy s becoming significantly lopsided can then be proposed:
-
•
distant interaction with a galaxy of comparable mass. The companion must have a high velocity and/or be distant enough for this encounter not to result in a merger; otherwise the merger remnant would be an elliptical galaxy, while we only have disk galaxies in our sample.
-
•
a minor merger with a small companion, with a mass ratio such as 10:1 or even more: such a companion is not massive enough to transform the system into an elliptical galaxy, but may induce important perturbations like lopsidedness.
-
•
accretion of external gas. If the accretion is asymmetrical, this may result in a lopsided disk, even in the stellar component, when the gas is converted into stars.
We now study these three scenarios in numerical simulations, and compare the results of each scenario with the properties of the observed galaxy sample.
4.2 Numerical techniques
In our N-body code, galaxies are described by particles of stars, gas, and dark-matter. We use particles. The gravitational interactions are computed with the three-dimensional FFT code of Bournaud & Combes (2003) on grids, with a spatial gravitational softening of 300 pc. The dissipative nature of the ISM is modeled by the sticky-particles scheme of Bournaud & Combes (2002), with elasticity parameters . Star formation is described by a generalized Schmidt law (Schmidt 1959), and time-dependent stellar mass-loss is described by a model inspired by Jungwiert et al. (2001). More details about these codes can be found in Bournaud & Combes (2002 and 2003).
Each spiral galaxy is modeled by a stellar and gaseous Toomre disk of scale-length 5 kpc and radius 15 kpc, of mass M☉, a central bulge, and a spherical dark halo. All the components are live (treated with self-gravitating particles) in these simulations. The bulge-to-disk and dark-to-visible mass ratios that we have used, as a function of the Hubble type (Sa–Sd), are given in Table 1. The run parameters for each simulation are given later.
| Type | bulge-to-disk | halo-to-disk |
|---|---|---|
| mass ratio | mass ratio | |
| Sa | 0.5 | 0.4 |
| Sb | 0.3 | 0.5 |
| Sc | 0.2 | 0.6 |
| Sd | 0.1 | 0.8 |
In these simulations we measure , , , and , at each time step, exactly as in observed systems, so that a robust comparison can be made.
4.3 Distant galactic encounters
We first study distant encounters (without mergers) between galaxies of comparable masses. The parameters of the simulations that we ran are shown in Table 2. We focused on situations favorable to the formation of large lopsidedness in the disk. This is mainly the case on retrograde orbits, which is naturally explained by the fact that the pattern speed of asymmetries, , is negative in a galactic disk, in contrast to spiral arms or bars that are more easily triggered on direct orbits, for is positive (e.g., Gérin et al. 1990).
| No | Orient. | (km s-1) | (kpc) | |||
|---|---|---|---|---|---|---|
| 1 | 1:1 | Sb | D | 200 | 220 | 0 |
| 2 | 1:1 | Sb | D | 300 | 130 | 0 |
| 3 | 1:1 | Sb | D | 150 | 350 | 0 |
| 4a | 1:1 | Sa | R | 250 | 130 | 0 |
| 4b | 1:1 | Sb | R | 250 | 130 | 0 |
| 4c | 1:1 | Sc | R | 250 | 130 | 0 |
| 5a | 1:1 | Sa | R | 160 | 300 | 0 |
| 5b | 1:1 | Sb | R | 160 | 300 | 0 |
| 5c | 1:1 | Sc | R | 160 | 300 | 0 |
| 6a | 1:1 | Sa | R | 200 | 220 | 0 |
| 6b | 1:1 | Sb | R | 200 | 220 | 0 |
| 6c | 1:1 | Sc | R | 200 | 220 | 0 |
| 7 | 1:1 | Sb | R | 250 | 130 | 60 |
| 8 | 1:2 | Sb | R | 250 | 130 | 0 |
| 9 | 2:1 | Sb | R | 250 | 130 | 0 |
| 10 | 1:3 | Sb | R | 250 | 130 | 0 |
| 11 | 3:1 | Sb | R | 250 | 130 | 0 |
| 12 | 1:2 | Sb | R | 160 | 300 | 0 |
| 13 | 2:1 | Sb | R | 160 | 300 | 0 |
| 14 | 1:2 | Sb | R | 450 | 450 | 0 |
| 15 | 2:1 | Sb | R | 450 | 450 | 0 |

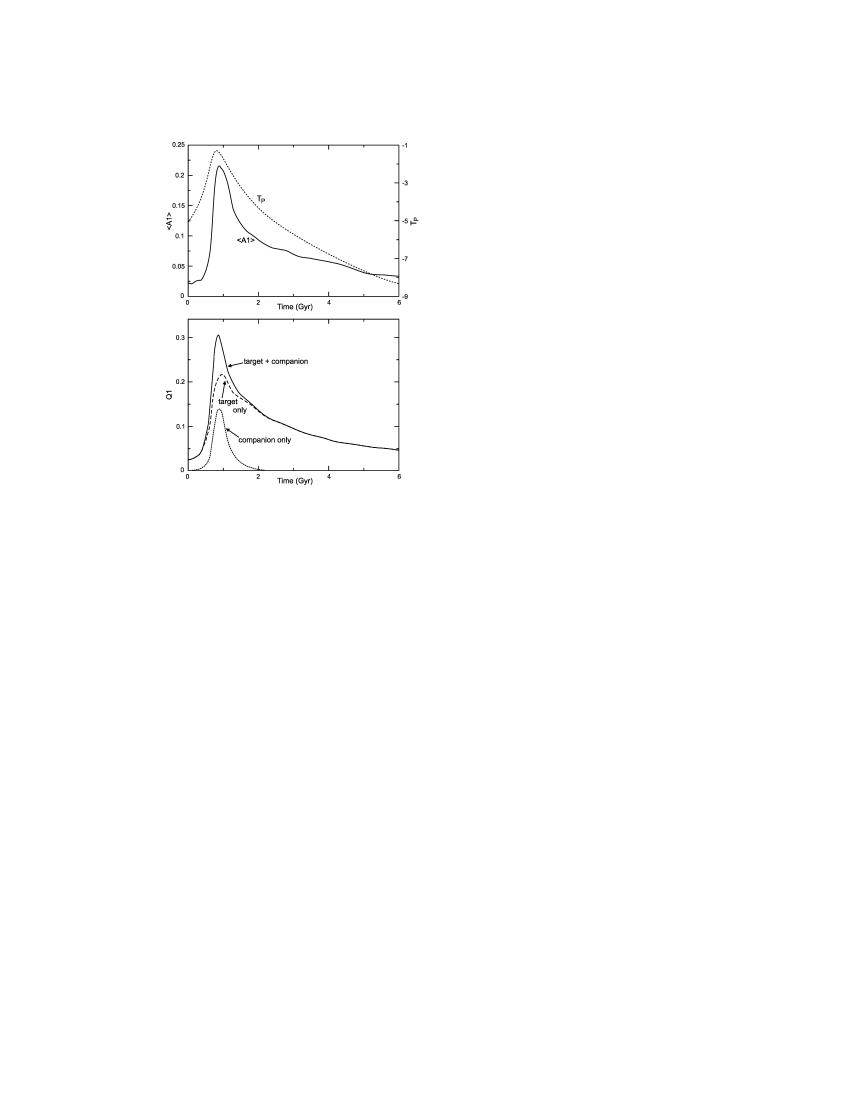
The temporal evolution of the parameter for a representative case (Run 9) is shown in Fig. 10. During the interaction itself, a strong lopsidedness with values of higher than 0.15 is triggered. It is short-lived, lasting for about 500 Myrs. After that, a moderate but long-lived mode is observed during at least 4 Gyrs. All the simulations of distant galaxy interactions show the same behavior. This result is explained by analysing of the potential in terms of the parameter, shown in Fig. 10. The strong peak in and observed during the interaction is supported for one part by the internal potential of the target galaxy, and for the other part by the external potential of the companion that pulls-up the disk. When the companion has left, only the part supported by the target galaxy potential remains; this mode is long-lived, but weaker than the peak observed in and in , during the interaction.
As a consequence of this temporal evolution, a strong lopsidedness is only observed when the companion is still close to the galaxy. This is the case in all the simulations, as shown in Fig. 11 with the largest value of over our whole simulation sample as a function of the tidal parameter. Even over the whole parameter space that we have covered, we never find a lopsidedness that is long-lived enough and strong enough to result in values higher than 0.1 in galaxies that appear very isolated. Strong lopsidedness, with of 0.15 or more, are found only when the tidal parameter is larger than in this scenario: depending on the mass ratio, this typically implies that the companion is within a few hundreds of kpc from the galaxy, and has not left the scene yet.
4.4 Minor galaxy mergers
| No | Orient. | ||||||
|---|---|---|---|---|---|---|---|
| km s-1 | kpc | isolated | |||||
| 1 | 10:1 | Sb | D | 100 | 50 | 0 | 0.08 |
| 2a | 10:1 | Sa | R | 100 | 50 | 0 | 0.11 |
| 2b | 10:1 | Sb | R | 100 | 50 | 0 | 0.12 |
| 2c | 10:1 | Sc | R | 100 | 50 | 0 | 0.11 |
| 3 | 10:1 | Sb | D | 150 | 30 | 0 | 0.07 |
| 4a | 10:1 | Sa | R | 150 | 30 | 0 | 0.11 |
| 4b | 10:1 | Sb | R | 150 | 30 | 0 | 0.10 |
| 4c | 10:1 | Sc | R | 150 | 30 | 0 | 0.11 |
| 5 | 10:1 | Sb | D | 60 | 40 | 0 | 0.09 |
| 6a | 10:1 | Sa | R | 60 | 40 | 0 | 0.11 |
| 6b | 10:1 | Sb | R | 60 | 40 | 0 | 0.13 |
| 6c | 10:1 | Sc | R | 60 | 40 | 0 | 0.12 |
| 7 | 20:1 | Sb | D | 100 | 50 | 0 | 0.07 |
| 8a | 20:1 | Sa | R | 100 | 50 | 0 | 0.10 |
| 8b | 20:1 | Sb | R | 100 | 50 | 0 | 0.10 |
| 8c | 20:1 | Sc | R | 100 | 50 | 0 | 0.12 |
| 9 | 20:1 | Sb | D | 150 | 30 | 0 | 0.08 |
| 10 | 20:1 | Sb | R | 150 | 30 | 0 | 0.11 |
| 11 | 10:1 | Sb | R | 60 | 40 | 60 | 0.09 |
| 12 | 10:1 | Sb | R | 100 | 50 | 60 | 0.10 |
| 13 | 20:1 | Sb | R | 200 | 30 | 0 | 0.09 |
| 14 | 10:1 | Sb | R | 200 | 50 | 0 | 0.11 |
| 15 | 7:1 | Sb | R | 60 | 40 | 0 | 0.13 |
| 16 | 7:1 | Sb | R | 100 | 50 | 0 | 0.13 |
| 17 | 7:1 | Sb | R | 150 | 30 | 0 | 0.14 |
The second scenario that we study is the merger with a minor companion. Walker et al. (1996) have already found that this process can form significant disk lopsidedness, visible for at least 1 Gyr in their simulations . The corresponding run parameters are given in Table 3. Again, the most favorable cases are on retrograde orbits. A mass ratio of 10:1 can trigger significant lopsidedness. Mergers with smaller mass ratios, such as 7:1, are even more efficient for triggering modes, but they will also lead to major disturbances of the system (see Bournaud et al. 2004, 2005), making the galaxy become an extremely early-type spiral or even an S0-like object, so they are not good candidates for the formation of lopsidedness in spiral galaxies in general, and we do not simulate mass ratios larger than 7:1. At the opposite, large mass ratios like 20:1 trigger weaker lopsidedness with typical values of smaller than 0.1. We have not studied mass ratios larger than 20:1 that cannot be the clue to the frequent lopsidedness with that is observed.
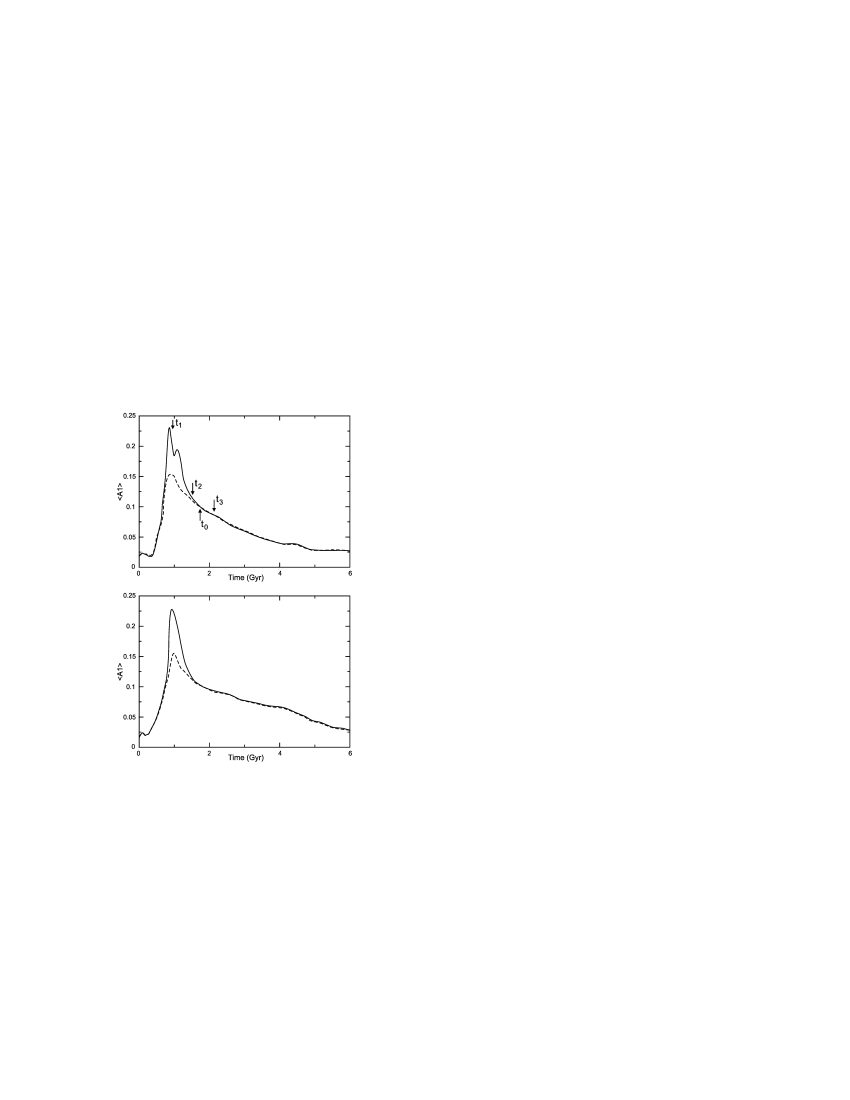
The temporal evolution of in a minor merger (see Fig. 12 for runs 4b and 6c) is fairly similar to what occurs in distant galactic encounters without mergers. A very strong lopsidedness is triggered during the merger with values of that can be larger than 0.2, but this lasts typically no more than 500 Myrs. Later on, a long-lived mode is still present, but is weaker with values of not much larger than 0.1. The strong peak in observed during the merger is mainly related to the very asymmetric distribution of the stars from the companion; we find a lower value of when we only consider the target galaxy material (see Fig. 12). After 2–3 rotations, the companion stars are mixed in the system and follow the same azimuthal distribution as the other stars – even if their radial distribution is different. The value of is then smaller, but present in all the stars, regardless of whether stars from the companion are included in the analysis or not.
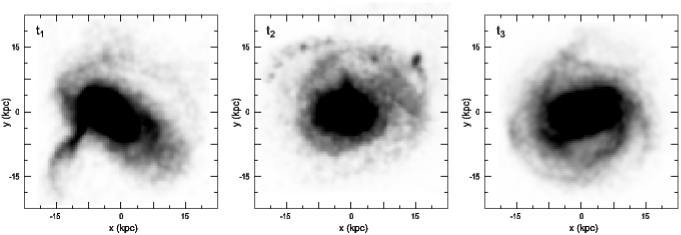
Can minor mergers create a strong lopsidedness when the galaxy appears ”isolated”, once the most obvious merger-related features have disappeared? A strong lopsidedness does arise only during the merger, but the galaxy is then largely disturbed and would be classified as an ”on-going merger”, rather than as an ”isolated galaxy”. The question is then to know whether a strong lopsidedness can still be present when the merger is relaxed and the galaxy looks ”isolated”. As explained, the highest values of are observed when the azimuthal distribution of the stars of the companion is very different from the distribution of the other stars, at the instant called on Fig. 12. This big difference in the two stellar components is enough to attest that a merger is occurring, and the visual aspect of the system clearly shows that it is an ongoing merger, not an isolated object (see Fig. 13). Even at time , when including or not the stars from the companion does not largely change the value of , there are still indicators that a recent merger has occurred, such as streams or tidal debris (see Fig. 13). It’s only at time , a few dynamical times later, that the system looks like an ”isolated” galaxy – but the value of is then twice lower than at . Thus, the galaxy can look ”isolated” only after we find similar values of with and without including the stars from the companion. Before this time, there is evidence that it is an ”ongoing merger”. Then, in Table 3, we included in the value of at the instant when the stars from the companion are azimuthally mixed in the system (called in Fig. 12). The result is that, while the value of can be larger than 0.20 during the merger itself, the lopsidedness is much more modest once the merger remnant looks relaxed and can be classified as an ”isolated” galaxy: at this moment, the value of is typically and is always smaller than 0.15, even for the not-so-minor 7:1 mergers – mergers with companions more massive than 7:1 are not considered, for the merger remnant is not a typical spiral-like system any more (see Bournaud et al. 2005).
4.5 Difficulties with the galaxy interaction/merger scenarios
Galaxy interactions, either distant encounters or minor mergers, can trigger strong lopsidedness. The galaxy can still be lopsided a few Gyrs after the event. However, several observational results cannot be explained by these scenarios.
Isolated galaxies that are strongly lopsided.
As mentioned in Sect. 3, no correlation has been found between the strongest lopsidedness and the presence of interacting companions. Strong lopsidedness with are frequently found in galaxies that are very isolated and do not show any sign of a recent merger.
This does not directly rule out galaxy interactions as responsible for lopsided disks, because a strong lopsidedness may a priori still be observed long after the interaction/merger, when no sign of it is observable any more. However, our simulations show that in the case of distant interactions with massive companions, the strongest lopsidedness can only be observed during the interaction, when the companion is still rather close, so that the strong lopsidedness with in very isolated galaxies (tidal parameter of to ) that are frequently observed cannot be explained; on the contrary, with this scenario, a correlation of with the tidal parameter is expected, at least for the most lopsided galaxies. Minor mergers do not provide a better explanation, since the lopsidedness is very strong only during the merger itself, when the stellar population of the companion is not yet mixed in the disk, with other visible indicators that a merger has occurred recently (tidal tails, streams from the companions, etc.). Strong lopsidedness in galaxies that do not show any evidence of a recent merger and no massive interacting companion (like NGC 1637, M 101, and many others) cannot be accounted for.
Correlation with asymmetries.
We have shown in Sect. 3 that lopsidedness is correlated with the strength of asymmetries (spiral arms and/or bars). This result could have no relation with the physical origin of lopsidedness, for it could simply be that both lopsidedness and asymmetries are spontaneously stronger in the same type of galaxies. However there are at least two pieces of evidence that it is not the case: (i) lopsidedness is stronger in late-type galaxies (Sect. 3 and Fig. 7), while spiral arms/bars are stronger in early-type spiral galaxies (e.g. Elmegreen & Elmegreen 1985, and also our own sample, see Fig. 14), and (ii) when we take only early-type or late-type spirals, the dependence between and remains as strong as for the whole sample (see Fig. 15). The correlation between and is thus related to the formation of lopsidedness and asymmetries. Yet, galaxy interactions/mergers do not explain it because: (i) the strongest lopsidedness are triggered on retrograde orbits, while (ii) asymmetries are triggered on prograde orbits; on retrograde orbits they are not triggered but can instead be weakened (e.g., Gérin et al. 1990, Noguchi 1996). One would then expect weaker asymmetries in the most lopsided galaxies, which contradicts of the observational reality. The dependence observed between and cannot be explained if one assumes that galaxy interactions are responsible most of the observed lopsidedness.


Correlation with Hubble type.
We have shown that there is a dependence of on the galaxy type: late-type spiral galaxies are much more lopsided than early-type ones. The same result has been found in gaseous disks by Matthews et al. (1998). This could mean that it is easier to trigger a strong lopsidedness in a late-type galaxy. However, simulations of interactions and mergers do not show significantly larger lopsidedness in late-types (there might be a small dependence on the Hubble type in simulations, but not as large as the observed one). Then, lopsidedness does not seem to be intrinsically stronger in late-type galaxies. The dependence on the observed Hubble Type must be a result of the formation mechanism, but it cannot be explained by galaxy interaction scenarios.
Lopsidedness is not only stronger in late-type galaxies, where there are more values of than in early-type (see Fig. 7), they are also more frequent in late-type galaxies: if we choose the threshold for a galaxy to be regarded as lopsided at , as suggested by our simulations, then 96% of late-type galaxies are lopsided, while only 62% of early-type spiral disks are lopsided (and this difference still holds if we chose another threshold). While galaxy interactions could have a priori explained that lopsidedness is stronger in late types (even when the simulations finally show they do not), they cannot explain at all why it is more frequent. On the contrary, a galaxy interaction makes the system become earlier-type. For the minor mergers, that are much more likely than distant equal-mass interactions, we have shown that the merger must not be too minor to trigger strong lopsidedness: mass ratios such as 10:1 or 7:1 are efficient, but 20:1 mergers are already much less efficient. According to our recent study of galaxy mergers (Bournaud et al. 2005), a 10:1 merger is enough to make the system evolve significantly towards early-type (more massive bulge, thicker disk, less gas), especially on retrograde orbits; and a 7:1 merger can even convert a typical spiral galaxy into a S0-like object. This evolution towards early-type is significant enough to be observable. Indeed, the variations in the bulge masses, velocity dispersions, and disk thickness, that result from a 10:1 merger correspond to a decrease in the Hubble type indicator by a few units. So, minor mergers would at the same time trigger an asymmetry and make the system become earlier-type. Distant galaxy interactions also would trigger lopsidedness and make the system become significantly earlier-type at the same time.
Thus, the galaxy interaction/merger scenarios would tend to create more lopsidedness in early-type galaxies, because even if the galaxy is not early-type before the interaction, it will become early-type during the interaction itself, especially for the strongest lopsidedness for which a strong interaction/merger is required. An anti-correlation between and the Hubble type would then be expected if all the disk lopsidedness were the results of galaxy interactions/mergers. But the observational result is that lopsidedness is stronger and more frequent in late-type galaxies, which the interaction/merger scenarios fail to explain.
Conclusion
Several properties of lopsided galaxies, derived from our observed sample in Sect. 3, cannot be explained if one assumes that disk lopsidedness is mostly the result of galaxy interactions or mergers.
We do not deny that distant galaxy interactions and minor mergers are responsible for the observed lopsidedness in some galaxies. This is shown by our simulations as well as previous works; and since interactions/mergers do occur in the Universe, they have triggered some of the observed lopsidedness. But we find that all the lopsided disks cannot be the result of these processes, for otherwise many observational properties could not be explained at all. We cannot give the exact fraction of lopsidedness that is not the result of galactic interactions, but it must be large enough to account for the overall statistical properties of our sample, so it is certainly several tens of percent.
4.6 Gas accretion
Simulations of gas accretion
Since a large fraction of lopsided disks are not the result of galaxy interactions and mergers and not the results of internal processes (that rarely lead to values larger than 0.05, as mentioned in Sect. 4.1), another scenario for making a galaxy lopsided must be proposed. We can then imagine that lopsidedness is the result of gas accretion. Standard cosmological models predict that galaxies accrete large amounts of gas along cosmological filaments (e.g., Keres et al. 2004). The mass accreted over a few billion years represents a significant fraction of the disk mass itself. This accretion not only fuels the gaseous disk, but also the stellar one, through star formation. It has already been shown that gas accretion fueling both the gaseous and stellar disk can be responsible both for the maintenance of spiral arms during a Hubble time, while spiral arms in isolated models generally do not last more than 2–3 Gyrs, and for the reformation of bars if they have been dissolved either by a merger or by an internal mechanism (Bournaud & Combes 2002, Block et al. 2002).
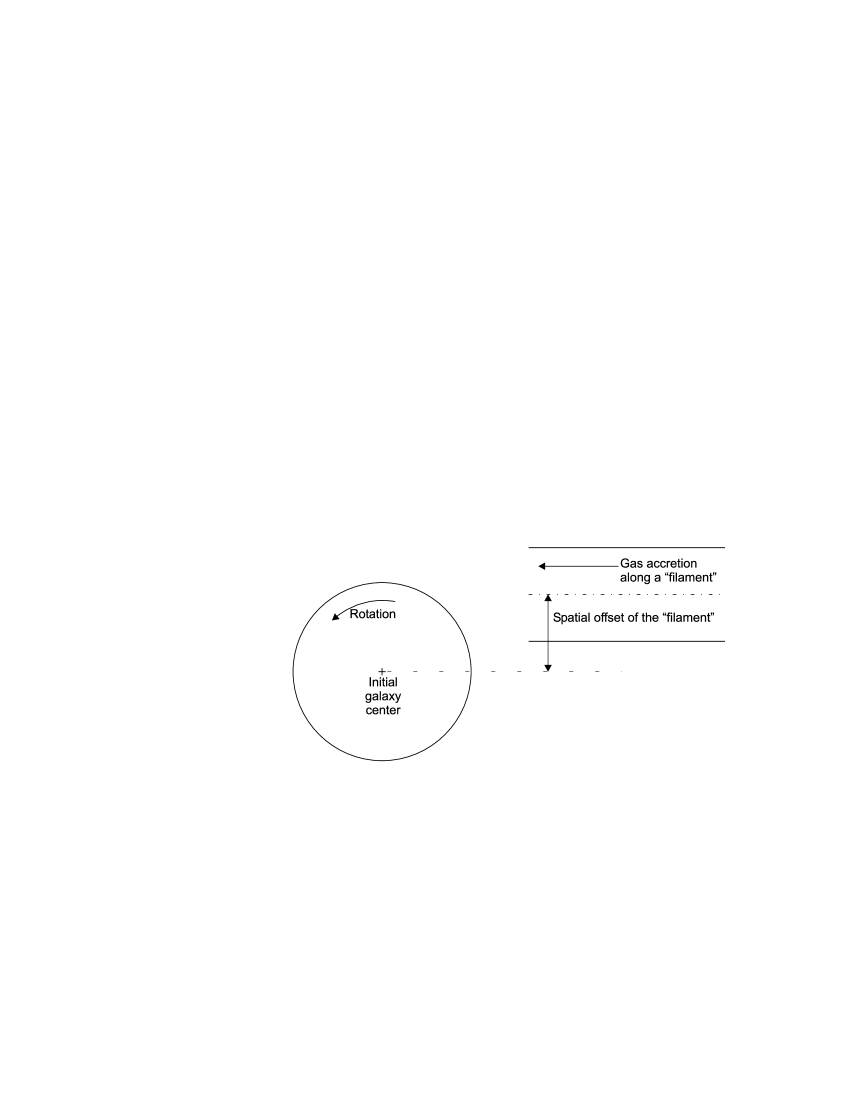
This accretion can be asymmetrical, since distributed along a few filaments, and the accretion rate can be different for each filament. This can then trigger an asymmetry in the disk. In this paper we do not try to simulate ”realistic” accretion conditions predicted in detail by any cosmological model, but simply to understand whether asymmetrical accretion of gas and subsequent star formation can create a significantly lopsided disk. To this aim, we first consider accretion along one single filament, off-centered with respect to the galaxy (see Fig. 16), and will discuss more realistic cases with several filaments next. The velocity distribution of the accreted gas is assumed to be the same as in the outer disk. We ran simulations for accretion rates of 3, 6, and 9 Myr-1. Typical values of in this model are given in Table 4. The temporal evolution of is shown in Fig. 17 for two cases.
| No | T | offset | mean | |
|---|---|---|---|---|
| 1 | Sb | 6 | 15 kpc | 0.12 |
| 2 | Sb | 6 | 25 kpc | 0.16 |
| 3 | Sb | 6 | 40 kpc | 0.15 |
| 4 | Sb | 3 | 25 kpc | 0.11 |
| 5a | Sa | 9 | 25 kpc | 0.18 |
| 5c | Sc | 9 | 25 kpc | 0.21 |

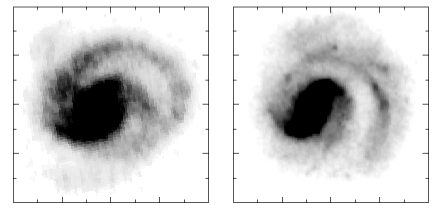
The main result of these simulations is thus that asymmetrical accretion of gas can create strong asymmetries, even in the stellar component after the formation of stars. The degree of lopsidedness decreases after a few Gyrs, even if accretion is not stopped, because the disk re-orients itself in regard to the filament. When accretion is very asymmetrical, as in our model with one filament, the values of can be as strong as in the extreme observed cases. This single-filament model is very arbitrary, and for a real galaxy it is more likely that there are several filaments with different accretion rates (e.g., Semelin & Combes 2005). Then, the lopsidedness will generally be more moderate; however, it will remain true in such a realistic situation that asymmetrical gas accretion results in a lopsided disk. Indeed, we ran some simulations with 2 and 3 filaments and with different accretion rates for each filament: there is still a strong lopsidedness, that can reach values of larger than 0.10. We show for instance one case, that fits the morphology of NGC 1637, in Fig. 18.
When accretion is stopped in the simulation, the lopsidedness has a typical lifetime of 3 Gyrs (see Fig. 17). It is thus rather long-lived, but its lifetime seems a bit smaller than in the minor merger and distant interaction scenarios. This is maybe due to the smaller perturbations of the halo in the case of gas accretion, while the halo can help to make an mode long-lived (e.g., Jog 1997). However, a detailed understanding of the lifetime of lopsidedness in each scenario is beyond the scope of this paper.
Lopsidedness and other properties
Gas accretion can be the clue to explaining strong lopsidedness in galaxies that have no sign of recent interaction/merger. We have shown that disks do not remain strongly lopsided long enough for these situations to be explained by mergers or interactions that have occurred long ago. With the accretion of gas, we can explain such cases, as for instance NGC 1637, the morphology of which is well reproduced in one of our simulations with accretion along 2 filaments (see Fig. 18). If asymmetrical accretion of gas with high rates is frequent, strong lopsidedness in isolated galaxies can be frequent, too.
The relation between and is also a natural consequence of gas accretion, for this favors both lopsidedness and arms/bars at the same time (Bournaud & Combes 2002). This scenario can thus explain why disks with strong asymmetries are more lopsided.
Gas accretion can also explain why there is a higher fraction of lopsidedness and stronger lopsidedness in late-type galaxies. First, late-type galaxies are generally less massive than early-type, so if they accrete gas at the same absolute rate, this can represent a large relative amount of mass and trigger a larger lopsidedness. Second, late-type galaxies contain more gas, which could be due to the fact that they have accreted gas more recently (but there are other possible explanations). Finally, gas accretion tends to make a galaxy evolve towards late-type (Bournaud & Combes 2002), so the most lopsided galaxies in this scenario would naturally tend to be later-type, in contrast to what occurs with galaxy mergers that can trigger strong lopsidedness but make the galaxy become earlier-type at the same time. The correlation between and the Hubble type would thus be naturally explained in the frame of cosmological gas accretion.
Then, the observational results that were not explained correctly by the interaction and merger scenarios can be accounted for by gas accretion. Interactions and mergers can still produce lopsidedness in a large number of galaxies, but it is required that a large fraction of lopsided disks are the result of accretion to explain observational properties of galaxies.
This is fully compatible with the high fraction of lopsided disks in HI (Sect. 2.5). Indeed, this observational result does not rule out that some lopsidedness can be caused by galaxy interactions or mergers, but at least it agrees with the accretion scenario, according to which gaseous disks should be at least as lopsided as stellar disks.
5 Discussion and conclusion
We measured the Fourier amplitudes of the component indicating lopsidedness in the stellar disk for a sample of 149 galaxies observed in the NIR, 149 of them suitable for the study of lopsidedness (inclined by less than 70 degrees). At least two thirds of these galaxies are found to be significantly lopsided, in the sense that the asymmetry is too large to simply result from internal mechanisms ( larger than 0.05). The mean value of in our sample of galaxies is 0.11, and 34% of the galaxies show values higher than this. We have shown that disks are more lopsided in late-type galaxies, s well as when the asymmetries (bars and spiral arms) are strong. However, the presence of a strongly lopsided disk is uncorrelated to the presence of interacting companions. Many isolated galaxies with no evidence of a recent interaction or merger are strongly lopsided.
Our numerical simulations seek to understand the physical origin of lopsidedness in spiral galaxies. We first studied distant tidal interactions between galaxies, and minor galaxy mergers (not major mergers, for they result in elliptical-like systems). The second scenario is much more likely. In both situations, strong lopsidedness can arise. Yet, both scenarios fail to explain the large frequency of strong lopsidedness in galaxies that are very isolated with no companion and no sign of a recent merger. They also contradict the observed correlations of the disk lopsidedness with the Hubble type, and with the presence of asymmetries. We then simulated an arbitrary model of accretion along one single filament, but also more realistic cases with several filaments, which can explain both the statistical properties of the sample and the morphology of some well-known cases.
Our study is based not only on the quantitative values of , but also on qualitative relations between and other parameters. This is important, for the quantitative comparison of values alone could be questioned, as there might be some systematic differences between the density in simulations and the observed ”density” computed from NIR images, especially if the mass-to-light ratio of stars varies with radius. However, this does not affect the dependence of on other physical quantities. Both results (values of and dependence on other parameters) led us to the same conclusion, which is therefore robust.
As for the possibility that disk lopsidedness could simply result from internal mechanisms, suggested for instance by Masset & Tagger (1997), we do not rule it out; but in our simulations, as well as in many other numerical works in the literature, we have never observed strong lopsidedness arising spontaneously in disks. Internal mechanisms are found to lead only to values of typically smaller than 0.05, so they are not the clue to the origin of the observed disk lopsidedness222Internal mechanisms are not found to lead to high values of between 1.5 and 2.5 disk scale-length, but they can trigger stronger lopsidedness at smaller radii. They may be responsible for strong inner lopsidedness, but cannot account for the large-scale lopsidedness studied in this paper, since is larger than 0.05 in most spiral galaxies. Internal mechanisms could only explain the weakest lopsidedness in our sample.
To explain the observations, we show that a large fraction of lopsided disks result from accretion of gas, with a typical accretion rate that corresponds to doubling the disk mass in about 10 Gyrs, in agreement with the predictions by Block et al. (2002). Observations of lopsidedness in HI disks, as traced by the lopsidedness of the global HI profiles, agree with this accretion scenario, but NIR observations of stellar disks enable a better quantitative study than HI velocity profiles without spatial resolution.
Large accretion rates of a few Myr-1 along cosmological filaments may explain both the ubiquity of lopsidedness (this paper) and of spiral arms and bars (Bournaud & Combes 2002 and Block et al. 2002). In both cases of and asymmetries star formation makes the effects of gas accretion visible in the stellar component. The results presented here for lopsidedness can even be considered as more robust than our previous study based on bars. First, deprojection affects bars more than lopsidedness. Galactic disks are never perfectly round, even in their outer parts, so there is an uncertainty on the disk inclination, and the associated error in the deprojection will bias the asymmetry, but not the one; so this observational concern is absent in the present study. Second, the present conclusions are supported not only by the quantitative values of the asymmetry, but also by correlations with other physical parameters, providing several independent proofs of gas accretion. Third, lopsidedness mainly concerns large-scale outer disks, while bars are coupled with inner gas inflows and nuclear bars. The relative resolution of simulations is higher in the outer disk, so results on disk lopsidedness are likely to be more robust than results concerning bars. Then, we find a robust confirmation of the result inferred from the study of bars in Block et al. (2002): without denying the role of interactions and mergers in the evolution of galaxies, we here find a new evidence that large-scale gas accretion must play a major role in the morphological properties of galaxies.
Appendix A and asymmetries in the OSUBGS sample
This appendix gives the values of for and , as defined in Sect. 2.3, for each galaxy in our sample, and the inclination angle used to compute these values.
| Name | |||
|---|---|---|---|
| IC 5325 | 47.09 | 0.035 | 0.026 |
| NGC 150 | 63.70 | 0.043 | 0.130 |
| NGC 157 | 55.01 | 0.111 | 0.079 |
| NGC 210 | 53.66 | 0.050 | 0.072 |
| NGC 278 | 3.24 | 0.036 | 0.022 |
| NGC 289 | 39.50 | 0.093 | 0.059 |
| NGC 428 | 51.14 | 0.145 | 0.037 |
| NGC 488 | 43.32 | 0.034 | 0.018 |
| NGC 578 | 53.72 | 0.100 | 0.058 |
| NGC 613 | 49.77 | 0.018 | 0.110 |
| NGC 625 | 90.00 | 0.075 | 0.030 |
| NGC 685 | 34.21 | 0.036 | 0.053 |
| NGC 779 | 73.75 | 0.029 | 0.070 |
| NGC 864 | 47.94 | 0.123 | 0.090 |
| NGC 908 | 67.90 | 0.096 | 0.038 |
| NGC 988 | 61.30 | 0.066 | 0.073 |
| NGC 1003 | 75.70 | 0.242 | 0.022 |
| NGC 1042 | 61.10 | 0.055 | 0.083 |
| NGC 1058 | 45.36 | 0.090 | 0.017 |
| NGC 1073 | 38.28 | 0.168 | 0.139 |
| NGC 1084 | 52.20 | 0.041 | 0.030 |
| NGC 1087 | 54.19 | 0.060 | 0.075 |
| NGC 1187 | 48.50 | 0.147 | 0.048 |
| NGC 1241 | 56.86 | 0.101 | 0.075 |
| NGC 1300 | 58.81 | 0.096 | 0.103 |
| NGC 1302 | 27.49 | 0.030 | 0.054 |
| NGC 1309 | 15.95 | 0.154 | 0.048 |
| NGC 1317 | 31.99 | 0.020 | 0.046 |
| NGC 1350 | 64.10 | 0.028 | 0.086 |
| NGC 1371 | 51.30 | 0.048 | 0.050 |
| NGC 1385 | 49.00 | 0.232 | 0.130 |
| NGC 1421 | 83.47 | 0.102 | 0.119 |
| NGC 1493 | 20.31 | 0.055 | 0.049 |
| NGC 1511 | 79.83 | 0.114 | 0.064 |
| NGC 1559 | 58.15 | 0.186 | 0.030 |
| NGC 1617 | 68.31 | 0.079 | 0.040 |
| NGC 1637 | 31.73 | 0.186 | 0.070 |
| NGC 1703 | 20.49 | 0.144 | 0.019 |
| NGC 1792 | 65.09 | 0.116 | 0.034 |
| NGC 1808 | 70.19 | 0.281 | 0.090 |
| NGC 1832 | 61.48 | 0.056 | 0.057 |
| NGC 1964 | 69.39 | 0.063 | 0.074 |
| NGC 2090 | 63.79 | 0.201 | 0.033 |
| NGC 2139 | 40.38 | 0.086 | 0.079 |
| NGC 2196 | 40.98 | 0.066 | 0.036 |
| NGC 2280 | 64.24 | 0.154 | 0.076 |
| NGC 2442 | 49.88 | 0.196 | 0.127 |
| NGC 2566 | 60.19 | 0.054 | 0.102 |
| NGC 2775 | 40.42 | 0.195 | 0.019 |
| NGC 2964 | 53.53 | 0.093 | 0.094 |
| NGC 3059 | 21.40 | 0.409 | 0.073 |
| Name | |||
|---|---|---|---|
| NGC 3166 | 66.57 | 0.204 | 0.162 |
| NGC 3169 | 62.82 | 0.043 | 0.035 |
| NGC 3223 | 51.37 | 0.110 | 0.037 |
| NGC 3227 | 58.84 | 0.209 | 0.076 |
| NGC 3261 | 43.05 | 0.113 | 0.079 |
| NGC 3275 | 43.06 | 0.055 | 0.057 |
| NGC 3319 | 59.12 | 0.596 | 0.122 |
| NGC 3338 | 54.53 | 0.076 | 0.023 |
| NGC 3423 | 35.66 | 0.146 | 0.026 |
| NGC 3504 | 26.17 | 0.036 | 0.079 |
| NGC 3507 | 30.22 | 0.047 | 0.061 |
| NGC 3511 | 81.96 | 0.055 | 0.035 |
| NGC 3513 | 46.45 | 0.066 | 0.084 |
| NGC 3583 | 55.18 | 0.020 | 0.100 |
| NGC 3593 | 76.26 | 0.018 | 0.012 |
| NGC 3596 | 8.79 | 0.161 | 0.059 |
| NGC 3646 | 60.57 | 0.400 | 0.037 |
| NGC 3675 | 58.37 | 0.020 | 0.028 |
| NGC 3681 | 33.17 | 0.030 | 0.027 |
| NGC 3684 | 50.58 | 0.533 | 0.032 |
| NGC 3686 | 40.91 | 0.078 | 0.055 |
| NGC 3726 | 49.07 | 0.080 | 0.058 |
| NGC 3810 | 47.78 | 0.044 | 0.036 |
| NGC 3877 | 82.93 | 0.059 | 0.093 |
| NGC 3885 | 78.93 | 0.022 | 0.093 |
| NGC 3887 | 39.77 | 0.163 | 0.064 |
| NGC 3893 | 59.14 | 0.139 | 0.056 |
| NGC 3938 | 12.98 | 0.067 | 0.020 |
| NGC 3949 | 56.37 | 0.072 | 0.022 |
| NGC 4027 | 48.96 | 0.201 | 0.113 |
| NGC 4030 | 42.19 | 0.030 | 0.034 |
| NGC 4051 | 28.82 | 0.107 | 0.058 |
| NGC 4062 | 68.40 | 0.025 | 0.030 |
| NGC 4100 | 78.45 | 0.039 | 0.052 |
| NGC 4111 | 90.00 | 0.031 | 0.139 |
| NGC 4123 | 47.68 | 0.047 | 0.115 |
| NGC 4136 | 21.98 | 0.077 | 0.040 |
| NGC 4138 | 61.62 | 0.018 | 0.018 |
| NGC 4145 | 55.15 | 0.038 | 0.027 |
| NGC 4151 | 39.99 | 0.082 | 0.111 |
| NGC 4178 | 90.00 | 0.087 | 0.106 |
| NGC 4212 | 53.60 | 0.081 | 0.030 |
| NGC 4242 | 52.28 | 0.032 | 0.039 |
| NGC 4254 | 29.07 | 0.122 | 0.040 |
| NGC 4293 | 66.52 | 0.030 | 0.087 |
| NGC 4303 | 19.29 | 0.127 | 0.073 |
| NGC 4314 | 19.13 | 0.066 | 0.164 |
| NGC 4388 | 90.00 | 0.058 | 0.061 |
| NGC 4394 | 19.47 | 0.044 | 0.123 |
| NGC 4414 | 56.49 | 0.035 | 0.025 |
| NGC 4448 | 60.05 | 0.033 | 0.145 |
| NGC 4450 | 42.65 | 0.023 | 0.067 |
| NGC 4457 | 33.95 | 0.219 | 0.030 |
| NGC 4487 | 55.13 | 0.056 | 0.025 |
| NGC 4490 | 66.21 | 0.172 | 0.043 |
| NGC 4504 | 52.47 | 0.042 | 0.048 |
| NGC 4527 | 75.02 | 0.034 | 0.073 |
| NGC 4548 | 35.02 | 0.062 | 0.128 |
| NGC 4571 | 25.93 | 0.027 | 0.011 |
| NGC 4579 | 38.82 | 0.037 | 0.085 |
| NGC 4580 | 48.43 | 0.022 | 0.027 |
| Name | |||
|---|---|---|---|
| NGC 4593 | 54.91 | 0.027 | 0.062 |
| NGC 4618 | 44.54 | 0.299 | 0.083 |
| NGC 4643 | 29.92 | 0.057 | 0.157 |
| NGC 4651 | 49.97 | 0.031 | 0.018 |
| NGC 4654 | 57.69 | 0.143 | 0.029 |
| NGC 4665 | 0.00 | 0.009 | 0.127 |
| NGC 4666 | 74.57 | 0.069 | 0.019 |
| NGC 4689 | 39.39 | 0.030 | 0.014 |
| NGC 4698 | 58.75 | 0.028 | 0.067 |
| NGC 4772 | 63.29 | 0.026 | 0.120 |
| NGC 4775 | 27.56 | 0.089 | 0.029 |
| NGC 4781 | 67.95 | 0.105 | 0.074 |
| NGC 4818 | 81.59 | 0.072 | 0.128 |
| NGC 4856 | 90.00 | 0.051 | 0.200 |
| NGC 4902 | 26.47 | 0.094 | 0.089 |
| NGC 4930 | 45.75 | 0.818 | 0.125 |
| NGC 4939 | 67.43 | 0.044 | 0.041 |
| NGC 4941 | 53.51 | 0.021 | 0.016 |
| NGC 5005 | 67.11 | 0.026 | 0.081 |
| NGC 5054 | 54.25 | 0.057 | 0.030 |
| NGC 5078 | 90.00 | 0.049 | 0.060 |
| NGC 5085 | 35.55 | 0.074 | 0.043 |
| NGC 5101 | 40.28 | 0.156 | 0.146 |
| NGC 5121 | 40.35 | 0.027 | 0.025 |
| NGC 5161 | 70.70 | 0.064 | 0.125 |
| NGC 5247 | 42.86 | 0.096 | 0.077 |
| NGC 5248 | 50.43 | 0.072 | 0.048 |
| NGC 5334 | 42.47 | 0.037 | 0.029 |
| NGC 5371 | 47.78 | 0.490 | 0.100 |
| NGC 5427 | 41.98 | 0.137 | 0.059 |
| NGC 5448 | 64.60 | 0.060 | 0.082 |
| NGC 5483 | 23.82 | 0.208 | 0.047 |
| NGC 5676 | 65.62 | 0.104 | 0.023 |
| NGC 5701 | 29.31 | 0.408 | 0.103 |
| NGC 5713 | 39.74 | 0.110 | 0.117 |
| NGC 5838 | 90.00 | 0.024 | 0.139 |
| NGC 5850 | 41.42 | 0.034 | 0.097 |
| NGC 5921 | 44.52 | 0.042 | 0.117 |
| NGC 5962 | 49.29 | 0.056 | 0.052 |
| NGC 6753 | 30.98 | 0.031 | 0.017 |
| NGC 6782 | 41.99 | 0.111 | 0.114 |
| NGC 6902 | 43.42 | 0.041 | 0.039 |
| NGC 6907 | 44.98 | 0.169 | 0.157 |
| NGC 7083 | 57.12 | 0.043 | 0.037 |
| NGC 7184 | 84.57 | 0.030 | 0.151 |
| NGC 7205 | 61.75 | 0.063 | 0.026 |
| NGC 7213 | 28.66 | 0.014 | 0.004 |
| NGC 7217 | 33.86 | 0.015 | 0.017 |
| NGC 7412 | 40.61 | 0.074 | 0.070 |
| NGC 7418 | 40.82 | 0.034 | 0.055 |
| NGC 7479 | 41.81 | 0.088 | 0.167 |
| NGC 7552 | 51.37 | 0.085 | 0.189 |
| NGC 7582 | 69.88 | 0.021 | 0.084 |
| NGC 7606 | 60.08 | 0.049 | 0.023 |
| NGC 7713 | 65.41 | 0.141 | 0.024 |
| NGC 7723 | 49.53 | 0.143 | 0.062 |
| NGC 7727 | 40.02 | 0.375 | 0.042 |
| NGC 7741 | 48.17 | 0.067 | 0.146 |
| NGC 7814 | 67.29 | 0.017 | 0.040 |
Acknowledgements.
We are grateful to the referee, Wim van Driel, whose constructive comments helped to improve the presentation of our results. The computations in this work have been realized on the Fujitsu NEC-SX5 of the CNRS computing center, at IDRIS. We are happy to acknowledge the support of the Indo-French grant IFCPAR/2704-1.References
- (1) Baldwin, J., Lynden-Bell, D., & Sancisi, R. 1980, MNRAS, 193, 313
- (2) Binney, J., & Merrifield, M. 1998, Galactic Astronomy (Princeton: Princeton Univ. Press)
- (3) Block, D. L., Bournaud, F., Combes, F., Puerari, I., & Buta, R. 2002, A&A, 394, L35
- (4) Block, D. L., Bertin, G., Stockton, A., et al. 1994, A&A, 288, 365
- (5) Bournaud, F., & Combes F. 2002, A&A, 392, 83
- (6) Bournaud, F., Combes, F., & Jog, C. J. 2004, A&A, 418, L27
- (7) Bournaud, F., Jog, C. J., & Combes, F. 2005, A&A, in press (astro-ph/0503189)
- (8) Buta, R., & Combes, F. 1996, Fund. of Cosmic Physics, 17, 95-282
- (9) Combes, F., & Sanders, R. H. 1981, A&A, 96, 164
- (10) de Vaucouleurs, G., & de Vaucouleurs, A., Corwin, H. G., et al. 1991, Third Reference Catalogue of Bright Galaxies (RC3). Springer-Verlag, New York
- (11) Elmegreen, B. G., & Elmegreen, D. M. 1985, ApJ, 288, 438
- (12) Eskridge, P. B., Frogel, J. A., Pogge, R. W., et al. 2002, ApJS, 143, 73
- (13) Gérin, M., Combes, F., & Athanassoula, E. 1990, A&A, 230, 37
- (14) Jog, C. J. 1997, ApJ, 488, 642
- (15) Jog, C. J. 2002, A&A, 391, 471
- (16) Jungwiert, B., Combes, F., & Palous, J. 2001, A&A, 376, 5
- (17) Kerez, D., Katz, N., Weinberg, D. H., & Davé, R. 2004, MNRAS, submitted astro-ph/0407095
- (18) Kornreich, D. A., Haynes, M. P., & Lovelace, R. V. E. 1998, AJ, 116, 2154
- (19) Kornreich, D. A., Lovelace, R. V. E., & Haynes, M. P. 2002, ApJ, 580, 705
- (20) Levine, S. E., & Sparke, L. S. 1998, ApJ496, L13
- (21) Masset, F., & Tagger, M. 1997, A&A, 332, 442
- (22) Matthews, L. D., van Driel, W., & Gallagher, J. S. 1998, AJ, 116, 2196
- (23) Noguchi, M. 1996, ApJ, 469, 605
- (24) Odewahn, S. C. 1994, AJ, 107, 1320
- (25) Richter, O., & Sancisi, R. 1994, A&A, 290, 9
- (26) Rix, H.-W., & Zaritsky, D. 1995, ApJ, 447, 82
- (27) Semelin, B., & Combes, F. 2005, A&A, in prep.
- (28) Schmidt, M. 1959, ApJ, 129, 243
- (29) Schoenmakers, R. H. M., Franx, M., & de Zeeuw, P. T. 1997, MNRAS, 292, 349
- (30) Shen, J., & Sellwood, J. A. 2004, ApJ, 604, 614
- (31) Shu, F. H., Tremaine, S., Adams, F. C., & Ruden, S. P. 1990, ApJ, 358, 495
- (32) Swaters, R. A., Schoenmakers, R. H. M., Sancisi, R., & van Albada, T. S. 1999, MNRAS, 304, 330
- (33) Syer, D., & Tremaine, S. 1996, MNRAS, 281, 925
- (34) Walker, I. R., Mihos, J. C., & Hernquist, L. 1996, ApJ, 460, 121
- (35) Weinberg, M. 1994, ApJ, 421, 481
- (36) Wilcots, E. M., & Prescott, M. K. M. 2004, AJ, 127, 1900
- (37) Zaritsky, D., & Rix, H.-W. 1997, ApJ, 477, 118