Evidence for Supernova light in all Gamma-Ray Burst afterglows
Abstract
We present an update of our systematic analysis of all Gamma-Ray Burst (GRB) afterglow data, now published through the end of 2004, in an attempt to detect the predicted supernova light component. We fit the observed photometric light curves as the sum of an afterglow, an underlying host galaxy, and a supernova component. The latter is modeled using published light curves of SN 1998bw as a template. The total sample of afterglows with established redshifts contains now 29 bursts (GRB 970228 - GRB 041006). For 13 of them a weak supernova excess (scaled to SN 1998bw) was found. In agreement with our earlier result Zeh2004 we find that also in the updated sample all bursts with redshift 0.7 show a supernova excess in their afterglow light curves. The general lack of a detection of a supernova component at larger redshifts can be explained with selection effects. These results strongly support our previous conclusion based on all afterglow data of the years 1997 to 2002 Zeh2004 that in fact all afterglows of long-duration GRBs contain light from an associated supernova.
I Introduction
Significant progress towards understanding the nature of GRBs and their progenitors came with the discovery of GRB afterglows in 1997 Groot1997 ; vanParadies1997 . First observational evidence for the underlying source population was provided by GRB 970828, which showed a bright X-ray afterglow but no optical counterpart down to faint magnitudes Groot1998 . This led to the suggestion that the optical light was blocked by cosmic dust in the GRB host galaxy, linking the burster to a dusty star-forming region, i.e., most likely to the explosion of a massive star Paczynski1998 . The discovery of a near-by type Ibc supernova (SN 1998bw) in the error circle of the X-ray afterglow for GRB 980425 Galama1998 ; Kulkarni1998 , provided strong support for this idea, and is consistent with our current understanding of type Ibc SNe and their progenitors (e.g., Fryer1999 ; Heger2003 ).
From the observational site, the supernova picture is further supported by the fact that all GRB hosts are star-forming, and in some cases even star-bursting galaxies (e.g., Frail2002 ; Sokolov2001 ). Evidence for host extinction by cosmic dust in GRB afterglows and the discovery of an ensemble of optically ’dark bursts’ (for a recent discussion, see Fynbo2001 ; Klose2003 ; Lazzati2002 ) also is consistent with the picture that GRB progenitors are young, massive stars. Furthermore, for several GRB afterglows X-ray lines may hint at a period of nucleosynthesis preceding or accompanying the burst Antonelli2000 ; Lazzati1999 ; Meszaros2001 . The positions of the afterglows with respect to their hosts also favors a relation to young, massive stars to GRBs Bloom2002 .
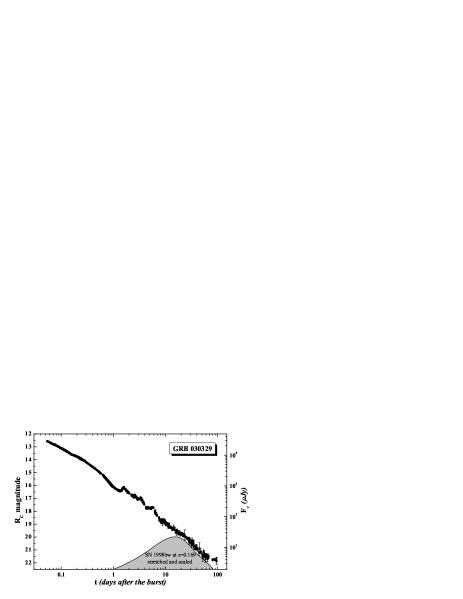
As a natural consequence of a physical relation between the explosion of massive stars and GRBs supernova light should contribute to the afterglow flux, and even dominate under favorable conditions. The most convincing example is GRB 030329 Peterson2003 at =0.1685 Greiner2003a with spectral confirmation of supernova light in its afterglow Hjorth2003 ; Kawabata2003 ; Matheson2003 ; Stanek2003 . Spectroscopic evidence for SN light in a GRB afterglow was later also reported for GRB 021211 dellaValle2003 , GRB 031203 Malesani2004 and most recently for XRF 020903 Soderberg2005 .
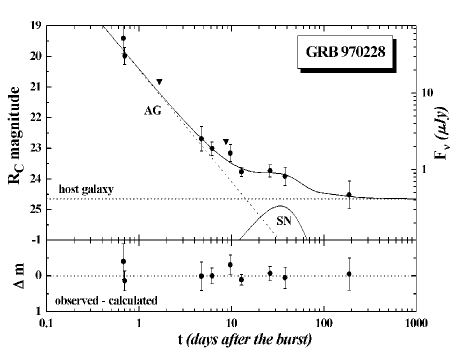
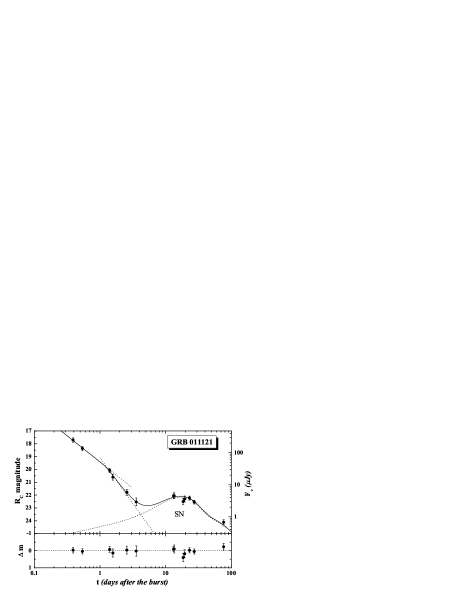
In contrast to direct spectroscopic evidence, several cases of photometric indication of extra light in GRB afterglows have been reported, starting with the pioneering work on GRB 980326 Bloom1999 . Inspired by this finding, the discovery of extra light in archived data of the afterglow of GRB 970228 Reichart1999 ; Galama2000 made it clear that a search for late-time bumps in optical afterglow light curves provides a powerful tool to constrain or even reveal the nature of the underlying sources. Since then various groups successfully fit SN 1998bw templates to explain these late-time bumps (e.g., Dado2002 ), the most convincing case being that of GRB 011121 Bloom2002 ; Garnavich2003 ; Greiner2003b .
The goal of our study is to search for supernova bumps in GRB afterglow light curves using a systematic approach, allowing us to draw statistically founded conclusions on the physical properties of this new class of GRB-SNe in particular and on the GRB progenitors in general. We collected from the literature all available photometric data on GRB afterglows (including our own data), checked them for photometric consistency, and re-analyzed the data in a consistent manner. Here we report on the status of our study for all bursts that occurred by the end of 2003, supplementing and expanding our previous results (Zeh2004 , in the following paper I).
II Numerical approach
We model the light curve of the optical transient (OT) following a GRB as a composite of afterglow (AG) light, supernova (SN) light, and constant light from the underlying host galaxy. The flux density, , at a frequency is then given by
| (1) |
Here, the parameter describes the observed brightness ratio (in the host frame, i.e., including the cosmological -correction) between the GRB-supernova, and the SN template (SN 1998bw) in the considered photometric band (in the observer frame). We allowed to be different in every photometric band, but within a band independent of frequency. The parameter is a stretch factor with respect to the used template. We have also explored the consequences of a shift in time between the onset of the burst and the onset of the supernova explosion, as implied by some theoretical models Vietri2000 . Then, in Eq. (1) was replaced by . Here, refers to GRB 980425/SN 1998bw Iwamoto1998 . If the SN preceded the onset of the GRB.
Following Beuermann1999 and Rhoads2001 , we describe the afterglow light curve by a broken power-law,
| (2) |
with const= Here is the time after the burst (in the observer frame), is the pre-break decay slope of the afterglow light curve, is the post-break decay slope, and is the break time. The parameter characterizes the sharpness of the break; a larger implies a sharper break. If no break is seen in the data then and Eq. (2) simplifies correspondingly.
The results of this numerical procedure were compared with corresponding results published by others Dado2002 ; Bloom2002 , and we found close agreement. We used this procedure to predict the color evolution of GRB 030329/SN 2002dh Zeh2003 , and obtained a very good numerical fit for the light curves of GRB-SN 011121 Greiner2003b . The limitations of the procedure are given by the chosen photometric band in combination with the redshift of the burster. Once we can no longer interpolate in between the bands, but have to extrapolate into the UV domain (cf. Bloom1999 ), results become less accurate. For more details see paper I.
Before performing a numerical fit, the observational data was corrected for Galactic extinction along the line of sight using the COBE maps Schlegel1998 . This also holds for SN 1998bw, where we assumed = 0.06 mag. We calculated the Galactic visual extinction according to = 3.1 , whereas the extinction in and were obtained via Rieke1985 , and in and by means of the numerical functions compiled in Reichart2001 .
| GRB | GRB | GRB | GRB | ||||
|---|---|---|---|---|---|---|---|
| 970228 | 0.695 | 991216 | 1.02 | 011121 | 0.362 | 030226 | 1.986 |
| 970508 | 0.835 | 000301C | 2.04 | 011211 | 2.140 | 030323 | 3.372 |
| 971214 | 3.42 | 000418 | 1.118 | 020405 | 0.69 | 030328 | 1.520 |
| 980703 | 0.966 | 000911 | 1.058 | 020813 | 1.25 | 030329 | 0.169 |
| 990123 | 1.600 | 000926 | 2.066 | 020903 | 0.251 | 030429 | 2.658 |
| 990510 | 1.619 | 010222 | 1.477 | 021004 | 2.3 | 031203 | 0.106 |
| 990712 | 0.434 | 010921 | 0.450 | 021211 | 1.01 | 041006 | 0.716 |
| 991208 | 0.706 |
Most of the light curves we investigated have been followed in more than one photometric band. For each of these GRBs we chose the best-sampled light curve as a reference light curve for the fit in the other photometric bands. In all cases this was the band light curve. We always assumed that afterglows are achromatic, in reasonable agreement with observational data (e.g., Harrison1999 ; Klose2004 ). For every individual GRB, the afterglow parameters , and (Eq. 2) are then the same for all photometric bands. Consequently, once we fit the reference light curve of an optical transient and deduced the corresponding afterglow parameters, we treated them as fixed parameters when fitting the light curves of the optical transient in other photometric bands. In the fit the degrees of freedom are reduced correspondingly.
III Results and Discussion
The input sample consists of 29 bursts (GRB 970228 - GRB 041006) with established redshifts and good enough photometric data in order to search for a late-time bump in their afterglows (Table 1), with the most recent data for GRB 041006 Stanek2005 . These are eight bursts more than in our previous study for all bursts observed by the end of 2002 (paper I). Among these 29 bursts are 13 for which a late-time bump was found. This includes now also XRF 020903 (as already noted in Soderberg2002 and now spectroscopically confirmed Soderberg2005 ). Note that the requirement of a known redshift excludes GRB 980326 as well as XRF 030723 from this list, which both showed a strong late-time bump. On the other hand, as already noted in Bloom1999 , one can in principle constrain the redshift of a burster by fitting a redshifted SN component to the observed late-time bump in its afterglow light curve.

Again, our key finding is photometric evidence of a late-time bump in all GRB afterglows with a redshift 0.7. We interpret this bump as light from an underlying supernova, and model this component as a redshifted version of SN 1998bw. The deduced luminosities for these GRB-SNe (not including extinction corrections for the host galaxy), normalized to SN 1998bw are listed in Table 2. The width of the distribution of the SN peak luminosities (in units of the peak luminosity of SN 1998bw) spans over 2 photometric magnitudes with a pronounced maximum around (Figs. 4, 5). The potential SN related to the X-ray flash 020903 is not unusual with respect to its peak luminosity. Interestingly, SN 1998bw is at the bright end of the GRB-SNe distribution (as already noted in paper I). Only the SNe related to GRBs 030329 and 031203 might have been slightly more luminous at peak brightness. No correlation was found of the deduced SN luminosities with the redshift or any afterglow parameter. Note, however, that we cannot exclude the existence of such a correlation since in most cases when a SN was found there is a lack of early time data in the optical light curve (resulting in an unknown break time and, hence, an unknown parameter ; Eq. 2).


| GRB | band | if =1 | ||||||
|---|---|---|---|---|---|---|---|---|
| 970228 | 0.695 | 389 | 0.400.24 | 1.460.80 | 0.70 | 0.330.30 | 0.71 | |
| 980703 | 0.966 | 335 | – | – | – | 1.661.22 | 0.78 | |
| 990712 | 0.434 | 459 | 0.480.10 | 0.890.10 | 1.00 | 0.430.08 | 1.01 | |
| 991208 | 0.706 | 386 | 0.900.35 | 1.120.28 | 1.64 | 1.020.32 | 1.56 | |
| 000911 | 1.058 | 320 | 0.870.39 | 1.490.33 | 0.75 | 0.510.43 | 1.14 | |
| 010921 | 0.450 | 454 | 0.680.48 | 0.680.28 | 0.42 | 0.430.10 | 0.78 | |
| 011121 | 0.360 | 484 | 0.790.06 | 0.850.06 | 0.92 | 0.740.05 | 1.32 | |
| 020405 | 0.695 | 389 | 0.740.17 | 0.980.17 | 5.26 | 0.720.11 | 4.86 | |
| 020903 | 0.251 | 527 | 0.460.44 | 1.470.88 | 1.52 | 0.370.41 | 1.22 | |
| 021211 | 1.006 | 328 | 0.970.87 | 0.740.23 | 2.68 | 0.520.34 | 2.65 | |
| 030329 | 0.169 | 563 | 1.130.33 | 0.820.13 | 3.10 | 0.980.01 | 4.49 | |
| 031203 | 0.106 | 596 | 1.650.41 | 1.140.16 | 0.04 | 1.750.19 | 0.24 | |
| 041006 | 0.716 | 384 | 0.910.05 | 1.380.06 | 1.27 | 1.210.07 | 1.95 |
Figure 6 shows the distribution of the corresponding stretch factor . Since no fit was possible for the afterglow of GRB 980703 with being a free parameter, this burst is not included in Figs. 4-6. The mean value of is 1.0, i.e., identical to SN 1998bw.
Instead of introducing a stretch factor to have more freedom in the variety of GRB-SNe, one can also follow Vietri2000 and search for evidence of a time delay between the burst and the SN. According to this model, GRBs are the result of delayed black hole formation, which implies that the core-collapse and its subsequent supernova may significantly precede the burst. The delay could be of order months to years Vietri2000 , or perhaps as short as hours Woosley2002 . For only two of the SN light curves the fit indeed improved if we allowed for a shift in time between the onset of the burst and the onset of the SN (GRBs 990712, 011121). The offsets never exceeded 5 days, and were both negative and positive. However, the uncertainties in this parameter are large, due to the poorly sampled shape of the underlying supernova (e.g., Garnavich2003 ).
IV Summary and Conclusions
Since the first clear evidence for extra light in a GRB afterglow light curve (GRB 980326; Bloom1999 ), there is growing evidence for several such cases. Our key finding is photometric evidence of a late-time bump in all afterglows with a redshift 0.7, including those of the year 2003 (GRBs 030329 and 031203) and year 2004 (GRB 041006; Stanek2005 ). For larger redshifts the data is usually not of sufficient quality, or the SN is simply too faint, in order to search for such a feature in the late-time afterglow light curve. This extra light is modeled well by a supernova component, peaking days after a burst. This, together with the spectral confirmation of SN light in the afterglows of GRB 021211, 030329, and 031203 further supports the view that in fact long-duration GRBs show SN bumps in their late-time optical afterglows. Given the fact that a strong late-time bump was also found for XRF 030723 Fynbo2004 and a less strong bump for XRF 020903 (but with spectroscopic confirmation of underlying SN light Soderberg2005 ) might indicate that this conclusion holds also for X-ray flashes (even though the finding of XRF-SNe might be more difficult; see Soderberg2005 ).
Acknowledgements.
S.K. and A.Z. acknowledge financial support by DFG grant KL 766/11-1. D.H.H. acknowledges support for this project under NSF grant INT-0128882. We thank N. Masetti and E. Palazzi, Bologna, for providing host-subtracted data on the afterglow of GRB 020405. This work has benefited from the GCN data base maintained by S. Barthelmy at NASA and the GRB big table maintained by J. Greiner, Max-Planck-Institut für extraterrestrische Physik, Garching.References
- (1) Antonelli, L. A., et al. 2000, ApJ, 545, L39
- (2) Beuermann, K., et al. 1999, A&A, 352, L26
- (3) Bloom, J. S., et al. 1999, Nature, 401, 453
- (4) Bloom, J. S., Kulkarni, S. R., & Djorgovski, S. G. 2002, AJ, 123, 1111
- (5) Dado, S., Dar, A., & de Rújula, A. 2002, A&A, 388, 1079
- (6) Della Valle. M., et al. 2003, A&A 406, L33
- (7) Frail, D. A., et al. 2002, ApJ, 565, 829
- (8) Fryer, C. L., Woosley, S. E., & Hartmann, D. H. 1999, ApJ, 526, 152
- (9) Fynbo, J. U., et al. 2001, A&A, 369, 373
- (10) Fynbo, J. U. P. et al. 2004, ApJ, 609, 962
- (11) Galama, T. J., et al. 1998, Nature, 395, 670
- (12) Galama, T. J., et al. 2000, ApJ, 536, 185
- (13) Garnavich, P. M., et al. 2003, ApJ, 582, 924
- (14) Greiner, J., et al. 2003a, GCN Circ. 2020
- (15) Greiner, J., et al. 2003b, ApJ, 599, 1223
- (16) Groot, P. J. et al., 1997, IAU Circ. 6584
- (17) Groot, P. J., et al. 1998, ApJ, 493, L27
- (18) Harrison, F. A., et al. 1999, ApJ, 523, L121
- (19) Heger, A., et al. 2003, ApJ, 591, 288
- (20) Hjorth, J., et al. 2003, Nature, 423, 847
- (21) Iwamoto, K., et al. 1998, Nature, 395, 672
- (22) Kawabata, K. S., et al. 2003, ApJ, 593, L19
- (23) Klose, S., et al. 2003, ApJ, 592, 1025
- (24) Klose, S., et al. 2004, AJ, 128, 1942
- (25) Kulkarni, S. R. et al. 1998, Nature, 395, 663
- (26) Lazzati, D., Campana, S., & Ghisellini, G. 1999, MNRAS, 304, L31
- (27) Lazzati, D., Covino, S., & Ghisellini, G. 2002, MNRAS, 330, 583
- (28) Malesani, D., et al. 2004, ApJ 609, L5
- (29) Matheson, T., et al. 2003, ApJ 599, 394
- (30) Mészáros, P., & Rees, M. J. 2001, ApJ, 556, L37
- (31) Paczyński, B. 1998, ApJ, 494, L45
- (32) Peterson, B. A., & Price, P. A. 2003, GCN Circ. 1985
- (33) Reichart, D. 1999, ApJ, 521, L111
- (34) Reichart, D. 2001, ApJ, 553, 235
- (35) Rhoads, J. E., & Fruchter A. S. 2001, ApJ, 546, 117
- (36) Rieke, G. H., & Lebofsky, M. J. 1985, ApJ, 288, 618
- (37) Schlegel, D., Finkbeiner, D., & Davis, M. 1998, ApJ, 500, 525
- (38) Soderberg, A. M. et al. 2002, GCN 1554
- (39) Soderberg, A. M. et al. 2005, astro-ph/0502553
- (40) Sokolov, V. V., et al. 2001, A&A, 372, 438
- (41) Stanek, K. Z., et al. 2003, ApJ, 591, L17
- (42) Stanek, K. Z., et al. 2005, astro-ph/0502319
- (43) van Paradijs, J. et al., 1997, Nature 386, 686
- (44) Vietri, M., & Stella, M. 2000, ApJ, 527, L43
- (45) Woosley, S. E., Zhang, W., & Heger, A. 2002, in: From Twilight to Highlight: The Physics of Supernovae, p. 87; astro-ph/0211063
- (46) Zeh, A., Klose, S., & Greiner, J. 2003, GCN Circ. 2081
- (47) Zeh, A., Klose, S., Hartmann, D. H. 2004, ApJ, 609, 952 (paper I)