The cool atmospheres of the binary brown dwarf Indi B ††thanks: Based on observations collected with the ESO VLT, Paranal, Chile, program 60.A-9245(A).
We have imaged Indi B, the closest brown dwarf binary known, with VISIR at the VLT in three narrow-band mid-infrared bandpasses located around 8.6m, 10.5m and 11.3m. We are able to spatially resolve both components, and determine accurate mid-infrared photometry for both components independently. In particular, our VISIR observations probe the NH3 feature in the atmospheres of the cooler and warmer brown dwarfs. For the first time, we can disentangle the contributions of the two components, and find that IndiBb is in good agreement with recent “cloud-free” atmosphere models having an effective temperature of K. With an assumed age of 1 Gyr for the Indi system, component Ba agrees more with K rather than with K, as suggested by SPITZER spectroscopic observations of the combined Indi B system (Roellig et al., 2004). Even higher effective temperatures appear inconsistent with our absolute photometry, as they would imply an unphysical small size of the brown dwarf IndiBa.
Key Words.:
stars: low-mass, brown dwarfs — stars: binaries: general1 Introduction
Indi B, the closest brown dwarf known (Scholz et al.,
2003), has been recently discovered as a close binary, consisting of
two brown dwarf components separated by 0.73″(McCaughrean et
al., 2004). The system has a well-established distance (3.626 pc,
ESA 1997) and age (range 0.8-2Gyr; Lachaume et al., 1999),
and will allow the determination of fundamental physical parameters
like its mass, luminosity, effective temperature, and surface
gravity with unprecedented precision. Extending the analysis towards
the mid-infrared (MIR) offers the opportunity to benchmark
evolutionary and atmospheric models for very low temperatures.
Adaptive optics assisted near-infrared (H-band) low-resolution
() spectroscopy (McCaughrean et al., 2004) of both
components individually lead to a most likely spectral
classification of T1 for Indi Ba and T6 for
Indi Bb based on the Burgasser et al. (2002) H2O
and CH4 spectral indices.
Effective temperatures between 1238K and 1312K were
derived for Indi Ba and between 835K and 875K for
Indi Bb, bracketed by assuming the most likely ages
between 0.8 and 2 Gyrs.
However, the comparison of high-resolution
() near-infrared spectra of Indi Ba
(Smith et al., 2003) with synthetic atmosphere spectra of Tsuji
(2002) leads to a much higher K. The
reasons for the large discrepancy are not known, but may be related
to the radius of the brown dwarf or to uncertainties in the
bolometric corrections assumed.
Indi B has recently been observed by the SPITZER
Space Telescope in the mid-infrared (Roellig et al., 2004). Their
low-resolution IRS spectrum is a composite spectrum of both
components, as the limited angular resolution of SPITZER does not
allow to resolve it spatially. Roellig et al. claim that their
observation is the first evidence for NH3 absorption in very cool
brown dwarf atmospheres between 10m and 11m, although they
cannot disentangle the contributions of both components
individually. The SPITZER spectrum matches well a composite model
described by Saumon, Marley & Lodders (2003, hereafter SML),
assuming cloudless synthetic spectra.
Here, we report spatially resolved MIR photometry of
Indi B obtained with VISIR, the new mid-infrared
camera and spectrometer at the VLT (Lagage et al., 2004) during
science verification. Our goal is to constrain the most pertinent
brown dwarf model atmospheres with our data.
2 Observations
Indi B has been imaged with VISIR mounted on the UT3
(Melipal) of the VLT on Sept. 28, 2004 (in filters PAH1 and PAH2)
and on Sept. 30, 2004 (in filter Siv) under clear and stable
atmospheric conditions. A nominal pixel scale of 0.075″was
used in all bands, and standard chopping and nodding techniques
(10″amplitudes) were employed.
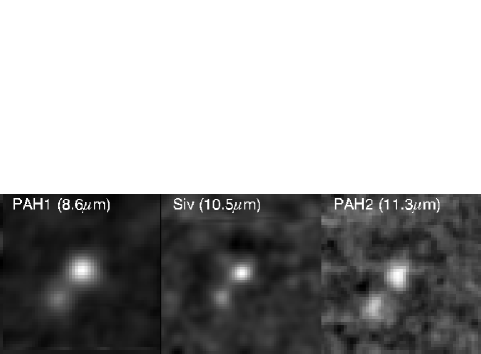
Fig. 1 show the final, co-added and median cleaned images
that were used for sub-sequent photometry. The binary is clearly
resolved, the measured image quality (FWHM) on the final frames is
around for each point source, slightly above the
diffraction limit.
While the position
angle from our three measurements () is
consistent with that determined by McCaughrean et al. (2004) using
AO one year earlier (), our separation
() is larger (), and suggests orbital motion.
A summary of the observing log, filter central wavelengths, half
band-width and total on-source integration times, is given in
Table 1.
Source count-rates were determined with standard aperture
photometry. Curve-of-growth methods were applied to find the
aperture radii that maximized the signal-to-noise ratio of the
extracted source. Those radii were then also used for the
calibration source to determine the count-rate to flux conversion
factor. For faint sources, the optimal extraction aperture radius is
not always well determined, and the presence of a second companion
does not allow to grow the aperture to more then half of their
distance. The variation of the count-rate to flux conversion factors
with aperture radius was screened for aperture radii of 4, 5 and 6
pixel (corresponding to radii of ), and constitutes the main error in the absolute
flux calibration of the targets. Different calibrator
stars111taken from the list of Cohen et al. (1999) observed
at different airmasses give fully consistent results, and their
contribution to the absolute photometric errors is negligible. Flux ratios between the components, and between different filter
passbands can be obtained with a much higher accuracy, as the errors
are only related the spread of the count rates in the four different
beams, and rather independent on the actual choice of the aperture
radius. Fluxes and ratios together with error estimates are
summarized in Table 2.
We note that the combined fluxes of components Ba and Bb agree
with the spectrophotometric fluxes for the Indi B
system deduced from the SPITZER spectrum shown in Fig.2 of Roellig
et al. (2004), albeit our fluxes are on the low side of their
allowed 25% error range in absolute flux calibration. Component Ba
dominates the mid-infrared emission, and component Bb contributes
about 1/3 to the total flux density. Our Siv filter located
at a central wavelength of 10.5m is particular well suited to
probe the potential presence of NH3 absorption features in brown
dwarf atmospheres. In fact, a significant change of the relative
spectral shape between both components becomes evident in the
reddest passband around 11.3m (PAH2), where the flux of Bb
comes close to that of Ba. The flux ratio Siv/PAH2 is small
for component Bb, indicating the presence of a strong NH3
absorption band. We find no indication for strong absorption in
component Ba, though.
| RJD | Filter | AM | Int[s] | Calibratora | ||
|---|---|---|---|---|---|---|
| 53277.6 | PAH1 | 8.59 | 0.42 | 1.18 | 3638 | HD224630 |
| HD10550 | ||||||
| 53277.7 | PAH2 | 11.25 | 0.59 | 1.29 | 3587 | HD224630 |
| 53279.6 | Siv | 10.49 | 0.16 | 1.18 | 3564 | HD178345 |
| Object | PAH1 | Siv | PAH2 | ||
|---|---|---|---|---|---|
| [mJy] | [mJy] | [mJy] | |||
| Ba | |||||
| Bb |
3 Comparison with Atmosphere Models
Atmosphere models are typically calculated on a grid of
pairs, for specific metallicities. Taylor (2003)
lists [Fe/H]=0.0560.038 for Indi A; therefore we
refer to solar metallicities also for Indi B.
The object radius is the main parameter that determines the
absolute spectral flux calibration of the model atmospheres, and is
obtained from evolutionary calculations. Comparing the evolutionary
models of Baraffe et al. (2003) with those of Burrows et al. (1997)
(in the given grid of ages and temperatures), we find that their
radii agree within 2%. In the following we refer to the Burrows
models, only, and note that different models do not contribute
significantly to uncertainties in the absolute model fluxes. In
Table 3 we summarize the (sub-)stellar parameters
log , and assuming an age of 1Gyr for the
Indi B system. We note, however, that the age range
allowed for Indi implies systematic variations of the
model radius. While the younger age (0.8Gyr) increases the radius by
about 3%, the older age (2Gyr) decreases the radius by 7% for all
temperatures considered here. Systematic uncertainties up to 15%
are therefore implicit in the absolute normalization of the model
fluxes due to the age uncertainty of Indi.
Burrows, Sudarsy & Lunine (2003) explore the age and mass
dependance of H2O, CH4 and NH3 molecular bands on MIR
spectra of very cool brown dwarfs with K.
We have selected a suitable spectral model ( K,
log = 5) which represents a brown dwarf with a mass of
and an age of 1Gyr222zenith.as.arizona.edu/burrows/bsl/bsl.html. For the hotter
component, the cloud-free model spectrum for an age of 1Gyr
corresponding to and
for =1200K and K,
respectively, were supplied by A. Burrows (pers. comm.). Also Allard
et al. (2001) provide model atmosphere spectra in the assumed
parameter range. We concentrate our comparison to their
“cloudless” models, which include the effects of condensation in
chemical equilibrium, but ignore the effects of dust opacities
altogether. Their model spectra are freely downloadable from the
web333ftp.ens-lyon.fr/pub/users/CRAL/fallard/AMES-Cond-2002. Finally,
also SML provide MIR spectra of brown dwarfs.
In fact, their cloudless synthetic spectra for
=1200K and =800K (log = 5) were
combined and compared to the SPITZER spectrum in Roellig et al.
(2004). Both spectra were provided to us by D. Saumon directly.
For all model spectra we calculated the expected flux densities in
the corresponding VISIR filter passbands by convolving the model
spectrum with the respective filter transmission
profiles444http://www.eso.org/instruments/visir/inst/.
In Table 4 we summarize and compare the predicted model
flux densities for the different model atmospheres. In boldface we mark those values that are consistent with our VISIR
measurements (Table 2) allowing for a 3 error
range. From the comparison in Table 4 we infer that most
of the available model spectra for the cooler component Bb are
consistent with the absolute MIR photometry. They also
essentially match the flux ratios (which are independent of
absolute calibration issues like the radius assumed), but tend to
underestimate the color. All models
predict a clear signature of a more or less pronounced NH3
absorption feature, which is also present in our data. The predicted
absolute fluxes appear somewhat () higher than the
measured ones, but are still within the allowed error range.
The warmer component Ba is more difficult to reconcile with current
models and assumptions about the Indi B system. While
cloud-free models, assuming an age of 1Gyr and an effective
temperature of 1200K for Ba as used by Roellig et al. (2004) agree
very well with their SST/IRS spectrum, they appear only marginally consistent with our VISIR mid-infrared photometry. The
spectral shape measured for Ba (decreasing flux with increasing
wavelength) is not reflected in these models. Also, their predicted
MIR fluxes are higher then measured in the
corresponding VISIR passbands. Assuming an age of 2Gyr – at the
high limit of the allowed age range – reduces the model radius to
, and the predicted MIR fluxes by 13%. This is not
sufficient to explain the lower flux densities observed. An age of
5Gyr with a radius of would be required in order to
match the absolute fluxes.
One straightforward way to reduce the absorption signatures of
NH3 is to increase the temperature of the atmosphere. In fact
Allard’s et al. AMES-cond model for K can be
considered to be fully consistent with our relative
photometry. However, when we apply the evolutionary models of
Burrows et al. (1997) with a radius of , the absolute photometry is grossly off. K for
component Ba has also been favored by Smith et al. (2003) based on
the analysis of high-resolution near-infrared spectroscopy. This
temperature together with the published luminosity of component Ba
(log , McCaughrean et al. 2004), however,
leads to a radius of only (Smith et al., 2003).
With this smaller radius, the absolute VISIR photometry can
now be made consistent with the spectral model.
But this radius is in contradiction to all known evolutionary models
(see also McCaughrean et al., 2004). Moreover, it also seems
empirically unlikely in view of recent measurements of the
mass-radius relation for very-low mass stars and giant planets,
which prove to be similar (Pont et al., 2005). But more, direct,
determinations of radii in the brown dwarf mass regime are necessary
to completely rule out this possibility.
As can be inferred from Table 4, both available
atmosphere models with K tend to agree better
with our measurements, assuming brown dwarf radii derived from
evolutionary models at 1Gyr.
The Burrows et al. models (shown in Figure 2 together with
our photometry) for Ba seem to produce a slightly better match for
the PAH2 measurement because of the presence of a strong absorption
feature (that is less pronounced in the AMES-cond atmosphere).
| Object | SpTa | log | log | |||
|---|---|---|---|---|---|---|
| [K] | [cm s-2] | [] | [] | [] | ||
| Ba | T1 | 1200b | 5.1 | -4.78 | 46 | 0.093 |
| 1500c | 5.3 | -4.42 | 59 | 0.090d | ||
| 1100 | 5.1 | -4.92 | 41 | 0.095 | ||
| Bb | T6 | 800b | 4.8 | -5.42 | 25 | 0.102 |
-
a
Spectral types according to McCaughrean et al. (2003)
-
b
assumed by Roellig et al. (2004)
-
c
according to Smith et al. (2003)
-
d
Smith et al. (2003) assume =0.062 and =-4.71
| Reference | PAH1 | Siv | PAH2 | |||
|---|---|---|---|---|---|---|
| [K] | [mJy] | [mJy] | [mJy] | |||
| Allarda | 800 | 4.32 | 3.64 | 6.98 | 0.84 | 0.52 |
| Burrowsb | 800 | 4.76 | 4.10 | 6.04 | 0.86 | 0.68 |
| Saumonc | 800 | 3.68 | 2.18 | 4.86 | 0.59 | 0.45 |
| Allarda | 1100 | 8.83 | 8.93 | 12.04 | 1.01 | 0.74 |
| Burrowsd | 1100 | 7.96 | 8.79 | 8.83 | 1.10 | 1.00 |
| Allarda | 1200 | 10.67 | 11.36 | 13.21 | 1.06 | 0.86 |
| Burrowsd | 1200 | 9.13 | 10.36 | 9.99 | 1.13 | 1.04 |
| Saumonc | 1200 | 9.21 | 9.87 | 11.68 | 1.07 | 0.85 |
| Allarda | 1500 | 17.09 | 16.97 | 16.60 | 0.99 | 1.02 |
| Allarde | 1500 | 8.11 | 8.05 | 7.88 | 0.99 | 1.02 |
-
a
AMES-cond models from Allard et al. (2001)
-
b
cloud-free model from Burrows, Sudarsky & Lunine (2003)
-
c
cloud-free models from Saumon, Marley & Lodders (2003, private communication)
-
d
cloud-free model from Burrows (private communication)
-
e
assuming

4 Summary
We report the detection of both components of Indi B, the closest brown dwarf binary known, with VISIR at the VLT in three narrow-band mid-infrared bandpasses located around 8.6m, 10.5m and 11.3m. We are able to determine accurate mid-infrared absolute photometry for both components independently, with an error level of 5-10% for the brighter component Ba, and 10-20% for the fainter Bb. Relative photometry and flux ratios can be measured with even higher accuracy. Our data show that component Bb has a prominent absorption feature around 10.5m, most likely explained by NH3. We then compare our MIR photometry with atmospheric model spectra, using the well-known distance, metallicity and age of the Indi B system as main input parameters. The MIR emission of the cool component Bb appears to be fully consistent with current atmosphere models assuming an effective temperature of K. The warmer component Ba appears only marginally consistent with K, a temperature that has been inferred from SPITZER spectroscopic observations of the combined Indi B system (Roellig et al., 2004), and from near-infrared photometry (McCaughrean et al. 2004), if we assume a canonical age of 1Gyr for the Indi B system. We instead favor a slightly lower effective temperature of K to reconcile the absolute MIR fluxes and the spectral shape, which does not show any evidence for NH3 absorption. A higher effective temperature of K which would agree with the spectroscopic temperature derived for the Indi B system by Smith et al. (2003), implies a non-physical small radius of Indi Ba, and is therefore unlikely.
Acknowledgements.
We like to thank the VISIR science verification team and the ESO director general for allocating observing time to this project. We appreciate to use the model spectra of F. Allard, A. Burrows and D. Saumon in electronic form. A. Burrows to supplied his 1100K and 1200K spectrum, and D. Saumon his 800K and 1200K model directly. The referee, A. Burgasser, helped to improve the paper.References
- (1) Allard, F., Hauschildt, P.H., Alexander, D.R., Tamanai, A., & Schweitzer, A., 2001, ApJ556, 357
- (2) Baraffe, I., Chabrier, G., Barman, T. S., Allard, F., Hauschildt, & P. H., 2003, A&A402, 701
- (3) Burgasser, A.J., Kirkpatrick, D.J., Brown, M.E., et al., 2002, ApJ, 564, 421
- (4) Burrows, A., Marley, M., Hubbard, W.B., et al., 1997, ApJ, 491, 856
- (5) Burrows, A., Sudarsky, D., & Lunine, J.I., 2003, ApJ, 596, 587
- (6) Cohen, M., Walker, R.G., Carter, B., Hammersley, P., Kidger, M., & Noguchi, K., 1999, AJ, 117, 1864
- (7) Creech-Eakman, M.J., Orton, G.S., Serabyn, E., & Hatward, T.L., 2004, ApJ, 602, L129
- (8) ESA 1997, Hipparcos and Tycho catalogues, ESA-SP 1200
- (9) Lagage, P.O., Pel, J.W., Claret, A., et al., 2003, SPIE, 4841, 923
- (10) Lauchaume, R., Dominik, C., Lanz, T., & Habing, H.J., 1999, A&A, 348, 897
- (11) McCaughrean, M.J., Close, L.M., Scholz, R.-D. et al., 2004, A&A, 413, 1029
- (12) Pont, F., Melo, C.H.F., Bouchy, F., Udry, S., Queloz, D., Mayor, M, & Santos, N.C., 2005, A&A, 433, L21
- (13) Roellig, T.L., van Cleve, J.E., Sloan, G.C., et al., 2004 ApJS, 154, 418
- (14) Scholz, R.-D., McCaughrean, M.J., Lodieu, N., & Kuhlbrodt, B., 2003, A&A, 389, L29
- (15) Saumon, D., Marley, M.S., & Lodders, K., 2003, arXiv:astro-ph/0310805 (SML)
- (16) Smith, V., Tsuji, T., Hinkle, K.H., et al., 2003, ApJ, 599, L107
- (17) Taylor, B.J., 2003, A&A398, 73
- (18) Tsuji, T., 2002, ApJ, 575, 264