Low Frequency Radio Observations of X-ray Ghost Bubbles in Abell 2597: A History of Radio Activity in the Core
Abstract
A previous analysis of the Chandra X-ray image of the center of the cooling core cluster Abell 2597 showed two “ghost holes” in the X-ray emission to the west and northeast of the central radio galaxy PKS 2322123. Previous radio observations did not detect any radio emission coming from the interior of the X-ray holes. We present new low frequency radio observations of Abell 2597. At 330 MHz, radio emission extends into the interior of the western ghost bubble, but not the northeast one. Our re-analysis of the archival Chandra data shows evidence for an X-ray tunnel (elongated region of reduced X-ray emission) extending from near the center of the cD out to the west ghost bubble. We also detect a smaller X-ray hole to the northeast of the center of the cD and closer than the outer ghost bubbles. Radio observations at 1.3 GHz show extensions to the west along the X-ray tunnel toward the west ghost bubble, to the northeast into the new X-ray hole, and to the northwest. All of these structures are much larger than the two inner radio lobes seen previously at 8 GHz. The X-ray tunnel suggests that the west ghost bubble is part of a continuous flow of radio plasma out from the active galactic nucleus, rather than a detached buoyant old radio lobe, and thus it may be an intermediate case between an active radio galaxy and a buoyant lobe.
Subject headings:
cooling flows — galaxies: clusters: general — galaxies: clusters: individual (Abell 2597) — intergalactic medium — radio continuum: galaxies — X-rays: galaxies: clusters1. Introduction
The thermal gas in galaxy clusters provides a historical record of the activity within the last yr in the cluster. Without recent (significant) merger activity, the cluster gas relaxes to hydrostatic equilibrium. In a relaxed cluster, the thermal gas distribution is relatively smooth and symmetric in the outer cluster regions, while the inner regions show very peaked X-ray emission which has often been interpreted as a cooling-flow (Fabian, 1994). The inner regions of these clusters generally contain large cD galaxies, which usually show evidence for cooler gas (e.g., optical line emission) and star formation. These central cD galaxies typically host powerful radio sources which, in some cases, appear to trigger star formation. Recent observations have revealed that there also appears to be a complex interplay between the central radio sources and the thermal intracluster medium (ICM).
X-ray observations of clusters such as Perseus (Böhringer et al., 1993; Fabian et al., 2000), Hydra A (McNamara et al., 2000), A2052 (Blanton et al., 2001), and Centaurus (Taylor et al., 2002) with ROSAT and show depressions (or bubbles) in the thermal gas that appear to be spatially coincident with the radio lobes. The interplay between the thermal and radio plasma is complex. Contrary to predictions of supersonic expansion of radio sources (Heinz et al., 1998), the X-ray observations of these clusters do not reveal the presence of strong shocks near the radio lobes. The radio sources appear to expand subsonically or mildly transonically into the ICM and slowly displace the thermal gas (Fabian et al., 2000; McNamara et al., 2000). This displacement of the X-ray gas is thought to lead to the bright rims of cool gas observed along the edges of the radio lobes. The cool nature of this gas has been determined by the observed soft X-ray spectrum (Perseus, Fabian et al. 2000; A2052, Blanton et al. 2003). In turn, the dense cluster medium is thought to confine the radio source and produce the compact, distorted morphology typical of cooling core systems. Equipartition arguments applied to these systems suggest that the minimum energy pressure in the radio lobes is an order of magnitude less than the surrounding thermal gas pressure (Hydra A, McNamara et al. 2000; Perseus, Fabian et al. 2000; A2052, Blanton et al. 2001; Bîrzan et al. 2004). Without some form of internal pressure support (such as hot, diffuse thermal gas) these X-ray depressions would collapse on sound crossing timescales of yr.
In a few clusters, X-ray observations have revealed the presence of cavities (“ghost holes”) in the thermal ICM which are located well beyond the radius of the currently active central radio galaxy (e.g., Perseus, Fabian et al. 2002; A2597, McNamara et al. 2001; A4059, Heinz et al. 2002). These ghost holes are thought to be buoyant lobes from a past outburst of the radio galaxy which have displaced the thermal gas as they rose through the cluster atmosphere. Observational evidence suggests that radio galaxies undergo episodic outbursts which last yr and have repetition intervals of yr (e.g., McNamara et al., 2001). Over the cluster lifetime, the activity of the central radio galaxy would produce many generations of radio lobes. Each generation of buoyant bubbles may entrain cool cluster gas as it moves outward in the cluster atmosphere, thus lowering the total mass inflow in the cluster core. In addition, recent observations of Perseus (Fabian et al., 2003a) and M87 (Forman et al., 2003) show ripples that suggest that each generation of radio outburst sends weak shocks through the ICM. These shocks dissipate energy which may be sufficient to balance the effects of radiative cooling in the cluster cores. In this scenario, episodic central radio sources may provide the solution to the “cooling flow problem” (the lack of sufficient quantities of cool gas in the cores of dense clusters). Due to a balance between buoyancy and drag forces, the bubbles will rise at a fraction of the sound speed in the thermal gas; thus, the locations of the bubbles can be used to place constraints on the lifecycle of the central radio galaxy. Buoyant bubbles also provide a means of transporting magnetic fields from the central active galactic nucleus to the outer cluster regions where the fields have been detected to radii of over 500 kpc (Feretti et al., 1999; Clarke et al., 2001). The bubbles also contain aging relativistic particles which may be re-accelerated during a cluster merger to produce the diffuse radio relics which have been observed in some systems (Enßlin & Gopal-Krishna, 2001).
In this paper we present results of a radio and X-ray analysis of the cluster Abell 2597. This cluster is a nearby, , richness class 0 system which contains a compact ( 5″) central radio source (PKS 2322123) at 8 GHz (Sarazin et al., 1995). Recent Hubble Space Telescope (HST) FUV observations of the system reveal complex morphology with both diffuse emission as well as bright knots and filaments which appear to trace the 8 GHz radio emission (O’Dea et al., 2004). X-ray observations of the system show irregular X-ray morphology with a bright central region and two low surface brightness “ghost” cavities 18″ to the west and 16″ to the northeast of the core (McNamara et al., 2001).
Throughout this paper we adopt WMAP cosmological parameters (Bennett et al., 2003) = 71 km s-1 Mpc-1, , and . At the redshift of Abell 2597, this corresponds to a scale of 1.54 kpc/arcsec.
2. Observations and Data Reductions
2.1. X-ray
The central region of Abell 2597 was observed with Chandra on 2000 July 28 for a total of 39.4 ksec. The observations were taken in Faint (F) mode with the cluster center on the back-illuminated S3 chip. The ACIS-236789 chips were on and operating at a temperature of C and a frame time of 3.2 s. The archival observation (OBSID 922) was extracted and reprocessed using CIAO v3.0.2, and CALDB v2.26. Only events with grades 0, 2, 3, 4, and 6 were included in the analysis. The observations did not include data from the other back-illuminated (S1) CCD, hence the flare filtering was undertaken using the S3 chip. Regions surrounding the bright part of the cluster and compact sources were excluded when determining the light curve. As discussed previously by McNamara et al. (2001), the observations were severely impacted by flares. In an effort to extract as much information as possible from the data, we have not followed the standard flare-filtering routines. In this paper, we concentrate on the images of the bright central region of the cluster, and do not undertake spectral fits; thus, we have not filtered out all data impacted by flares. We have only clipped off the strongest parts of the flares but still include data with up to 8.5 times the mean quiescent background rate. This filtering retains 32 ksec of data, which gives enough photons to examine the detailed spatial structure of the thermal gas in the central regions.
We examined the impact of the high cutoff for the flare filtering by determining the contribution of the background counts to the counts in the central region of the cluster discussed in this paper. Using the standard flare-filtering cutoff we estimated the total counts in the off-source region of the S3 chip. Due to the large size of clusters, this region will contain both cluster and background counts. We used the quiescent111Quiescent background estimate for S3 taken from ACIS background memo at http://cxc.harvard.edu/contrib/maxim/bg. background estimate of 0.86 cts/s/chip for the S3 chip (properly scaled to the relevant area) to subtract the quiescent background and determine the cluster contribution in the keV band. This contribution was removed from the counts determined for the off-source region in our relaxed flare-filtering data set. Scaling the remaining quiescent plus background flare counts to the area of interest in this paper, the background is found to contribute only 1.1% of the source counts. Given this very small contribution to the counts and the overall spatial uniformity of the background flares, the spatial structure of the features discussed below are not influenced by our relaxed filtering criteria.
2.2. Radio
| Date | Array | Frequency | Bandwidth | Duration |
|---|---|---|---|---|
| (MHz) | (MHz) | (hours) | ||
| 1996 Dec 7 | A | 1312.15 | 25.0 | 5.0 |
| 1996 Dec 7 | A | 4985.1 | 50.0 | 1.3 |
| 2002 Jun 10 | B | 321.5/328.5 | 6.25/6.25 | 2.3 |
| 2003 Aug 18 | A | 328.5 | 6.25 | 3.0 |
We observed the central radio galaxy PKS 2322123 in Abell 2597 at 330 MHz with the Very Large Array (VLA). The observations were taken in spectral line mode to reduce the effects of bandwidth smearing and enable radio-frequency interference (RFI) excision. The observations around 330 MHz had a bandwidth of 6.25 MHz and a total of 16 spectral channels. For the 330 MHz data from 2002 we used Cygnus A as a bandpass calibrator, 3C 48 as a flux calibrator, and initial phase calibration was done with 2321163. The 2003 observations at 330 MHz used the same bandpass and flux calibrators, and initial phases were calibrated with 3C 48.
The data analysis procedure followed the standard spectral line analysis for cm-wavelength data. The RFI environment at frequencies around 330 MHz consists mainly of narrow-band interference spikes. Flagging was initially done on the Stokes data as astrophysical sources show very little circular polarization while RFI is often highly circularly polarized. Additional flagging was undertaken to remove data with large positive or negative deviations from surrounding data. We also made use of wide-field imaging techniques to map the primary beam area to reduce the effects of confusing sources.
In addition to our new observations, we have also analyzed archival VLA observations of PKS 2322123 taken at 1.3 and 5 GHz with the VLA in phased array. This data set was taken in continuum mode and was reduced following standard cm-wavelength techniques. Both data sets used 3C 286 as a flux calibrator, and 2246121 for phase calibration. All radio observations are listed in Table 1.
3. Radio and X-ray Interactions
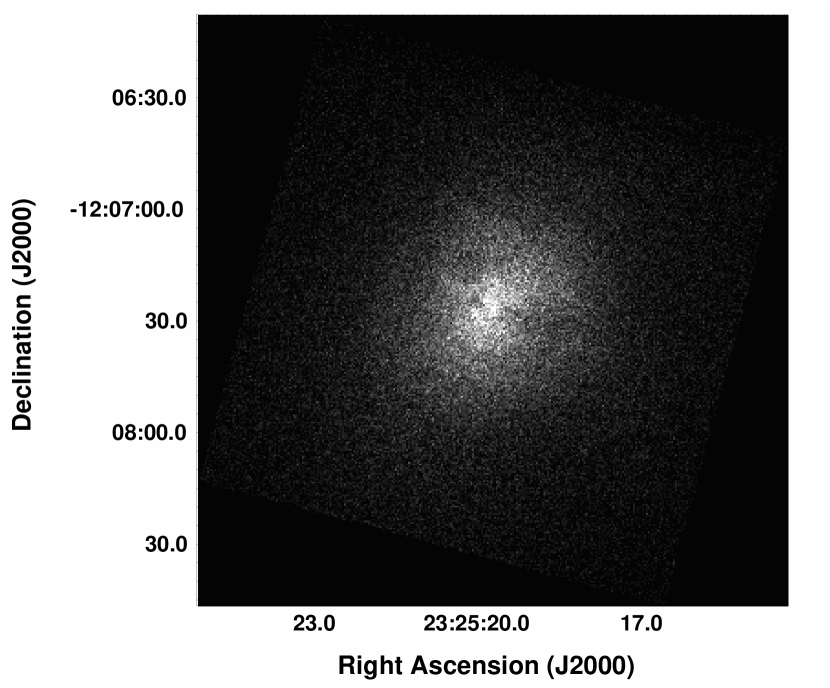
We show the raw image of the central kpc of Abell 2597 in Figure 1. This image shows the outer “ghost” cavities seen by McNamara et al. (2001) as well as additional core structure suggestive of inner cavities. To investigate the core structure in more detail we have fitted a smooth elliptical model to the data and subtracted it to produce the residual image in Figure 2. The model fit was done using Gaussian smoothed () data in the IRAF STSDAS task ellipse. The fits allowed the ellipticity, intensity, and position angle of the elliptical isophotes to vary within each annulus but kept the annuli centered at the position of the compact radio core. The residual image shows the central kpc region of the cluster, with a number of X-ray excess (bright) and deficit (dark) regions visible. The dashed lines roughly outline the “ghost” cavities from McNamara et al. (2001). In our residual image, the cavity to the west appears to be part of an X-ray tunnel running from the radio core to a projected radius of roughly 34 kpc (22″) at a position angle (measured from north to east) of °. The McNamara et al. cavity to the northeast is less striking, although there appears to be a partial rim to the south of it. Between the core and northeast cavity there is a compact, roughly 15 radius, depression surrounded by regions of X-ray excess which may represent an inner cavity. Note that all of these features are visible in the raw image (Figure 1), although the more extended ones are more evident in the smoothed residual image (Figure 2).
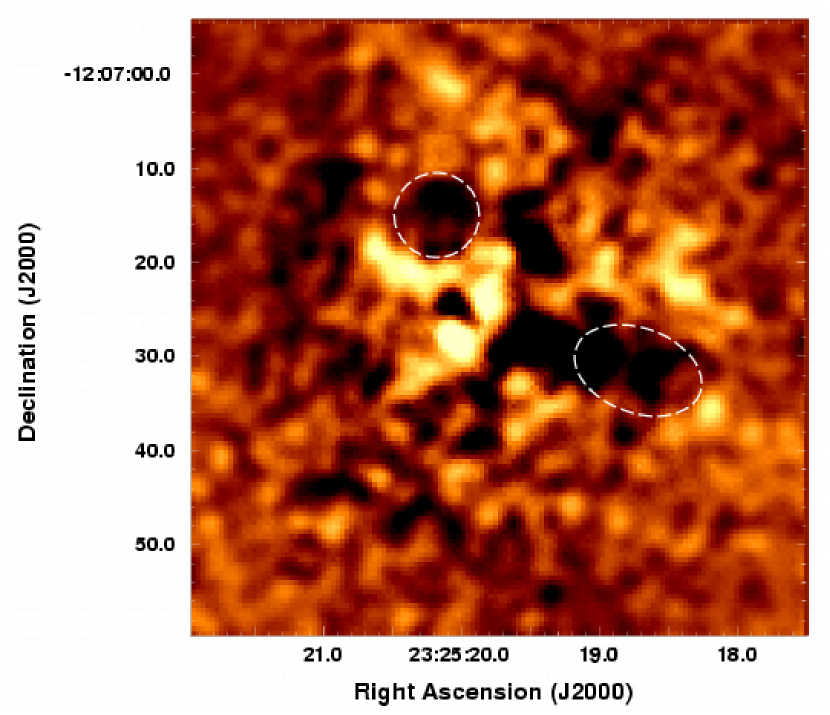
We estimated the significance of the western X-ray tunnel by comparing the keV counts in a 30° pie-wedge of an annulus with width equal to the length of the tunnel and centered on the cluster core, to the counts in the remainder of the annulus. This method provides a conservative estimate that the tunnel is an 18 deficit over the remainder of the annulus. Using a similar approach to determine the significance of the eastern bubble by comparing the counts in a 30° pie wedge on the hole to the remainder of the annulus (excluding the 30° wedge on the tunnel) we find it represents a 7 deficit.
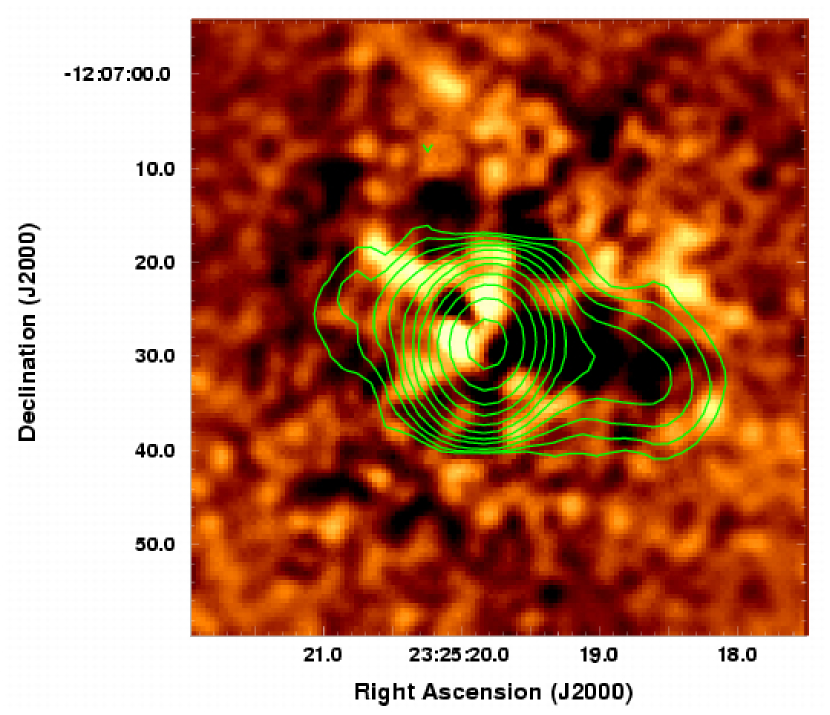
In Figure 3 we overlay our 330 MHz A configuration contours on the X-ray residual image. Although the compact central structure is unresolved at these low frequencies, there is a radio extension running to the west such that the total source size is 68 kpc. Figure 3 shows a striking correlation between the western radio extension and the X-ray tunnel. A similar, although less correlated, low frequency connection is seen with the 74 MHz extensions toward the “ghost” cavities in Perseus (Fabian et al., 2000). There is also a shorter extension to the east, although with our current data, we find no evidence of low frequency radio emission filling the northeastern “ghost” cavity. The total flux of the radio source at 330 MHz is Jy.
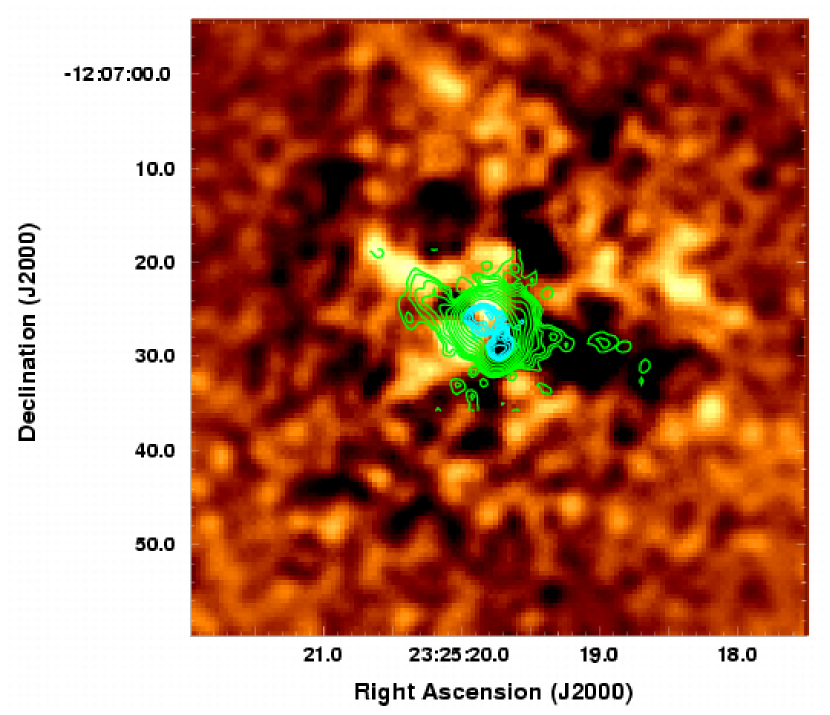
The inner radio lobe structure of the source is seen in Figure 4 where we overlay our two highest resolution radio data sets (5.0 and 1.3 GHz) on the residual image. Pollack, Taylor, & Allen (2005) present the details of the spatial and spectral properties of the inner lobes at frequencies of 5, 8, and 15 GHz. We note that even higher resolution VLBA observations by Taylor et al. (1999) reveal symmetric inner jets at position angles of and . The compact 5 GHz radio source has a total extent of 67 (10 kpc) and a total flux of mJy. The core of the 5 GHz radio source sits on the border of the complex X-ray residual structure with the southern jet and lobe located at the edge of the X-ray tunnel, and the northern lobe bounded to the north and east by regions of excess and to the northeast by a region of X-ray deficit. Given the compact nature of the 5 GHz source, it may be very difficult, even with deeper observations, to image the region around the inner radio structure accurately enough to determine if the inner lobes are interacting with the thermal gas. The 1.3 GHz radio contours surround the 5 GHz source and reveal an extension toward the east to a distance of roughly 16 kpc from the compact radio core. This emission appears to extend along a region of X-ray deficit into the (compact) X-ray hole located beyond the northern 5 GHz radio lobe. There is a region of X-ray excess at the end of the radio extension. The C-shaped central 1.3 GHz emission also shows a small excess toward the northwest, as well as weak features to the west which may trace the western 330 MHz radio extension.
4. Discussion
Our new radio observations of the central source in A2597 show that the well-known compact 8 GHz source has complex radio structure at lower frequencies. At the highest resolution the source contains an inverted spectrum core and symmetric radio jets extending to the northeast and southwest (Taylor et al., 1999). On larger scales, the southwest jet appears to undergo a direction change to the south at a distance of 0.8 kpc from the core before merging into the southern inner lobe (Sarazin et al., 1995). Although the northern lobe has a bright ridge to the north, Sarazin et al. find no clear evidence on larger scales of the counterjet at 8 GHz. Similar morphology for the compact inner structure is seen in our 5 GHz image which shows a well resolved compact source.
Lower frequency observations at 1.3 GHz show the bright C-shaped inner source is surrounded by extensions to the northwest, west, and east (Figure 4). The eastern extension is surrounded by bright X-ray emission and is coincident with an X-ray deficit, thus it may represent emission from a previous outburst which has risen buoyantly beyond the lobes of the higher frequency source. Using the observed separation of 10 kpc between the eastern extension and inner lobe, a buoyant lobe rising at 60% of the sound speed222Enßlin & Heinz (2002) estimate the buoyancy rise time of radio plasma to be , where is the bubble radius, is the cluster core radius, and is the sound speed. We use the 330 MHz emission to estimate and obtain the core radius from Pollack, Taylor, & Allen (2005). ( km s-1) would reach the observed (projected) location on a timescale yr.
Although it has been known for some time that the compact C-shaped source in A2597 is surrounded by H and [O II] filaments (Koekemoer et al., 1999), recent STIS FUV images by O’Dea et al. (2004) reveal filaments of diffuse Ly emission extending to radial distances of 10″ (15 kpc) from the radio core. A comparison of the Ly image with our 1.3 GHz image reveals that the northeastern Ly filament traces the outer edge of the eastern 1.3 GHz radio extension (Clarke et al., in preparation). The curved Ly filament morphology and its connection to an X-ray deficit in A2597 are reminiscent of the H filament associated with the outer radio bubbles in Perseus which was used to place limits on the turbulence in the ICM (Fabian et al., 2003b).
Observations of the central source at 330 MHz reveal radio emission extending 25″ (38 kpc) to the west of the radio core. We also see indications of this emission, at a very low level, in the 1.3 GHz data. The location and spatial distribution of the 330 MHz radio emission is well correlated with the X-ray tunnel seen as a deficit in the residual images (Figure 3). The current radio data do not have sufficient resolution to determine if the radio extension is connected to the central radio source, or if it represents a detached buoyant radio lobe. It is interesting to note that the symmetric VLBA jets of Taylor et al. (1999) extend along a position angle that is aligned to within 4° of the angle along the center of the tunnel from the radio core.
The X-ray tunnel connected to the radio core in A2597 may represent an intermediate case between bubbles created by an active galaxy and those resulting from buoyant lobes. We have used our 330 MHz radio data to estimate the minimum energy synchrotron properties of the western extension. We assume that the emission from the extension comes from a uniform prolate cylinder with filling factor of unity, and that there is equal energy in relativistic ions and electrons. The calculations use a spectral index of determined between 330 MHz and 1.3 GHz for the tunnel, and a radio extension size of kpc. Using a model with the magnetic field perpendicular to the line of sight, and lower and upper cutoff frequencies of 10 MHz and 100 GHz, we estimate minimum energy magnetic field strength of G, minimum energy non-thermal pressure of dyn cm-2, and synchrotron lifetime of yr. Comparing this to the buoyancy rise time (at 0.6) of yr for the bubble to move from the projected location of the inner southern lobe to the end of the tunnel, suggests that the electrons have been (re)accelerated in-situ in the X-ray tunnel. Although the buoyancy rise time is likely an underestimate due to the unknown projection effects, we note also that the radio spectrum may flatten below 330 MHz along the western extension, and thus the synchrotron lifetime of the particles may be somewhat longer than calculated above. Assuming a spectral index of , minimum energy estimates give a synchrotron lifetime of yr. More detailed radio and X-ray observations are required to further investigate these timescales.
The high frequency observations reveal that the inner southern jet deflects toward the south at the location of a bright Ly blob (O’Dea et al., 2004). It is possible that the western extension was previously fed by the radio jet prior to deflection, or it may represent a buoyantly rising lobe from a previous outburst. Alternatively, if the inner radio structure is porous, the tunnel may be fed by a continuous flow of radio plasma from the inner jets as suggested by Owen et al. (2000) for M87. We will undertake a spectral study of this emission from deeper radio observations in a future paper.
References
- Bennett et al. (2003) Bennett, C. L. et al. 2003, ApJS, 148, 1
- Bîrzan et al. (2004) Bîrzan, L., Rafferty, D. A., McNamara, B. R., Wise, M. W., & Nulsen, P. E. J. 2004, ApJ, 607, 800
- Blanton et al. (2003) Blanton, E. L., Sarazin, C. L., & McNamara, B. R. 2003, ApJ, 585, 227
- Blanton et al. (2001) Blanton, E. L., Sarazin, C. L., McNamara, B. R., & Wise, M. W. 2001, ApJ, 558, L15
- Böhringer et al. (1993) Böhringer, H., Voges, W., Fabian, A. C., Edge, A. C., & Neumann, D. M. 1993, MNRAS, 264, L25
- Clarke et al. (2001) Clarke, T. E., Kronberg, P. P., & Böhringer, H. 2001, ApJ, 547, L111
- Enßlin & Gopal-Krishna (2001) Enßlin, T. A. & Gopal-Krishna 2001, A&A, 366, 26
- Enßlin & Heinz (2002) Enßlin, T. A., & Heinz, S. 2002, A&A, 384, L27
- Fabian (1994) Fabian, A. C. 1994, ARA&A, 32, 277
- Fabian et al. (2002) Fabian, A. C., Celotti, A., Blundell, K. M., Kassim, N. E., & Perley, R. A. 2002, MNRAS, 331, 369
- Fabian et al. (2000) Fabian, A. C., et al. 2000, MNRAS, 318, L65
- Fabian et al. (2003a) Fabian, A. C., Sanders, J. S., Allen, S. W., Crawford, C. S., Iwasawa, K., Johnstone, R. M., Schmidt, R. W., & Taylor, G. B. 2003a, MNRAS, 344, L43
- Fabian et al. (2003b) Fabian, A. C., Sanders, J. S., Crawford, C. S., Conselice, C. J., Gallagher, J. S., & Wyse, R. F. G. 2003b, MNRAS, 344, L48
- Feretti et al. (1999) Feretti, L., Dallacasa, D., Govoni, F., Giovannini, G., Taylor, G. B., & Klein, U. 1999, A&A, 344, 472
- Forman et al. (2003) Forman, W. et al. 2003, ApJ submitted, astro-ph/0312576
- Heinz et al. (1998) Heinz, S., Reynolds, C. S., & Begelman, M. C. 1998, ApJ, 501, 126
- Heinz et al. (2002) Heinz, S., Choi, Y., Reynolds, C. S., & Begelman, M. C. 2002, ApJ, 569, L79
- Koekemoer et al. (1999) Koekemoer, A. M., O’Dea, C. P., Sarazin, C. L., McNamara, B. R., Donahue, M., Voit, G. M., Baum, S. A., & Gallimore, J. F. 1999, ApJ, 525, 621
- McNamara et al. (2001) McNamara, B. R. et al. 2001, ApJ, 562, L149
- McNamara et al. (2000) McNamara, B. R., et al. 2000, ApJ, 534, L135
- O’Dea et al. (2004) O’Dea, C. P., Baum, S. A., Mack, J., Koekemoer, A. M., & Laor, A. 2004, ApJ, 612, 131
- Pollack, Taylor, & Allen (2005) Pollack, L. K., Taylor, G. B., & Allen, S. W. 2005, MNRAS submitted
- Owen et al. (2000) Owen, F. N., Eilek, J. A., & Kassim, N. E. 2000, ApJ, 543, 611
- Sarazin et al. (1995) Sarazin, C. L., Burns, J. O., Roettiger, K., & McNamara, B. R. 1995, ApJ, 447, 559
- Taylor et al. (2002) Taylor, G. B., Fabian, A. C., & Allen, S. W. 2002, MNRAS, 334, 769
- Taylor et al. (1999) Taylor, G. B., O’Dea, C. P., Peck, A. B., & Koekemoer, A. M. 1999, ApJ, 512, L27