VLA Polarimetry Observations of PKS 2322123;
Estimating Magnetic Fields in the Abell 2597 Cluster
Abstract
We present 5, 8, and 15 GHz total intensity and polarimetric observations of the radio source PKS 2322123 taken with the Very Large Array (VLA). This small (11 kpc) source is located at the center of the cooling-core cluster Abell 2597. The inner X-ray structure, the radio morphology, and the steep spectral index () in the lobes, all suggest that the radio emission is confined by the ambient X-ray gas. We detect a small region of polarized flux in the southern lobe and are able to calculate a Faraday rotation measure (RM) of 3620 rad m-2 over this region. Based on these observations and Chandra X-ray data we suggest that the southern lobe has been deflected from its original southwestern orientation to the south and into our line-of-sight. Using the observed RMs and our calculated electron density profiles, and assuming both a uniform and tangled magnetic field topology, we estimate a lower limit of the line-of-sight cluster magnetic field, G.
keywords:
galaxies: clusters: individual (A 2597) – intergalactic medium – magnetic fields – polarization – radio continuum: galaxies1 Introduction
Strong radio galaxies embedded in galaxy clusters have been used successfully to probe the intracluster medium (ICM). Taylor et al. (1994) defined a sample of 14 clusters found in the flux-limited, all-sky X-ray sample devised by Edge et al. (1992), and determined that clusters with nonzero estimated mass flow rates and embedded radio galaxies with mJy commonly display significant rotation measures (RM), often in excess of 800 rad m-2, with the magnitude of the RM proportional to the estimated cooling flow rate. The observed RMs are thought to be caused by Faraday rotation through a magnetized cluster gas, and detailed studies of these high RM sources suggest that minimum cluster magnetic fields of 5 – G are common in cooling core clusters Carilli & Taylor (2002).
A 2597 is one of the last in the sample of 14 clusters to be analyzed. Edge et al. (1992) classified A 2597 as a cooling core cluster, and numerous other observations have confirmed nonzero cooling flow rates. Most notably, the analysis of XMM-Newton and Chandra X-ray data by Morris & Fabian (2004) inferred a mass cooling rate of yr-1 across the central regions of the cluster. As a cooling core cluster, A 2597 is expected to have high-density ambient gas that disturbs the radio jets of embedded sources Loken et al. (1993). Chandra observations by McNamara et al. (2001) confirm the complex X-ray gas environment, and the detection of extended broad-line Hi absorption toward the embedded radio source PKS 2322123 by O’Dea et al. (1994) can be attributed to a population of clouds condensing out of the hot gas, though the mass rate is only a small fraction of the inferred cooling flow rates. Very Long Baseline Array (VLBA) observations of PKS 2322123 made by Taylor et al. (1999) show a symmetric parsec-scale jet structure. These observations along with previous radio images by Sarazin et al. (1995) that reveal a kiloparsec-scale, asymmetric, steep-spectrum jet morphology support the idea that the radio galaxy is confined and distorted in the high pressure cluster environment.
Here we discuss our multi-frequency polarimetric VLA observations of the embedded radio source PKS 2322123 (z=0.083). We use the polarized flux associated with synchrotron radiation from the radio jets to calculate RMs, and then estimate cluster magnetic fields assuming two different field topologies. In § 2 we describe our radio observations, in § 3 we calculate an electron density profile based on X-ray observations, in § 4 we present our results, and in § 5 we make magnetic field estimates, suggest a source orientation, and compare our observations with the literature. Throughout this paper we assume km s-1 Mpc-1, , and so that 1″=1.542 kpc at z=0.083.
2 Radio Observations and Data Reduction
| Date | Frequency | Bandwidth | Config. | Duration |
|---|---|---|---|---|
| (MHz) | (MHz) | (hours) | ||
| Jul 1991 | 8415/8465 | 50 | A | 0.11 |
| Aug 1991 | 8415/8465 | 50 | A | 0.11 |
| Jul 1994 | 7815/8165 | 50 | B | 0.69 |
| Jul 1994 | 8515/8885 | 50 | B | 0.61 |
| Jul 1994 | 14785/15185 | 50 | B | 1.39 |
| Dec 1996 | 4985 | 50 | A | 1.18 |
Very Large Array observations of the radio source PKS 2322123 were made at 4.985, 7.815, 8.165, 8.415, 8.465, 8.515, 8.885, 14.785 and 15.185 GHz. The total time on source is 1.18 hours at 5 GHz, 1.52 hours at 8 GHz, and 1.39 hours at 15 GHz. Observations in the 5 GHz band were carried out with the phased VLA. Details regarding these observations are given in Table 1. During the July 1994 observations the source 3C 48 was used as the primary flux density calibrator and 3C 138 was used as an absolute reference for the electric vector polarization angle (EVPA), . Phase calibration was derived from the nearby compact source 2345167 with a time between calibrators of 40 minutes. The source 0420+417 was used to obtain instrumental calibration of polarization leakage terms, and was observed over a wide range of parallactic angle. During the December 1996 observations and the July and August 1991 observations, the source 3C 286 was used both as the primary flux density calibrator and as the EVPA calibrator. Phase calibration was derived from nearby compact sources. No polarized intensity images were used from the 1991 and 1996 observations.
The data were reduced in AIPS (Astronomical Image Processing System) following the standard procedures, and stokes , and images were produced using the AIPS task IMAGR. We combined multiple frequencies within each observing band to produce Stokes images with increased sensitivity and better () coverage. At 8 GHz, the combined data includes observations with the VLA in both the A and B configurations. Where frequencies have been combined, we assume the resultant frequency to be the average of the included frequencies. The spectral index images were made using combined frequency images with matched resolutions. We define the spectral index, , as .
The Faraday rotation measure image was created from the four frequencies spread out over the 8 GHz observing band in the July 1994 data set. Data at 5 and 15 GHz were not included in the RM map because no polarized flux was detected at these frequencies. For the four frequencies used in the RM map, polarized intensity, , images and polarization angle, , images were derived from and images. A pixel by pixel least squares fit of versus gives the RM value and an RM error estimate. Pixels in the RM map were flagged if they have an error in greater than 20°for any of the four frequencies used.
During data reduction we found a 0.73 mJy compact source, most likely a background AGN, located at a right ascension of and declination of (J2000). In order to reduce the sidelobes from this source, we made a large image of PKS 2322123 and cleaned the 0.73 mJy source.
| Property | PKS 2322123 |
|---|---|
| core RA (J2000) | |
| Dec. (J2000) | |
| Gal. lat. () | 64.85° |
| Gal. long. () | 65.35° |
| radial velocitya | 24880 12 km s-1 |
| distance from cluster center | 0.0 Mpc |
| luminosity distance | 373.0 Mpc |
| angular size | 7″ |
| physical size | 10.8 kpc |
| flux density (5 GHz) | 365 mJy |
| power (5 GHz) | 6.08 1024 W Hz-1 |
| RM | 3620 rad m-2 |
| 1080 rad m-2 |
aRadial velocity is determined from Hi absorption observed toward the nucleus of PKS 2322123 Taylor et al. (1999).
3 X-ray Observations
McNamara et al. (2001) report X-ray observations of the galaxy cluster A 2597 made in July 2000 using the Advanced CCD Imaging Spectrometer detector on Chandra. Here, we present a re-analysis of those data using updated software and calibration products.
The standard level-1 event list produced by the Chandra pipeline processing was reprocessed using the (version 3.0.2) software package, including the latest gain maps and calibration products. Bad pixels were removed and standard grade selections applied. Time-dependent gain corrections were applied using A. Vikhlinin’s apply_gain routine. The data were cleaned from periods of anomalously high background using the same author’s lc_clean script and the recommended energy ranges and bin sizes for the back-illuminated (S3) detector. The net exposure time was 6.9ks.
The data have been analysed using the methods described by Allen et al. (2004). In brief, concentric annular spectra, centred on the radio source, were extracted from the cleaned events list. Background spectra were extracted from blank-field background data sets. Separate photon-weighted response matrices and effective area files were constructed for each region using the calibration files appropriate for the time of observation. The data were analysed using an enhanced version of the Cambridge image deprojection code and XSPEC (version 11.3: Arnaud 1996). We have used the MEKAL plasma emission code (Kaastra & Mewe 1993; incorporating the Fe-L calculations of Liedhal, Osterheld & Goldstein 1995) and the photoelectric absorption models of Balucinska-Church & McCammon (1992). The ACISABS model was used to account for time-dependent contamination along the instrument light path. Only data in the keV energy range were used for the analysis. The spectra for all annuli were modelled simultaneously in order to determine the deprojected X-ray gas temperature profile under the assumption of spherical symmetry. These data were then combined with the observed surface brightness profile to constrain the gas density profile.
We have fitted the electron density () profile for the central 300 kpc of the cluster using a modified King model Cavaliere & Fusco-Femiano (1976),
From this analysis we measure a central density, cm-3, a core radius, kpc, and a slope parameter, . The model fit, which gives an acceptable reduced value of 0.96, is shown as a dotted line in Figure 1. The modified King model does not parameterize the gas density at large radii for the A 2597 cluster. In this paper we only use the results of this model in the central 200 kpc where this parametrization adequately describes the gas density.

4 Results
Figure 2 shows total intensity contour images of PKS 2322123 at 4985, 8377, and 14985 MHz. In all three frequency bands the source has an asymmetric structure about the core; there is one area of diffuse emission located northeast of the core and another area located directly south of the core. We call these areas northern and southern lobes. Both the northern and southern lobes extend out from the core to a distance of approximately 3.5″, or 5.4 kpc, giving the source a total size of 7″, or 10.8 kpc. There is a component 0.5″ southwest of the core that we refer to as the inner jet. The inner jet is most pronounced in the highest resolution 8 GHz image. The 15 GHz image, because taken in the VLA’s B configuration, does not resolve the inner jet as well despite the fact that it is our highest frequency.
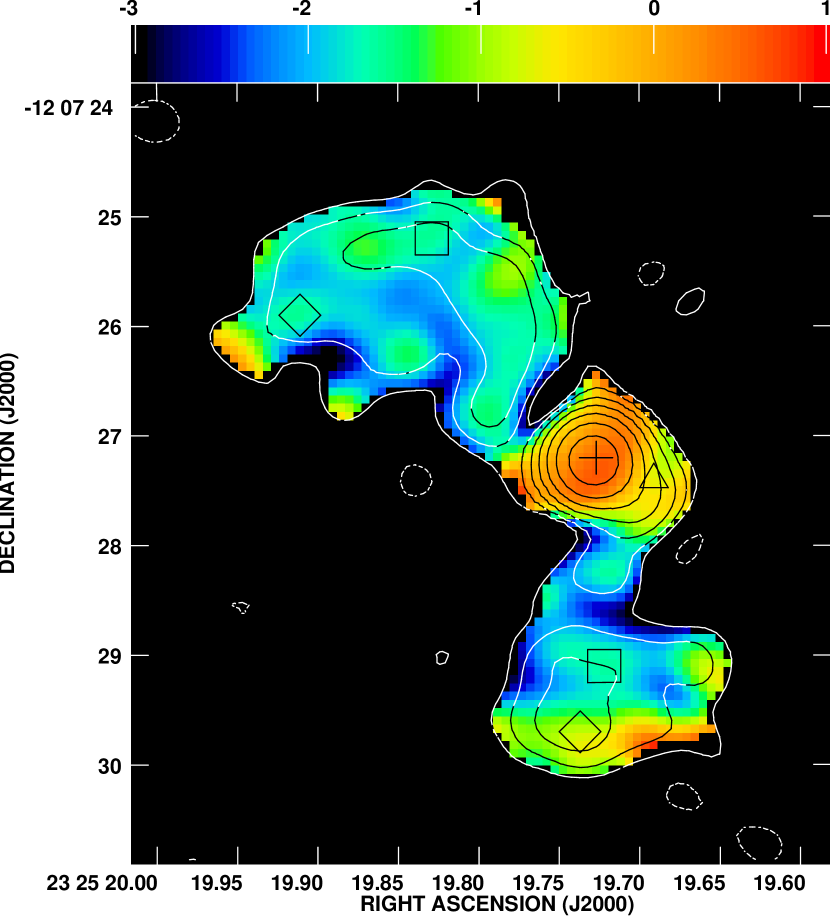
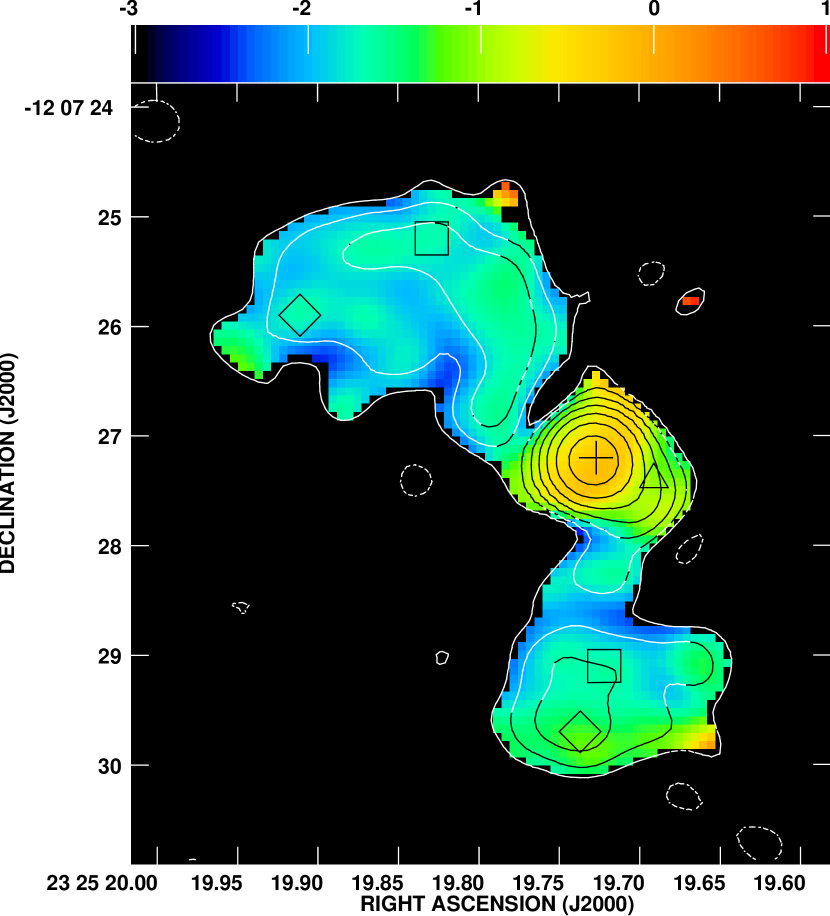

Figures 3 and 4 show matched resolution spectral index maps of PKS 2322123 in which and are measured, respectively. Both maps are overlayed with total intensity contours from the 14985 MHz image, and the color bar ranges from to +1. The northern and southern lobes have very steep spectra with typical values of , which is slightly steeper than the spectral index of 1.5 previously observed by Sarazin et al. (1995). The core and inner jet both have flatter spectra with typical values in the core ranging from to 0.2 depending on the frequencies. It is interesting to note in Figure 3 that the spectrum flattens in the southern region of the southern lobe. The flattening is visible, but less pronounced in Figure 4. No significant flattening of the spectrum occurs in the northern lobe. The cross and triangle symbols plotted over the spectral index maps mark the total intensity centroid positions of the core and inner jet. The square and diamond symbols mark four positions chosen for comparison in the northern and southern lobes. These symbols are used in Figure 5 to show the difference in flux densities at our three observing bands; in each of the four plots the spectral index is given by the slope of the segmented line. There appears to be no roll-off in the spectral index at low or high frequencies. Note that our 5 GHz, 8 GHz, and 15 GHz observations were taken in 1991, 1994, and 1996, respectively, so that the apparent dip in the spectral index plot of the compact core component may be due to source variability on a time scale of 3 years.
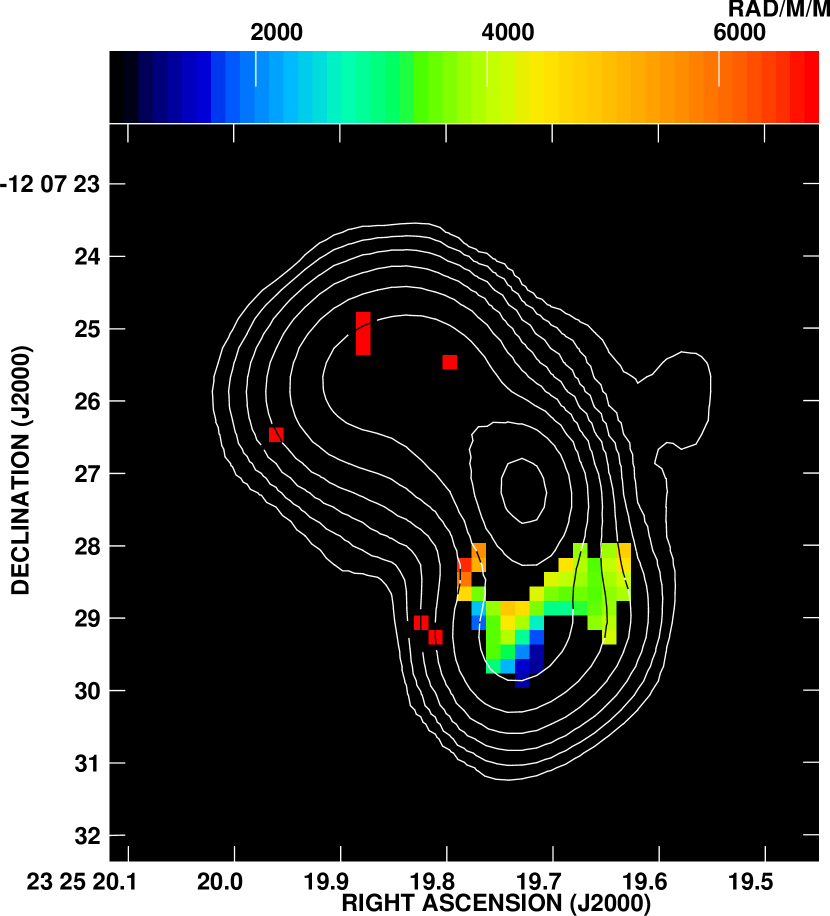
Figure 6 shows the rotation measure distribution created from 7815, 8165, 8515, and 8885 MHz. The color bar ranges from RM values of 800 rad m-2 to 6800 rad m-2. Pixels with an error in the map of greater than 20°for any of the four frequencies have been flagged, and pixels corresponding to source locations with less than 200 Jy beam-1 of total intensity flux at 8165 MHz are not shown. The overlayed contour lines show total intensity at 8885 MHz. Note that the polarized flux only appears in a small region of the southern lobe. Figure 7 shows RM fits for two pixels located in the cluster of pixels in the southern lobe. The fits result in rotation measures of rad m-2 and rad m-2, which are typical values for this source. Using the 62 pixels clustered together in the southern lobe, and excluding four pixels due to bad RM fits, we produce a histogram of the rotation measure in Figure 8. The histogram shows a mean RM value of 3620 rad m-2 and dispersion of 1080 rad m-2. Because we have only 62 unflagged pixels in our RM map spanning about two beam widths, we consider there to be only one coherent area of the source with an RM value, namely the mean value. Although an RM dispersion of 1000 rad m-2 is not atypical, due to the small number of clustered pixels in our histogram we do not consider this dispersion to be representative of the physical spread in RMs across the source. Instead, this dispersion most likely results from our low signal and is due to errors in the RM determination which are estimated to be 700 rad m-2.
5 Discussion
5.1 Magnetic Field Strengths and Topologies
At its high galactic latitude (°), A 2597 is far from the plane of our galaxy, and at its location we expect galactic RMs of less than 30 rad m-2 Simard-Normandin & Kronberg (1980). Therefore our observed RMs located at a projected distance of 2″ from the cluster center are most likely the result of Faraday rotation from a magnetized cluster gas, or Faraday rotation from a magnetic field within the cD galaxy which is located at the center of the cluster. It is also possible that the RMs are the result of interaction between the radio galaxy and the surrounding ICM Bicknell et al. (1990), however with polarized flux over a region of only 5 kpc, it is difficult to determine which of these scenarios produces the dominant field. Based on similar findings of high RMs in cooling core clusters with embedded sources of very different morphologies Carilli & Taylor (2002), we favor a cluster magnetic field interpretation.
5.1.1 A Uniform Cluster Magnetic Field
Assuming that the rotation measure is the result of a magnetized cluster gas, rotation measures can be related to the line-of-sight magnetic field, , by
where is measured in G, in cm-3, d in kpc, and the upper limit of integration, , is the distance from the emitting source to the end of the path through the Faraday screen along the line of sight.
We can estimate the minimum magnetic field needed to produce our observed RMs by making the simplest assumptions of a constant electron density, , and a uniform magnetic field out to a distance of the core radius, . Using the values calculated in §3, and setting the rotation measure equal to our mean observed RM of 3620 rad m-2, we find G. This is a lower limit on the magnetic field strength because any field reversal along the line of sight would require a larger magnetic field to produce the same observed RM. Note that for the density falls off as and, assuming flux conservation, the magnetic field scales with . This results in the rotation measure scaling with so that the contribution to the RM is dominated by the cluster center.
5.1.2 A Tangled Cluster Magnetic Field

A more realistic estimate of the magnetic field assumes random field reversals on the order of a coherence length. Although in figure 6 the RM values are purely positive so that field reversals are not apparent, from the patchiness of the RM distributions observed in other sources, magnetic fields ordered on scales of 5 kpc are common Carilli & Taylor (2002). Due to the small region of polarized intensity in PKS 2322123 it is difficult to determine a suitable cell size by estimating the coherence length in the RM map. Therefore we use a cell size of 5 kpc, a typical value for both cooling core and noncooling core clusters Carilli & Taylor (2002). Using the relation derived by Felten (1996), we can estimate the magnetic field assuming our calculated density distribution that follows a profile, and a magnetic field topology with cells of constant size and magnetic field strength, but random orientation.
In this equation, is the cell size in kpc, is the distance (in kpc) of the radio source from the cluster center, is the Gamma function, is given in G and is related to the component along the line of sight by , and K is a factor that depends on the location of the radio source along the line of sight through the cluster: K=624 rad G-1 if the source is beyond the cluster and K=441 rad G-1 if the source is halfway through the cluster. The parameters , , and are as described in §3. Using values given in §3 and in Table LABEL:SourceProperties, and a cell size of 5 kpc, we estimate the cluster magnetic field to be 2.9 G. This estimate which makes use of a tangled magnetic field model gives a line-of-sight magnetic field of G, in agreement with the previous field estimate which assumed a uniform field topology. The fact that these two magnetic field topologies yield similar line-of-sight magnetic field strengths does not suggest any preferred field topology. Rather, it is more likely that used in Equation 3 above is not a robust measurement of the true RM dispersion since the region covered is only a few beamwidths and the SNR is low. The dispersion is probably more indicative of the quality of the RM fit. Therefore, we conclude only that the cluster magnetic field has a minimum strength of 2.1 G. We note that this magnetic field strength is somewhat lower than the 5 to 10 G typically found in cooling-core clusters Carilli & Taylor (2002) which leads us to believe that a more complicated field topology is present, or that the RM dispersion has been underestimated.
5.2 The Nature of the Radio Source
The radio source PKS 2322123 is located at the center of the galaxy cluster A 2597, and is coincident with a cD galaxy. Its small physical size, steep-spectrum lobes, and disturbed jet morphology all suggest the radio emission is confined by the ambient gas. This is similar to what is seen in the cluster center radio sources PKS 1246-410 in the Centaurus cluster (Taylor, Fabian, & Allen 2002), and PKS 0745-191 in the cluster of the same name Taylor et al. (1994). The steep spectral indices of both the northern and southern lobes can be explained by a trapping of electrons such that low energy particles dominate the emission Myers & Spangler (1985). In the past many people have classified A 2597 as a cooling-core cluster. Our analysis confirms the presence of a high central gas density in the cluster (Figure 1) and a short central cooling time; yr within kpc of the central radio source.
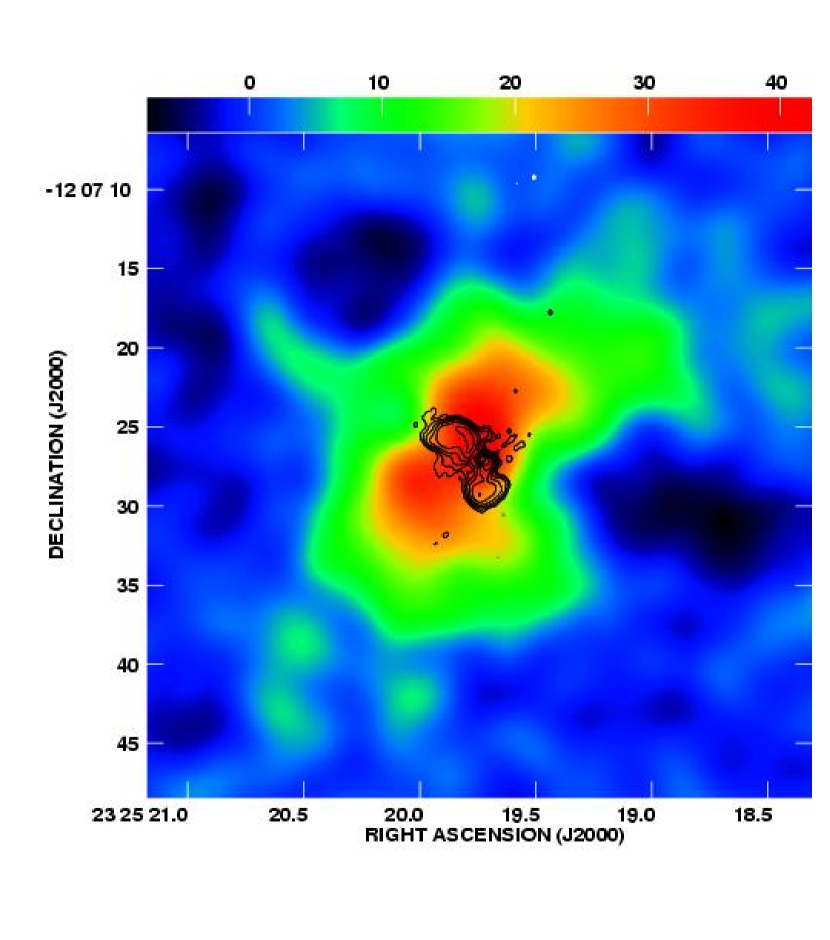
The flattening of the spectral index in the southern part of the southern lobe may be caused by interactions between the radio jet and the surrounding ICM. As the jet moves south hitting the X-ray gas, some of the jet’s kinetic energy may reaccelerate the relativistic particles at the boundary layer, causing the spectrum to flatten. A similar situation may be responsible for the flatter spectrum of the northern radio lobe along its edge. To investigate this idea further we have constructed a 1 arcsec2 pixel image from the X-ray data (reprocessed using relaxed screening criteria that exclude only the largest background flares, resulting in a net exposure time of 28ks). We first lightly smoothed this image, convolving it with a 1.2 arcsecond FWHM Gaussian kernel. This lightly smoothed image was then subtracted from a more heavily smoothed image, constructed by convolving the raw image with a 12 FWHM arcsecond Gaussian kernel. The resulting unsharp-masked image is shown in Figure 9. The X-ray and radio peaks are nicely aligned without any correction to the X-ray position beyond the standard calibration. Enhanced X-ray emission is seen both along the northern edge of the northern lobe, and at the tip of the southern lobe – both regions where the spectral index is seen to flatten. In addition to this evidence of interaction between the radio jet and the ICM at the edges of the lobes, Koekemoer et al. (1999) find H emission-line filaments that trace the northern and southern lobes on the northwest and southeast edges, respectively. These edge-brightened arcs further suggest physical interactions at the boundary layer.

One explanation for the lack of detectable polarization in the northern lobe is that we have a greater Faraday depth towards this lobe, resulting in beamwidth depolarization. We calculate that at 8 GHz a Faraday rotation gradient of 350 rad m-2 kpc-1 is sufficient to rotate by 1 radian over our 2 kpc beam, thus causing depolarization over the beam width. This would require RMs on the order of 700 rad m-2, 5 times lower than the observed RMs in the southern lobe. Thus Faraday depolarization can easily explain the lack of observed polarized flux in the northern lobe, and the low amounts of polarized flux in the southern lobe as well.
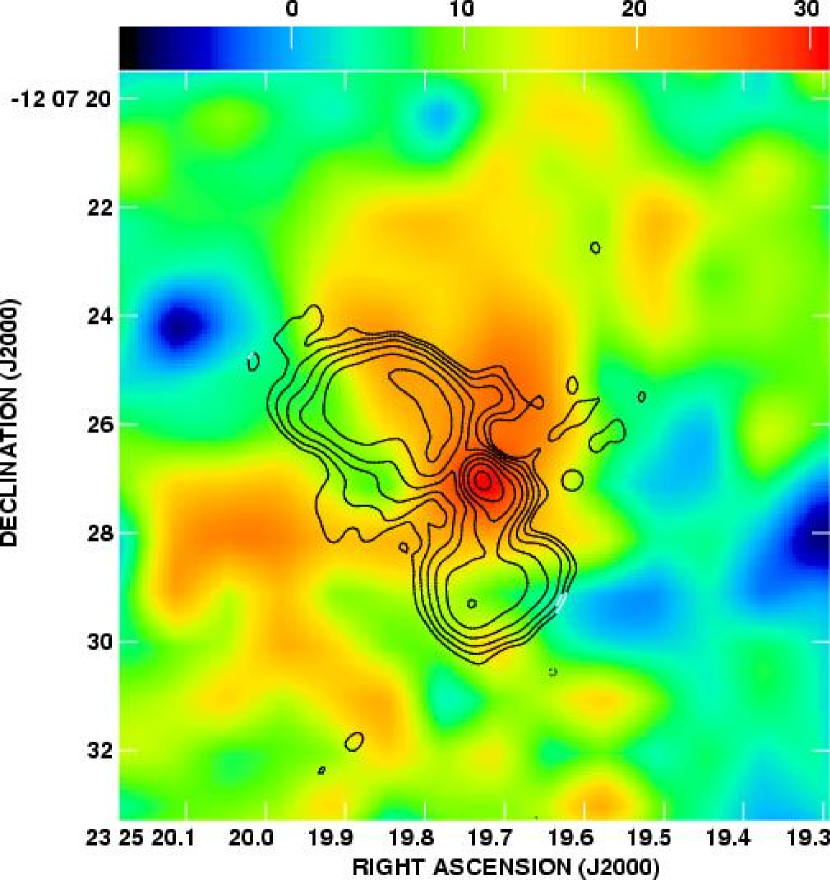
Two low density cavities were detected some 10s of arcseconds northeast and southwest of the radio core by McNamara (2001). These two cavities can be clearly seen in Figure 10. According to McNamara (2001) the low density cavities are at a projected distance of roughly 30 kpc from the center of the cluster. The X-ray cavities detected by McNamara et al. (2001) suggest some interesting jet movement. McNamara (2001) gives evidence supporting the idea that the cavities are associated with a radio outburst that occurred 50 – 100 Myr ago. The recent discovery of 330 MHz radio emission in the western cavity by Clarke et al. (in prep) confirms the relic radio outburst theory. We suggest that the same radio jet that made the southern lobe in our current observations was oriented southwest of the core in that previous radio episode and was deflected to the south at a later time. It is possible that as the relic radio bubble rose outward, the X-ray gas filling in the volume at low radii provided the additional pressure that caused the jet’s deflection. VLBA observations of PKS 2322123 show that on milliarcsecond scales the radio source is symmetric and has a northeast, southwest orientation Taylor et al. (1999), providing further evidence that the southern jet begins in a southwesterly direction and is deflected to the south. Our observations of a bright inner jet southwest of the core (most easily seen in Figure 2b) are consistent with the VLBA observations and the theory of a deflected jet. The inner jet’s relatively high flux density may be caused by interactions at the boundary layer at the deflection point. If the southern lobe of the radio source is propagating toward us, then we note that the observed angle through which the southern jet is deflected may be larger than the actual deflection angle due to projection effects. Finally, based on the detection of Hi absorption toward the core and northeastern inner jet by Taylor et al. (1999), we suggest a source morphology in which the southern, deflected jet is on the approaching side. The fact that Hi was not detected toward the southwestern jet can be explained if the Hi is in a torus around the core, and the southwestern jet is on the approaching side.
If our deflected jet scenario is correct, then we may expect to see a pressure imbalance between the thermal X-ray gas and non-thermal gas in the radio lobes. We might expect the X-ray gas to have equal or greater pressure than the non-thermal gas; this would be consistent with our analysis of a small, confined radio jet. But in fact, using a minimum energy condition described by Miley (1980), we calculate the minimum pressure of the radio source to be erg cm-3 in both the northern and southern lobes, and erg cm-3 in the inner jet. The lobe values are in rough agreement with our calculated X-ray gas pressure of erg cm-3 in the northern and southern lobes. However, the minimum pressure in the inner radio jet is approximately an order of magnitude larger than the X-ray gas pressure at that radius ( erg cm-3 at kpc). If our assumption of the minimum energy condition is incorrect, and equipartition cannot be assumed, then the radio lobes would have a higher pressure than that which we calculated. Dunn and Fabian (2004) find that though the assumption of equipartition is sometimes correct, often it fails for reasons not well understood.
An alternative theory to that of the deflected southern jet is a precessing radio jet as described by Gower et al. (1982). If precession rather than deflection is the cause of the misalignment between the X-ray cavity and southern radio lobe, then the inner jet we observe with the VLA and the symmetry observed with the VLBA are evidence that the jet has now returned to the orientation it was in 50 – 100 Myr ago.
6 Conclusions
We detect polarized emission from the southern lobe of the radio source PKS 2322123, which is embedded in the cooling-core cluster A 2597. We calculate this region of polarized flux to have a Faraday rotation measure of 3620 rad m-2, which is consistent with the high RMs observed in other embedded radio sources Taylor et al. (1994); Carilli & Taylor (2002). Assuming both uniform and tangled magnetic field topologies, we use our calculated RMs to estimate a minimum cluster magnetic field of G, which is low compared to the 5 – G typically found in galaxy clusters using similar methods Carilli & Taylor (2002). Because polarized flux was only detected over a very small ( kpc) region, we believe that our low cluster magnetic field estimate is due to an underestimate in the RM dispersion. Future, more sensitive observations made with the Expanded VLA should reveal more polarized flux, allowing us to better estimate the RM dispersion.
We show two spectral index maps in which we measure steep spectrum lobes with and a flatter spectrum core with ranging from 1.2 to 0.2 depending on the frequencies. We suggest that the flattening could be due to a boundary layer interaction with the ISM of the host galaxy. Comparison with the Chandra X-ray observations on the arcsecond scale show some weak evidence for density enhancements at the positions where the radio spectral index flattens. Future low frequency radio observations are needed to test this interaction hypothesis. Low frequency observations will also be interesting to determine the spectral curvature; we see no roll-off in the spectral index at 5, 8, and 15 GHz.
Based on our comparison of our radio observations with previous X-ray McNamara et al. (2001) and VLBA observations Taylor et al. (1999), we advocate a source orientation and morphology in which the southern jet has been deflected south from its original southwestern orientation, and is on the approaching side. Future proper motion studies on milli-arcsecond scales could help determine whether this proposed source orientation is correct. If the western VLBI jet is propagating toward us relativistically, then we would expect to see faster motions on that side due to relativistic effects.
Acknowledgments
We thank Tracy Clarke and an anonymous referee for constructive comments. SWA thanks the Royal Society for support. Support for this work was provided by the National Aeronautics and Space Administration through Chandra Award Number GO4-5134X issued by the Chandra X-ray Observatory Center, which is operated by the Smithsonian Astrophysical Observatory for and on behalf of the National Aeronautics Space Administration under contract NAS8-03060. This research has made use of the NASA/IPAC Extragalactic Database (NED) which is operated by the Jet Propulsion Laboratory, Caltech, under contract with NASA. The National Radio Astronomy Observatory is a facility of the National Science Foundation operated under a cooperative agreement by Associated Universities, Inc.
References
- (1) Allen S.W., Schmidt R.W., Ebeling H., Fabian A.C., van Speybroeck L., 2004, MNRAS, 353, 8457
- (2) Arnaud, K.A., 1996, in Astronomical Data Analysis Software and Systems V, eds. Jacoby G. and Barnes J., ASP Conf. Series volume 101, p17
- (3) Balucinska-Church M., McCammon D., 1992, ApJ, 400, 699
- Bicknell et al. (1990) Bicknell, G. V., Cameron, R. A., & Gingold, R. A. 1990, ApJ, 357, 373
- Carilli & Taylor (2002) Carilli, C. L., Taylor, G. B. 2002, Annu. Rev. Astron. Astrophys., 40,319
- Cavaliere & Fusco-Femiano (1976) Cavaliere, A., Fusco-Femiano, R. 1976, A&A, 49, 137
- (7) Clarke, T.E., Sarazin, C.L., Blanton, E.L., Neumann, D.M., Kassim, N.E. 2005, submitted to ApJ
- (8) Dunn, R.J.H. & Fabian, A.C., 2004, MNRAS, 355, 862
- Edge et al. (1992) Edge, A. C., Stewart, G. C., & Fabian, A. C. 1992, MNRAS, 258, 177
- Felten (1996) Felten, J. B. 1996, in “Clusters, Lensing and the Future of the Universe” eds. Trimble, V., & Reissenegger, A., ASP Conf. Series, Vol. 88, p. 271
- Gower et al. (1982) Gower, A. C., Gregory, P. C., Hutchings, J. B., & Unruh, W. G. 1982, ApJ, 262, 478
- (12) Kaastra J.S., Mewe R., 1993, Legacy, 3, HEASARC, NASA
- (13) Koekemoer, A.M., et al. 1999, ApJ, 525, 621
- (14) Liedhal D.A., Osterheld A.L., Goldstein W.H., 1995, ApJ, 438, L115
- Loken et al. (1993) Loken, C., Burns, J. O., Norman, M. L., & Clarke, D. A. 1993, ApJ, 417, 515
- (16) Morris R.G., Fabian A.C., 2004, MNRAS, submitted
- McNamara et al. (2001) McNamara, B. R., et al. 2001, ApJ, 562, L149
- Miley et al. (1980) Miley, G. 1980, Ann. Rev. Astron. Astrophys., 18, 165
- Myers & Spangler (1985) Myers, S.T., & Spangler, S.R. 1985, ApJ, 291, 52
- O’Dea et al. (1994) O’Dea, C. P., Baum, S. A., & Gallimore, J. F. 1994, ApJ, 436, 669
- Sarazin et al. (1995) Sarazin, C. L., Burns, J. O., Roettiger, K., & McNamara, B. R. 1995, ApJ, 447, 559
- Simard-Normandin & Kronberg (1980) Simard-Normandin, M. & Kronberg, P. P. 1980, ApJ, 242, 74
- Taylor et al. (1994) Taylor, G. B., Barton, E. J., & Ge, J.-P. 1994, AJ, 107, 1942
- Taylor et al. (1999) Taylor, G. B., O’Dea, C. P., Peck, A. B., & Koekemoer, A. M. 1999, ApJ, 512, L27
- Taylor, Fabian & Allen (2002) Taylor, G. B., Fabian, A. C., & Allen, S. W. 2002, MNRAS, 334, 769