XMM-Newton Detection of Pulsations and a Spectral Feature in the X-ray Emission of the Isolated Neutron Star 1RXS J214303.7+065419/RBS 1774
Abstract
We report on the results of a deep XMM-Newton observation of RBS 1774, the most recent dim isolated neutron star candidate found in the ROSAT archive data. Spectral and timing analysis of the high-quality PN and MOS data confirm the association of this source with an isolated neutron star. The spectrum is thermal and blackbody-like, and there is evidence at a significance level that the source is an X-ray pulsar, with spin period of 9.437 s. Spectral fitting reveils the presence of an absorption feature at keV, but at this level data do not have enough resolution to allow us to discriminate between an absorption line or an edge. We compare the newly measured properties of RBS 1774 with those of other known dim isolated neutron stars, and discuss possible interpretations for the absorption feature.
1 Introduction
Over the last decade ROSAT observations have led to the discovery of seven very soft X-ray sources with quite particular characteristics. The extreme values of the X ray-to-optical flux ratio (), the low hydrogen column densities () and the detection of pulsations in the range s in four objects (five with the present one) strongly favor the possibility that these sources are close-by, X-ray emitting, dim, isolated neutron stars (XDINSs; see e.g. Treves et al. 2000 and Haberl 2004 for reviews and Table 1 for a summary).
XDINSs stand apart with respect to other known classes of bona fide isolated neutron stars detected at X-ray energies. All of them are radio-silent, they are not associated with supernova remnants and exhibit a soft X-ray spectrum without evidence of a power-law hard tail. The origin of their X-ray emission has not been fully clarified as yet. The recent measurement of relatively large proper motions in three sources, implying transverse velocities (Kaplan, van Kerkwijk & Anderson 2002; Motch, Zavlin & Haberl 2003; Motch et al. 2005), makes it unlikely that these are old ( yr) neutron stars accreting from the interstellar medium (see e.g. Treves et al. 2000). Most probably the X-rays arise from the cooling of younger objects with an inferred age of – yr.
XDINSs play a key role in compact objects astrophysics being the only sources in which we can have a clean view of the compact star surface, without contamination from magnetospheric emission or emission from a binary companion or a supernova remnant. They appear to be truly “isolated” neutron stars, and only a small number of them has been detected so far. Detailed multiwavelength studies of the largest possible sample of XDINS candidates are therefore fundamental for tracking the evolutionary history of galactic neutron stars, and for shedding light on their thermal and magnetic surface properties.
Spectral analysis carried out so far has convincingly shown that the broadband X-ray emission from XDINSs is well represented by a blackbody continuum, challenging the predictions of conventional atmospheric models. The absence of spectral lines appears to be well established in the brightest XDINS, RX J1856.5-3754 (Drake et al. 2002; Burwitz et al. 2003), while absorption features have been increasingly reported in the spectra of other sources, including RX J1308.6+2127, RX J0720.4-3125, RX J1605.3+3249, RX J0806.4-4123, RX J0420.0-5022 (Haberl et al. 2003; Haberl et al. 2004b; Van Kerkwjik et al. 2004; Haberl et al. 2004a). The absorption features are quite broad, in contrast with the atomic spectral lines predicted by atmospheric models, and they appear at energies eV. Their nature is still uncertain but the intriguing identification with a proton cyclotron resonance has been suggested. Should this interpretation prove correct, it makes XDINSs highly magnetized objects with fields of the order of, or exceeding, a few G. In this respect, the case of RX J0720.4-3125 is particularly interesting: the magnetic field strength derived by line energy, assuming it is a proton cyclotron feature, is in good agreement with that implied by the spindown measure (; Zane et al. 2002; Kaplan et al. 2002; Cropper et al. 2004).
We are still at a stage where every newly discovered XDINS holds important information for understanding the properties of the whole class and may also show some peculiarities which import unique information. RBS 1774 (1RXS J214303.7+065419) has been the most recent XDINSs to be found (Zampieri et al., 2001). The source is listed in the ROSAT Bright Source catalog, and lies about 48′ off-axis in a PSPC pointing of the BL Lac MSS 2143.4+0704. The ROSAT observation had a limited statistics ( net counts), but it had been sufficient to reveal a very soft X-ray spectrum, to which an absorbed blackbody provides an acceptable fit (, ). No modulation with amplitude has been found in the PSPC data. Optical follow-up observations have shown no plausible optical counterpart in the X-ray error box down to , implying an X-to-optical flux ratio . All these properties are very similar to those of the already established XDINSs and make RBS 1774 worth of further investigation.
In this paper we report results from a recent XMM-Newton observation of RBS 1774 and compare the newly measured properties of this source with those of other known members of this class.
2 X-ray Observations
RBS 1774 was observed with XMM-Newton on 2004 May 31 for 30 ks (EPIC PN). All the three EPIC detectors were configured in small window mode. We processed the data using the XMM-Newton SASv6.0.0. We selected periods of low background, with the Good Time Interval (GTI) file leaving an effective exposure of 23 ks (EPIC PN). The same GTI was used for the spectral and timing analysis.
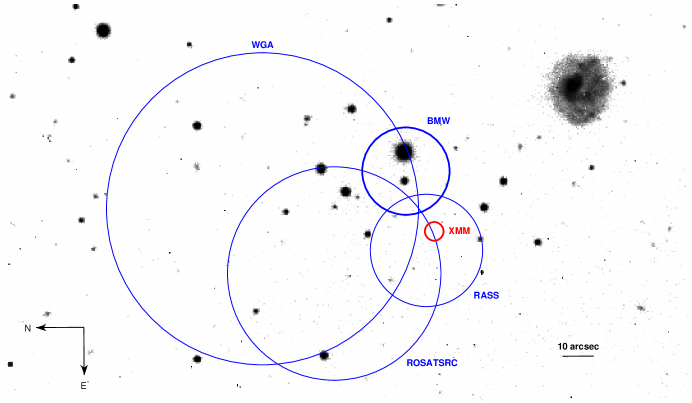
The source is clearly visible in EPIC PN, MOS1 and MOS2 with count rates of , and counts s-1 respectively (0.2-2 keV band). In the EPIC image, the source is slightly off axis since the pointing was requested based on the revised position published by Zampieri et al. (2001). The position obtained with XMM-Newton (J2000 coordinates) is , , with a uncertainty radius of . Within 3, previous estimates based on ROSAT data (see again Zampieri et al. 2001) are consistent with the XMM position. In particular, the position from the ROSAT ASS Bright Sources Catalogue (, , 90% uncertainty radius of ; labelled with RASS in Zampieri et al. 2001) is within from the present XMM position. Figure 1 shows the ROSAT and XMM-Newton error boxes overlayed on the optical image (discussed below). We note the small difference in the position of the RASS error box with respect to that reported by Zampieri et al. (2001).
2.1 Spectral analysis
For the EPIC PN, we extracted single and double events (pattern , FLAG=0) within a circle of 25′′ radius for source and within two circular regions (to avoid out-of-time events) with radius 50′′ for background. For the EPIC MOS1 and 2, we extracted up to quadruple events (pattern , FLAG=0) with a 25′′ and 32′′ radius for the source respectively with two rectangular background regions to exploit the limited window size more effectively. In order to account for the slightly off-axis position, we generated the appropriate off-axis response and ancillary response matrices. Data were grouped, ensuring a minimum of 30 counts per energy bin.
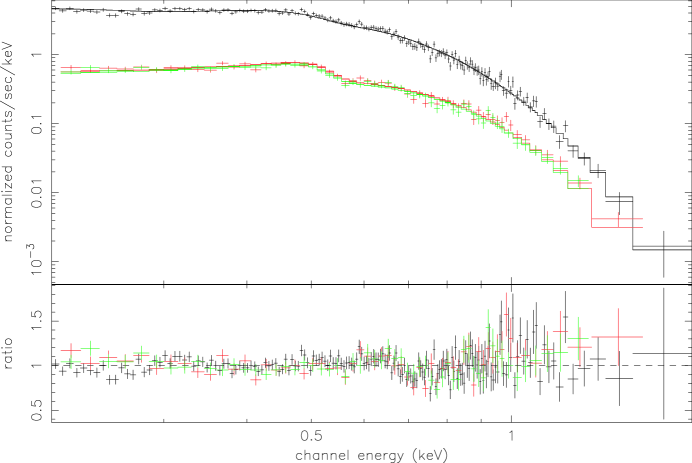
We performed a spectral analysis by fitting data from the three EPIC detectors simultaneously. We find that the broadband spectrum can be represented by a single absorbed blackbody, with keV and cm-2 (see Figure 2, Table 2). Both parameters are consistent with those measured in the past using ROSAT data, although better constrained. The unabsorbed EPIC-PN flux in the keV band is erg cm-2 s-1, slightly less than that reported by Zampieri et al. for ROSAT PSPC ( erg cm-2 s-1 (the difference is likely to be due to the large off-axis angle of RBS 1774 in the ROSAT observation). Assuming a typical luminosity of erg/s gives a distance pc. The value of the column density is similar to, but slightly lower than, the total Galactic absorption in the source direction ( cm-2, Dickey & Lockman 1990). The resulting reduced is not fully satisfactory and an inspection of the residuals suggests that the largest discrepancies between model and data are above keV.
As discussed by many authors (see e.g. Zavlin & Pavlov 2001, Treves et al. 2000 for reviews), realistic model spectra of the cooling atmosphere surrounding an unmagnetized ( G) neutron star exhibit a distinctive hardening with respect to a blackbody and deviate significantly from a Planckian shape. When accounting for a magnetic field of moderate strength ( G), the hard tail present in nonmagnetic models with comparable luminosity is partially suppressed and the X-ray spectrum, although still harder than a blackbody at the neutron star effective temperature, , is more Planckian in shape.
Models of fully ionized, pure H neutron star cooling atmospheres, as computed by Pavlov et al. (1992) and Zavlin et al. (1996), are currently implemented in XSPEC (nsa model) for three different values of the magnetic field: (unmagnetized models) and G. In the attempt to improve the spectral fit we tested all the three sets of models, but in all cases the resulting was worse than that obtained using a simple blackbody model (see Table 3). The star mass and radius have been fixed at and km, but the effects of gravity on the emergent spectra are too small to produce any appreciable difference in the fits.
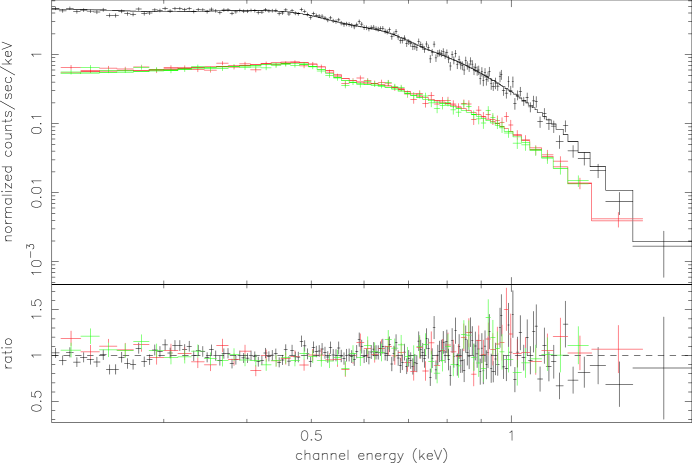
Similarly, no improvement is obtained adding a power-law component or a second blackbody. However, we find that adding a gaussian line in absorption at keV produces a statistically significant (; ) improvement111The F-test has been widely used to test the significance of spectral lines, although this is strictly inappropriate (see Protassov et al. 2002). Only for completeness, we report that we have checked the F-test statistics value and probability, obtaining 12.1 and , respectively., leading to a reduced . The best fitting energy of the line is keV; the line width and depth are keV and , respectively. The latter two parameters are mutually degenerate and not well constrained, because, at least for narrow or moderately narrow lines, the energy resolution is insufficient to strongly distinguish between width and depth. A slightly better (reduced ) but similar fit is obtained by using an absorption edge instead of a gaussian line (see Figure 3): in the edge model there is one parameter less, therefore the depth is well constrained. At this level the data do not have enough resolution to allow us to discriminate between the two kinds of spectral features, in terms of their physical meaning. The best fitting energy of the edge is keV and the optical depth is . In both cases, the blackbody temperature is essentially unchanged with respect to the single blackbody fit. The best fit parameters are reported in Table 2. The flux in the line/edge has been computed by fitting data with the models above, then switching the optical depth to zero and calculating the difference in flux, yielding erg cm-2s-1 (edge) and erg cm-2s-1 (gaussian line).
2.2 Timing analysis
The high throughput of XMM-Newton provides a much more stringent check than the ROSAT PSPC on whether RBS 1774 is pulsating. For the timing analysis, we extracted the counts within a 30′′ radius aperture in both PN and MOS1 and MOS2 but with the aperture truncated by a chord where it approached the edge of the CCD window in each case: this maximised the counts while avoiding any edge effects. A background area was selected using as much as possible of the small window mode image area while avoiding the edge of the window and the out-of-time events. This resulted in event files containing 38485, 9738 and 9500 events available for data analysis for PN, MOS1 and MOS2 respectively.
We analysed PN, MOS1 and MOS2 data both individually and combined using the Maximum Likelihood Periodogram technique described in Zane et al. (2002) and Cropper et al. (2004). We searched periods from 10000 s to 30 ms, ensuring that in each case the period grid was 2.5 times better sampled than the Nyquist frequency. Below 0.3 s the time resolution even in small window mode of MOS prevents them being used, so only the PN data were used for periods shorter than this.
The search revealed a significant period at 9.437 s. This is illustrated for the combined MOS and PN dataset in Figure 4, where the dotted lines show confidence intervals of 68% and 90%. The between the maximum and the noise floor is in the combined dataset, while for the PN alone . The peak is evident in the combined MOS1 and MOS2 data, with . We have checked whether the reduced significance of the MOS1+2 peak is consistent with that in the PN data, given its greater sensitivity, by selecting (at random) event data from the PN event list to generate a reduced dataset with the same number of events as MOS1+2. In this reduced PN dataset the noise levels are similar to the MOS1+2 dataset, and the 9.437 s peak is no longer the most significant in the 9–10 sec period range. This indicates that the lower significance of the peak in the MOS1+2 dataset is consistent with its reduced statistics with respect to the PN dataset and that no additional bias is introduced because of event selection.
corresponds to a result ( for 1 degree of freedom). However, we need to consider the random probability of a peak occurring given the large number of periods searched. In the interval between 1 and 1000 seconds, there are 59638 independent periods, and the probability of a peak will occur once in cases, corresponding to a or result. We therefore consider the peak to be significant, although with the caveat that in Haberl, Pietsch & Motch (1999) a detection was claimed for a 22.69 s periodicity in RX J0420.0-5022, which has since been shown to have a 3.45 s periodicity.
We have consequently folded the data on the 9.437 s period and binned them in phase. This is shown in Figure 5 for PN separately, for the combined MOS data, and then for all three instruments together. The MOS data taken separately are noisy, with a variation which would not be considered significant in its own right, but which nevertheless shows an amplitude and phasing which is consistent with that from the PN. This is evident (equivalently) from our periodogram analysis where the increases from 36 to 40 when the MOS1+2 data are added to the PN data, and adds weight to our conclusion that this pulsation is real.
The pulsation is approximately sinusoidal, and the amplitude of the variation is remarkably small: fitting a sinusoid yields a semiamplitude of (0.072 peak-to-peak). In the attempt to confirm the periodicity, we re-analysed the archival ROSAT data taken in May 1991 (Zampieri et al. 2001). This observation is divided into two segments of duration s each; the interval between the two segments is s. No statistically significant peak is present in the power density spectrum of the two separate segments, due to the poor statistics. No modulation with amplitude has been found in the PSPC data, and this limit is consistent with the XMM-Newton detection.
3 Possible nature of the spectral feature
The quality of the blackbody fit to the phase-averaged EPIC data of RBS 1774 is not completely satisfactory. Adding an absorption edge or a gaussian line in absorption significantly improves the spectral fit, suggesting the presence of an absorption feature similar to those observed in RX J1308.6+2127, RX J0720.4-3125, RX J1605.3+3249, RX J0806.4-4123, RX J0420.0-5022 (Haberl et al. 2003; Haberl et al. 2004b; Van Kerkwjik et al. 2004; Haberl et al. 2004a). However, the absorption features detected in these other sources appear at energies below eV, while in the case of RBS 1774 it is at eV (for the purpose of the discussion we use the energy of the feature obtained by the blackbody plus edge fit, which is slightly better constrained). This makes the detection in RBS 1774 less sensitive to the uncertainties in the EPIC-PN spectral calibration, since residual systematic calibration effects are mainly present below keV. We note that a feature at this energy has been detected in the spectrum of the neutron star 1E 1207.4-5209 (Sanwal et al. 2002; Mereghetti et al. 2002a; Bignami et al. 2004; Hailey & Mori 2002; Mori et al. 2004; Zavlin et al. 2004). The comparison between the properties of the XDINSs and those of 1E 1207.4-5209 must be done carefully, given the fact that the latter is probably younger: it has a shorter period, it is still associated with a supernova remant and it shows an additional harder spectral component in the X-ray spectrum. Also, 1E 1207.4-5209 is unique since it exhibits at least two spectral lines, with harmonic spacing. However, as will be discussed further on, some of the models proposed for this source can be applied to RBS 1774 as well.
Strong atomic absorption features are predicted by low-field atmospheric models with significant metal abundances (either solar, or pure iron, see Rajagopal & Romani 1996; Zavlin et al. 1996). The predictions for strongly magnetized metal-enriched atmospheres are more difficult to assess, due to the lack of detailed calculations. However, the strongly magnetized pure Fe spectra presented by Rajagopal, Romani & Miller (1997) also show a significant number of absorption lines. The main difficulties faced by these models is that they exhibit a variety of rather narrow lines, in contrast with the single feature observed in RBS 1774.
Other possible interpretations are discussed below and can be divided in two groups, requiring either a superstrong ( G) or a moderate ( G) magnetic field.
3.1 Super-strong magnetic fields
A plausible hypothesis is that the feature in the spectrum of RBS 1774 is associated with a proton cyclotron line. An interpretation in terms of a proton resonance has been recently put forward for the lines observed in other XDINSs, and, at least for RX J0720.4-3125, it is supported by the agreement between the magnetic field strength independently inferred from spin-down measurements and line energy (Cropper et al. 2004). In the case of RBS 1774, this would imply an ultra-strong magnetic field of G, assuming a gravitational redshift factor at the star surface of . Such a field strength is comparable (although a factor higher) with that estimated in a similar way for RX J1605.3+3249 and RX J0806.4-4123 ( G, see Van Kerkwjik et al. 2004; Haberl et al. 2004a), and is well above the critical value, G, at which QED effects become important.
An alternative interpretation is that we are detecting an absorption feature due to a bound-bound or bound-free transition in the hydrogen atom. A strong magnetic field can significantly increase the atomic binding energies and radiative transition rates, moving the H ionization edge into the soft X-ray band. First calculations of hydrogen atmospheres with bound atoms have shown that broad spectral lines become prominent if the atmospheric temperature drops below K. The strongest line corresponds to the transition between the ground state and the lowest excited state at an energy of eV (Zavlin & Pavlov 2001). If applied to the keV line detected in RBS 1774, this interpretation yields a magnetic field of G, again in the ultra-magnetized range. More detailed atmospheric models which include partially ionized hydrogen have been computed by Ho et al. (2003), accounting for magnetic field effects and using the latest available equation of state. They have shown that, for G and K, two broad absorption features, due to bound-free transitions to different continuum states, are present at and 4 keV, respectively. The latter is much stronger, but it would not be visible in the spectrum of RBS 1774 which has negligible emission above keV. At somewhat lower fields ( G) Ho & Lai (2004) found that the dominant atomic features in the 0.2–2 keV band are those due to the low-energy bound-free transition, which is barely visible at 0.54 keV, and the bound-bound transition discussed above at 0.74 keV. These authors argue that at super-strong field strengths ( G) vacuum polarization may efficiently suppress these lines, in which case the above conclusions can be (at least partially) invalidated. However, current treatment of this QED effect is too crude to make a definite statement.
At present, accurate atmospheric models for chemical compositions other than hydrogen are unavailable for G. In the case of 1E 1207.4-5209, attempts to interpret the keV feature as a transition in ions other than H have been made, simply based on the latest theoretical results on the characteristics of bound-bound and bound-free transitions in He-like and H-like ions in strong fields. In this case, a keV feature may be associated with a transition between the ground level (, where and are the magnetic and longitudinal quantum numbers) and the lowest excited tightly-bound level of . The required magnetic field is G, for (Sanwal et al. 2002; Zavlin et al. 2004). Taken overall, these results show that if RBS 1774 has a magnetar-like field, G, the feature at keV may be due to a proton cyclotron resonance, or bound-bound transitions in H or H-like He, or a blend of these.
3.2 Moderate magnetic fields
An obvious scenario involving a moderate magnetic field is that in which the observed feature is associated with electron (instead of proton) cyclotron resonance. Would this be the case, the surface magnetic field is necessarily much lower, for .
A further possibility is that of an atomic transition out of the ground state to the excited state or to the continuum in a mid- H-like ion, such as C VI, N VII or O VIII. Such an interpretation has been put forward by Hailey & Mori (2002) again in connection with the lines in 1E 1207.4-5209 and yields G (we refer in particular to their solutions B; see also their discussion about the possibility of having elements other than H in the neutron star atmosphere). Both these models are conceivable, although the required field strength is well below that estimated for RX J0720.4-3125 and well below the average fields measured in ordinary radio pulsars (only of the pulsar population has G).
4 Comparison with other thermally emitting Neutron Stars and open issues
In this paper we have reported on the results of a recent XMM-Newton observation of RBS 1774. Spectral and timing analysis of the high-quality PN and MOS data confirm the association of this source with an isolated neutron star (as originally reported by Zampieri et al. 2001). The spectrum is thermal and there is evidence at a significance level that the source is an X-ray pulsar, with spin period of 9.437 s. The EPIC-PN X-ray light curve is single peaked and approximately sinusoidal, in agreement with what is seen in most of the other XDINSs (see Cropper et al. 2001; Haberl et al. 2004a; RX J1308.6+2127 is the only XDINSs with double peaked X-ray pulse). However, both the relatively low level of significance of the periodicity and the small amplitude variation in the folded data prevented us from performing pulsed phase spectroscopy.
The deepest available optical pointing of the field is that obtained with the New Technology Telescope (NTT) at la Silla on 2001 May 27. The faintest source in this image is object D, as listed in Table 2 by Zampieri et al. (2001), with . This, combined with the unabsorbed XMM-Newton X-ray flux ( erg cm-2s-1 in the 0.2-2 keV band for cm-2) allows a lower limit to be placed on the X-to-optical flux ratio of . When using the absorbed flux erg cm-2s-1 and the same X-ray energy band, we get .
Taken overall, the characteristics of RBS 1774 are remarkably similar to those of an other XDINS recently studied in detail, RX J0806.4-4123 (see Haberl et al. 2004a). Both sources have a similar EPIC-PN count rate of counts s-1 and a similar period ( s).222RX J1308.6+2127 also has a similar count rate, but a much higher pulsed fraction. Also, they have a blackbody temperature of eV, among the highest observed from the XDINs, and exhibit the smallest pulsed fractions of the group (semiamplitude of and respectively) which makes the detection of significant spectral variations with phase difficult. Intriguingly, and if related, the two latter characteristics may be suggestive of a nearly pole-on viewing geometry, with the spin and magnetic axes fairly closely aligned. This appears also broadly consistent with the fact that the energy of the spectral feature is the highest in RBS 1774, RX J0806.4-4123 and RX J1605.3+3249. If the feature energy is sensitive to the field strength, then, both the temperature and the average magnetic field are higher in the polar regions.
As discussed in § 3, many of the viable interpretations for the feature detected at keV require a magnetar-like field strength, G. For a period of s, this implies a dipole spin-down rate (at present) of s/s, and a spin-down age of yrs (assuming constant). In order to investigate if such a high magnetic field strength is compatible with the cooling age of the source, we considered the evolutionary tracks in the - diagram by repeating the simple computation discussed in Cropper et al. (2004). We computed the source age, , and the value of the magnetic field at the birth of the neutron star, , obtaining G and yrs for Hall cascade; G and yrs for ambipolar diffusion in the solenoidal or irrotational mode, respectively. The situation is therefore very similar to that of RX J0720.4-3125 (Cropper et al. 2004): ambipolar diffusion predicts a magnetic field which is relatively constant over the source lifetime, while Hall cascade gives a scenario compatible with a superstrong field at the star’s birth ( G). The corresponding star’s ages are compatible with the cooling age of a neutron star with mass M⊙ or slightly larger, M⊙ (see Fig. 2 in Yakovlev et al. 2004).
Should the strength of the magnetic field be confirmed by future observations, this will make RBS 1774 the XDINS with the highest field discovered so far. RX J1605.3+3249 and RX J0806.4-4123 may possess magnetic fields of comparable strength ( G Van Kerkwjik et al. 2004; Haberl et al. 2004a), and this raises the question of whether or not a highly magnetized neutron star may remain for long periods without any sign of some kind of transient activity. Very recently, a few radio pulsars with and long period ( few seconds) have been discovered (see e.g. McLaughlin et al. 2003; Morris et al. 2002; Camilo et al. 2000). On the other hand, non-thermal magnetospheric emission from XDINSs is so far undetected, although this may simply reflect the fact that it falls below the detection threshold of present instruments. In fact, if XDINSs are similar to the standard radio-pulsars the relation between rotational energy and non-thermal X-ray luminosity would be . Taking the above value for the magnetic field gives erg/s, for RBS 1774, implying erg/s.
XDINSs were unanimously believed to be steady sources, as indicated by several years of observations for the brightest of them. Only recently, and quite surprisingly, XMM-Newton observations revealed a substantial change in the spectral shape and pulse profile of RX J0720.4-3125 over a timescale of yr (de Vries et al. 2004; Vink et al. 2004). Possible variations in the pulse profile of RX J0420.0-5022 over a similar timescale ( yr) have also been reported (Haberl et al., 2004a), although at a much lower significance level. Even more recently, timing analysis of Chandra and XMM-Newton data of 1E 1207.4-5209 revealed non-monotonic variations in the spin period, possibly related to glitches occurring on a timescale of 1-2 yr (Zavlin et al. 2004). Also the monitoring of anomalous X-ray pulsars (AXPs), previously believed to be steady emitters, has now revealed X-ray variability: both short energetic bursts and long-lasting variations in the X-ray emission of some of these sources have been reported (see Gavriil, Kaspi & Woods 2003, Woods et al. 2004, and Mereghetti et al. 2004 for the cases of 1E 2259+58 and 1E 1048-59). Quite interestingly, the long-term changes observed in RX J0720.4-3125 bear some resemblance to those reported in 1E 2259+58 and 1E 1048-59, with the difference that in RX J0720.4-3125 the spectral and lightcurve evolution is not accompanied by any flux variation.333And again, we caveat that given the several spectral and timing differences, a direct comparison between XDINSs and AXPs or sources like 1E 1207.4-5209 must be done with caution.
Further timing studies of XDINSs will be of key importance in securing new spin-down measurements: this will provide a second independent measurement of the field strength and also will bring further insights on the long-term behavior of XDINSs. Should the presence of ultra-strong fields and the variability be confirmed, the putative relation between XDINSs and AXPs, put forward on the basis of the similarity in spin periods (see e.g. Mereghetti et al. 2002b, Haberl 2004), becomes much firmer. In turn, this relation may provide the “missing link” among XDINSs and SGRs. If indeed XDINSs are the descendants of SGRs/AXPs, as their lower temperature may suggest, then explaining why evolution produces “quiet” magnetars is still a challenge.
References
- Bignami et al. (2004) Bignami, G.F., Caraveo, P.A., De Luca, A., & Mereghetti, S., 2004, Nature, 423, 725
- Burwitz et al. (2003) Burwitz, V., et al. 2003, A&A, 399, 1109
- Camilo et al. (2000) Camilo, F., et al., 2000, ApJ, 541, 367
- Cropper et al. (2001) Cropper, M., et al. 2001, A&A, 365, L302
- Cropper et al. (2004) Cropper, M., et al. 2004, MNRAS, 351, 1099
- de Vries et al. (2004) de Vries, C.P. et al. 2004, A&A, 415, L31
- Drake et al. (2002) Drake, J.J., et al. 2002, ApJ, 572, 996
- Dickey & Lockman (1990) Dickey, J., & Lockman, F., 1990, ARA&A, 28, 215
- Gavriil, Kaspi & Woods (2003) Gavriil, F., Kaspi, V.M., & Woods, P. 2003, Nature, 419, 142
- Haberl, Pietsch & Motch (1999) Haberl, F., Pietsch, W., & Motch, C., 1999, A&A, 351, L53
- Haberl et al. (2003) Haberl, F., et al. 2003, A&A, 403, L19
- Haberl (2004) Haberl, F. 2004, Adv. Sp. Research 33, 638
- Haberl et al. (2004a) Haberl, F., et al. 2004a, A&A, 424, 635
- Haberl et al. (2004b) Haberl, F., Zavlin, V.E., Trümper, J., Burwitz, V., 2004b, A&A, 419, 1077
- Hailey & Mori (2002) Hailey, C.J., & Mori, K., 2002, ApJ, 573, L133 to ApJ, astro-ph/0407369
- Ho et al. (2003) Ho, W.C.G., et al., 2003, ApJ, 599, 1293
- Ho & Lai (2004) Ho, W.C.G., & Lai, 2004, ApJ, 607, 420
- Kaplan, van Kerkwijk & Anderson (2002) Kaplan, D.L., van Kerkwijk, M.H. & Anderson, J. 2002, ApJ, 571, 447
- Kaplan et al. (2002) Kaplan, D.L. et al. 2002, ApJ, 570, L79
- Lazzati et al. (1999) Lazzati, D. et al. 1999, ApJ, 524, 414
- McLaughlin et al. (2003) McLaughlin, M. A, et al., 2003, ApJ, 591, L135
- Mereghetti et al. (2002a) Mereghetti, S., et al., 2002, ApJ, 581, 1280
- Mereghetti et al. (2002b) Mereghetti, S., et al., 2002, in Proceedings of the 270. WE-Heraeus Seminar on Neutron Stars, Pulsars, and Supernova Remnants. MPE Report 278. Edited by W. Becker, H. Lesch, and J. Tr mper. Garching bei M nchen: Max-Plank-Institut f r extraterrestrische Physik, 2002, p.29
- Mereghetti et al. (2004) Mereghetti, S. et al., 2004, ApJ, 608, 472
- Mori et al. (2004) Mori, K., Chonko, J.C., & Hailey, C.J., 2004, submitted
- Morris et al. (2002) Morris, D.J., et al. 2002, MNRAS, 335, 275
- Motch, Zavlin & Haberl (2003) Motch, C., Zavlin, V.E. & Haberl, F. 2003, A&A, 408, 323
- Motch et al. (2005) Motch, C. et al. 2005, A&A, 429, 257
- Pavlov et al. (1992) Pavlov, G.G, et al. 1992, MNRAS, 253, 193
- Protassov et al. (2002) Protassov, R., et al., 2002, ApJ, 571, 545
- Rajagopal & Romani (1996) Rajagopal, M., & Romani, R.W., 1996, ApJ, 461, 327
- Rajagopal, Romani & Miller (1997) Rajagopal, M., Romani, R.W., & Miller, M.C., 1997, ApJ, 479, 347
- Sanwal et al. (2002) Sanwal, D., Pavlov, G.G., Zavlin, V.E., & Teter, M.A., 2002, ApJ, 574, L61
- Treves et al. (2000) Treves, A., Turolla, R., Zane, S., & Colpi, M. 2000, PASP, 112, 297
- Van Kerkwjik et al. (2004) Van Kerkwjik, M.H. et al. 2004, ApJ, 608, 432
- Vink et al. (2004) Vink, J. et al. 2004, ApJ, 609, L75
- Voges et al. (1996) Voges, W., et al., 1996, IAU Circ., 6420
- White et al. (1994) White, N.E., Giommi, P., & Angelini, L., 1994, IAU Circ., 6100 http://wgacat.gsfc.nasa.gov
- Woods et al. (2004) Woods, P. et al. 2004, ApJ, 605, 378
- Yakovlev et al. (2004) Yakovlev, D.G. et al. 2004, Proceedings of the 34th COSPAR Scientific Assembly, Adv.Space Res., 33, 523-530
- Zampieri et al. (2001) Zampieri, L., et al. 2001, A&A, 378, L5
- Zane et al. (2002) Zane, S., et al. 2002, MNRAS, 334, 345
- Zavlin et al. (1996) Zavlin, V.E., Pavlov, G.G., & Shibanov, Yu.A., 1996, A&A 315, 141,
- Zavlin & Pavlov (2001) Zavlin, V.E, & Pavlov, 2001, Proceedings of the 270. WE-Heraeus Seminar on ”Neutron Stars, Pulsars and Supernova Remnants”. MPE Report 278. Edited by Becker, W., Lesch, H., and Trümper, J.. Garching bei München: Max-Plank-Institut für extraterrestrische Physik, 2002, pag. 263-272
- Zavlin et al. (2004) Zavlin, V.E, Pavlov, G.G., & Sanwal, D., 2004, ApJ, 606, 444
- Zimmermann (1994) Zimmermann, H.-U. 1994, IAU Circ., 6102
| Source | Semi-Ampl.aaSemi amplitude of the folded light curve. | Ref.bb1) Burwitz et al. (2003); 2) Haberl et al. (2004b); 3) Van Kerkwjik et al. (2004); 4) Haberl et al. (2003); 5) Haberl et al. (2004a); 6) this paper. | ||||
|---|---|---|---|---|---|---|
| eV | cm-2 | eV | s | |||
| RX J1856-3754 | 56.7 | 0.18 | no | no | no | 1 |
| RX J0720-3125 | 85.2 | 270 | 8.39 | 11% | 2 | |
| RX J1605.3+3249 | 94.1 | 0.68 | 493 | no | no | 3 |
| RX J1308.6+2127 | 85.8 | 4.10 | 290 | 10.31 | 18% | 4 |
| RX J0420-5022 | 44.9 | 1.02 | 329 | 3.45 | 13% | 5 |
| RX J0806-4123 | 95.6 | 0.41 | 460 | 11.37 | 6% | 5 |
| RBS 1774 | 101.4 | 3.65 | 700 | 9.44 | 4% | 6 |
| Model | ; | bbUnabsorbed flux measured with EPIC-PN in the keV band. | /d.o.f. | ||||
|---|---|---|---|---|---|---|---|
| cm-2 | eV | eV | eV | erg cm-2 s-1 | |||
| bb | 1.36 | ||||||
| bb+abs. edge | 1.17 | ||||||
| bb+ gauss. line | 1.20 |
| /d.o.f. | |||
|---|---|---|---|
| G | cm-2 | eV | |
| 0 | 1.94 | ||
| 1 | 1.99 | ||
| 10 | 2.19 |