VLBA Imaging Polarimetry of Active Galactic Nuclei – An Automated Approach
Abstract
We present full polarization Very Long Baseline Array (VLBA) observations at 5 GHz and 15 GHz of 24 compact active galactic nuclei (AGN). These sources were observed as part of a pilot project to demonstrate the feasibility of conducting a large VLBI survey to further our understanding of the physical properties and temporal evolution of AGN jets. The sample is drawn from the Cosmic Lens All-Sky Survey (CLASS) where it overlaps with the Sloan Digital Sky Survey at declinations north of 15∘. There are 2100 CLASS sources brighter than 50 mJy at 8.4 GHz, of which we have chosen 24 for this pilot study. All 24 sources were detected and imaged at 5 GHz with a typical dynamic range of 500:1, and 21 of 24 sources were detected and imaged at 15 GHz. Linear polarization was detected in 8 sources at both 5 and 15 GHz, allowing for the creation of Faraday rotation measure (RM) images. The core RMs for the sample were found to have an average absolute value of 390 100 rad m-2. We also present the discovery of a new Compact Symmetric Object, J08553+5751. All data were processed automatically using pipelines created or adapted for the survey.
1 Introduction
Among astronomical observations, Very Long Baseline Interferometry (VLBI) imaging is unique in providing details about parsec-scale structures in cosmologically distant objects. The Pearson-Readhead (PR; Pearson & Readhead 1988) survey revealed a wide range in morphologies and paved the way towards motion and variability studies. Subsequent VLBI surveys such as the Caltech–Jodrell Bank Flat spectrum survey (CJF; Taylor et al. 1996), have imaged 300 sources at 5 GHz, of which more than half (177) were observed in full polarization (Pollack et al., 2003). The VLBA Calibrator Survey (VCS; Beasley et al. 2002) included 2000 sources, but at the expense of limited sensitivity and () coverage since the driving goals were an astrometric grid of phase-referencing calibrators, and not high-quality imaging.
A new survey of 1000 sources with full polarization at 5 and 15 GHz would provide an unparalleled combination of size, depth, and polarization information. The large sample of high-quality data sets, especially when combined with surveys at other wavelengths, would provide an excellent resource for studying the physics, environments, and evolution of active glactic nuclei (AGN). The key areas of study for a large survey are:
Gamma-ray AGNs: This new Very Long Baseline Array (VLBA) survey, combined with the survey data from the Gamma-Ray Large Area Space Telescope (GLAST) mission (Gehrels & Michelson, 1999), should revolutionize our understanding of AGN jet physics. After launch in 2007, GLAST will perform an all-sky survey 30 times more sensitive than that of EGRET. The number of AGN expected to be detected is 3000–4500, although variability, especially in the gamma-ray properties, may strongly influence these estimates (Vercellone et al., 2004). Correlations with milliarcsecond polarimetry are key to identifying and understanding the gamma-ray sources. Extrapolating from the correlation between 5 GHz radio luminosity and peak gamma-ray emission (Mattox et al., 1997), we expect that most of these objects will be compact, flat-spectrum sources with 5 GHz flux densities over 30 mJy. EGRET results and theoretical studies indicate that gamma-ray emission emanates from jet outflows (e.g., Dermer & Schlickeiser 1994), where high-energy non-thermal electrons accelerated in shocks are thought to Compton-upscatter soft photons. Milliarcsecond radio imaging can reveal the detailed morphological structure of the core and outflow regions. With a large number of sources, correlations between radio morphology and gamma-ray spectral properties will be determined with high significance, thus providing constraints on models for baryonic acceleration and the microphysics of electron-proton coupling. In addition, the improved error box of GLAST (arcminutes) combined with the VLBA imaging may solve the mystery of the unidentified high-latitude EGRET sources.
Jet Magnetic Fields: Recently, Pollack et al. (2003) have found a tendency for the parsec-scale cores of quasars to have a magnetic field aligned in the direction of the jet, which can constrain jet-launching/collimation models (e.g., Meier, Koide, & Uchida 2001). Similar observations of BL Lacs have suggested that their magnetic fields are oriented perpendicular to the jets (e.g., Gabuzda et al. 2000). Unfortunately, the number of BL Lacs and galaxies with good polarization data are too small for a meaningful comparison between different classes of objects. The 1000-source survey will address this problem by providing 100 objects in each class.
AGN Environments: The survey data will be used to study propagation effects local to the jet, including free-free absorption in sources with counterjets and Faraday rotation measures (RMs) towards all sources with detected polarization. Typical quasars have RMs which are surprisingly large (1000 rad m-2; Taylor 1998) and time-variable (Zavala & Taylor 2001). Knowing the RM is also critical in order to make sense of the jet properties as otherwise the RM will tend to “smear-out” intrinsic relationships.
AGN Evolution: Compact Symmetric Objects (CSOs), by virtue of their small sizes (1 kpc), are thought to be examples of young ( yr) radio sources that may evolve to become eventually the well-known FRII-type radio sources (Readhead et al. 1996). Only small numbers of CSOs are known (40; Peck & Taylor 2000), limiting our ability to study radio sources at early times in their evolutionary history. A large VLBA survey would approximately double the number of confirmed CSOs.
Here we present the results from a feasibility study for a possible VLBI Imaging and Polarimetry Survey (VIPS). While not a complete sample in itself, this pilot study of 24 AGN was chosen to be a representative selection of strong and weak sources and presents a wealth of data on this modest sample. This includes one new Compact Symmetric Object (J08553+5751) and the first Faraday rotation measure observations of a sample of faint sources. We have also developed and made available new pipelines for calibration and imaging that allow rapid reduction of the VLBA data to finished products. Throughout this discussion, we assume H0=70 km s-1 Mpc-1, = 0.27, and = 0.73.
2 Sample Definition
To facilitate multi-wavelength science, all targets lie within the sr region of the North Galactic Cap and the equatorial strips to be covered by the Sloan Digital Sky Survey (SDSS; Abazajian et al. 2004, 2005). Thus multi-color imaging (UV to near-IR) will be available for almost all targets, and spectroscopic information will be present for the optically bright targets (perhaps 33%). For optically faint sources, photometric redshifts may be estimated from the imaging data (Weinstein et al., 2004). In this region there are 2100 flat-spectrum, compact (size 200 mas), and relatively bright ( mJy) sources above 15∘ declination in Cosmic Lens All-Sky Survey (CLASS) (Myers et al., 2003), a VLA survey of 12,000 flat-spectrum radio sources at 200 mas resolution. From this number we have selected a sample of 1000 sources never before imaged at high dynanmic range with VLBI. The declination limit of 15∘ is necessary to insure uniformly good radio imaging quality. The lower limit of 50 mJy has been chosen in order to have sufficient SNR (1.5 estimated at 15 GHz) on all compact sources with a spectral index to permit self-calibration within the coherence time at both 5 and 15 GHz, where the spectral index, , is defined as . Heavily resolved sources (sizes 20 mas) may still be undetectable, especially at 15 GHz where 25 mJy is needed on scales 20 mas for self-calibration. We note that there is an implicit avoidance of the galactic plane in our selection since CLASS was selected to have . CLASS also had a spectral selection of from the parent Green Bank Survey (GB6 – Gregory et al. 1996) at 4.85 GHz and the NRAO VLA Sky Survey (NVSS – Condon et al. 1998) at 1.4 GHz. A similar spectral selection was employed for the CJF survey to obtain a high success rate with VLBI imaging.
We note that there should be 1000 GLAST sources found in the area covered by VIPS. Since this is comparable to the number of VIPS sample members in the same region, and compact flat-spectrum radio emission is believed to be a strong predictor of gamma-ray emission (Mattox et al., 2001; Sowards-Emmerd et al., 2003), a milliarcsecond radio imaging survey of the VIPS sample may be important for the scientific interpretation of the GLAST all-sky survey (as discussed in §1).
Here we present observations of 24 sources (see Table 1) selected within the first and second data release areas of SDSS, and to be representative of the VLBA VIPS sample as a whole. The integrated flux densities of the 8.4 GHz VLA parent sample range from 52 mJy for J08585+5552 to 850 mJy for J08546+5757 (JVAS 0850+581). A total of 8, 7, 5 and 4 sources were selected from the ranges 50–100, 100–200, 200–400, and 400 mJy.
3 Observations and Analysis
The observations were carried out at 5 and 15 GHz on 14 March 2004, 15 March 2004, 28 June 2004, and 18 August 2004, using the VLBA of the NRAO111The National Radio Astronomy Observatory is a facility of the National Science Foundation operated under cooperative agreement by Associated Universities, Inc.. Each observing session lasted for 12 hours. The 5 and 15 GHz frequency bands were interleaved in time, with 24 minutes scheduled on each target source at 5 GHz and 72 minutes on source at 15 GHz. Allowing for telescope slews and other overhead (6 minutes on average) the time needed for each source was 1.7 hours. In order to improve (,) coverage and to allow for rotation measure determinations, we spread the frequencies out over the 500 MHz instantaneous tuning range of the VLBA as follows: 5 GHz refers to 4607, 4677, 4992 and 5097 MHz at band center, while 15 GHz refers to 14904, 14970, 15267, and 15366 MHz at band center. Each frequency was observed with 4 MHz bandwidth in each of right circular and left circular polarization. The only significant loss of data were the loss of 98 minutes due to a false fire alarm at the Hancock, NH VLBA station on 18 August. Rain at some sites increased system temperatures and reduced sensitivity, especially at 15 GHz, in all four runs.
Amplitude calibration was derived using measurements of the system temperatures and antenna gains at 4992 and 15366 MHz, which are close to the continuum default frequencies of 4999 and 15369 MHz. Fringe-fitting was performed with the AIPS task FRING on the strong calibrator 3C 279. Feed polarizations of the antennas were determined at 5 and 15 GHz using the AIPS task LPCAL and the unpolarized source OQ208. An initial phase self-calibration was performed for each source using a point source model – no phase referencing to nearby calibrators was used, as this would significantly reduce the observing efficiency and is unnecessary for such strong sources.
Absolute electric vector position angle (EVPA) calibration was determined by using the EVPA’s of 3C 279, J0854+2006, and J1310+3220 as listed in the VLA Monitoring Program222http://www.vla.nrao.edu/astro/calib/polar/ (Taylor & Myers, 2000). Agreement in the EVPA correction determined from these calibrators was generally better than 3 degrees for observations within a few days. All observations of EVPAs for the target sources have been corrected for Faraday rotation as determined from the observations.
For each source, the 15 GHz data were tapered to produce an image at comparable resolution to the full resolution 5 GHz image. For simplicity all sources were restored with a fixed beam size of 3.2 1.6 mas in position angle 0∘ at each frequency. The two images were then combined to generate a spectral index map. It is important to note that spectral index maps made from two datasets with substantially different () coverages may suffer from significant systematic errors, especially in regions of extended emission. Polarization images were likewise made at matching resolutions in order to make rotation measure (RM) images. All calibration and imaging was done semi-automatically using pipelines written in AIPS (Greisen, 2003) and Difmap (Shepherd, 1997). These pipelines can be found at the VIPS web page333http://www.aoc.nrao.edu/gtaylor/VIPS/.
For 23 out of 24 sources the automatic imaging scripts were able to produce an image with the expected noise and a good fit () between the source model and the data. The parameter is the square root of the squared difference between the data and the model divided by the individual variances implied by the visibility weights. This is close to the square root of the reduced , except that a small change in the number of degrees of freedom due to amplitude self-calibration has not been taken into account. This simplification is generally benign and will only result in a 10% reduction of for sources strong enough to amplitude self-calibrate (peak flux density brighter than 0.3 Jy at 5 GHz or 0.5 Jy at 15 GHz). The value of indicates the agreement obtained between the model and data in the self-calibration process with values near unity indicating good agreement. In one case a poor fit () was found to be due to bad data during 5 minutes from the Los Alamos, NM station. It is worth noting that in our inital automatic imaging script we used a field size of 64 64 milliarcseconds, and this resulted in poor fits for two sources with emission beyond the edge of the field. Judicial manual editing was done to solve the first problem and imaging all sources with an initial field size of 128 128 milliarcsec then provided good fits for all 24 sources. The final images have rms noise values within 30% of the predicted thermal noise.
The observing efficiency of 1.7 hours/source could be improved to 1.5 hours/source without loss of sensitivity if the observing runs were extended to 24 hours. This could be done since the number of calibrator scans is the same for a 24 hour run as it is for a 12 hour run. The fraction of time spent on calibrators for each of the 12 hour observing runs in the pilot project was 15%.
4 Results
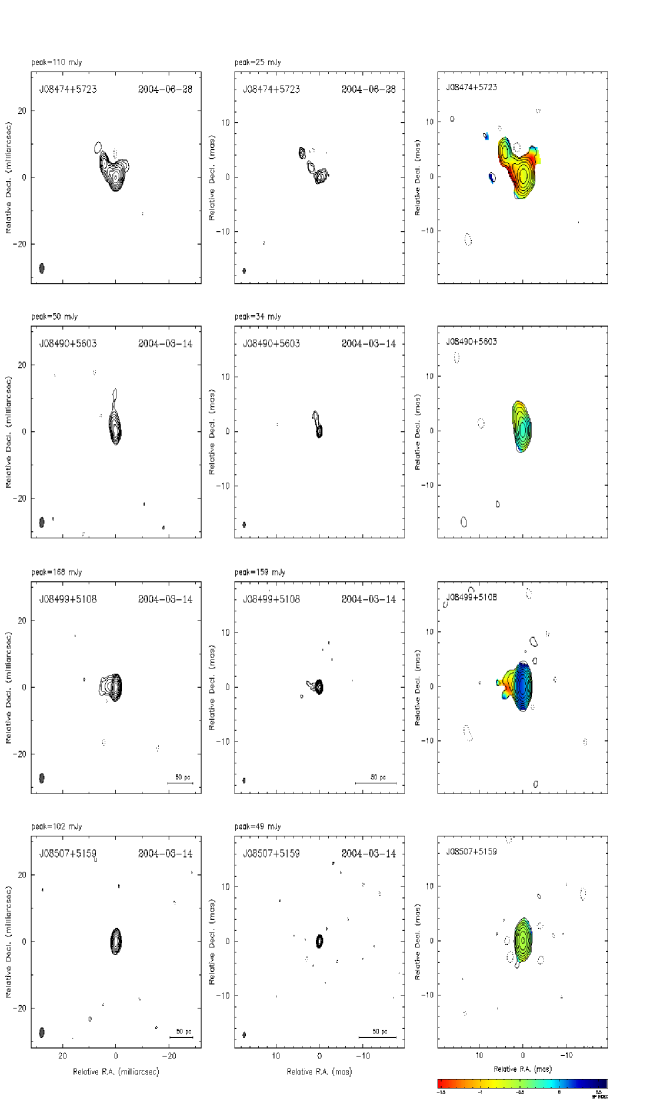
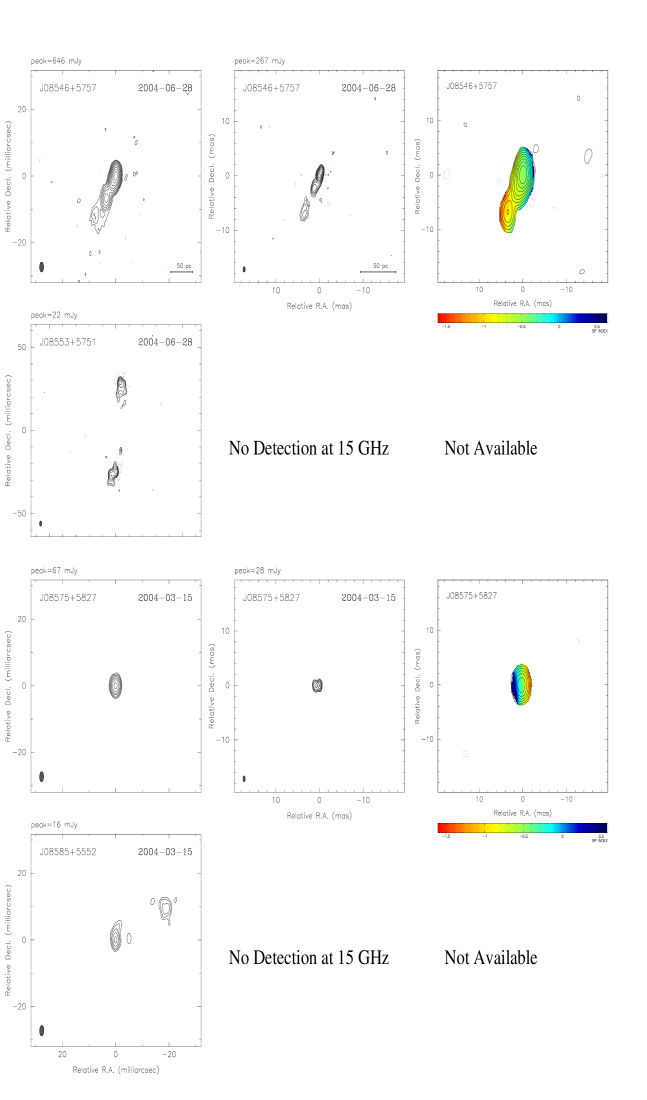
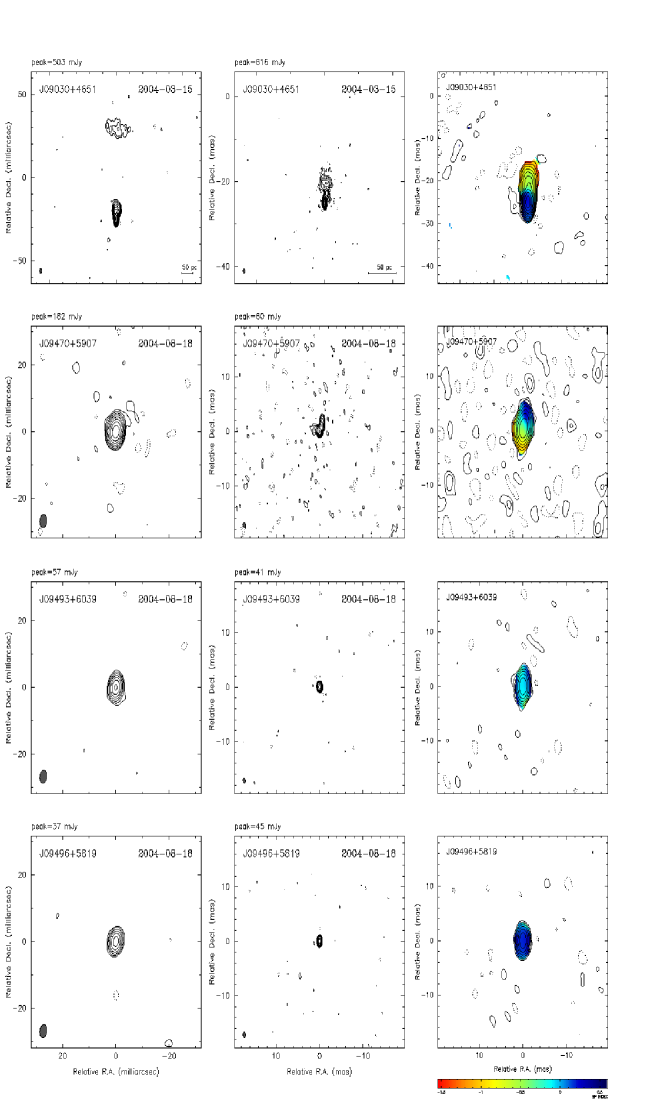
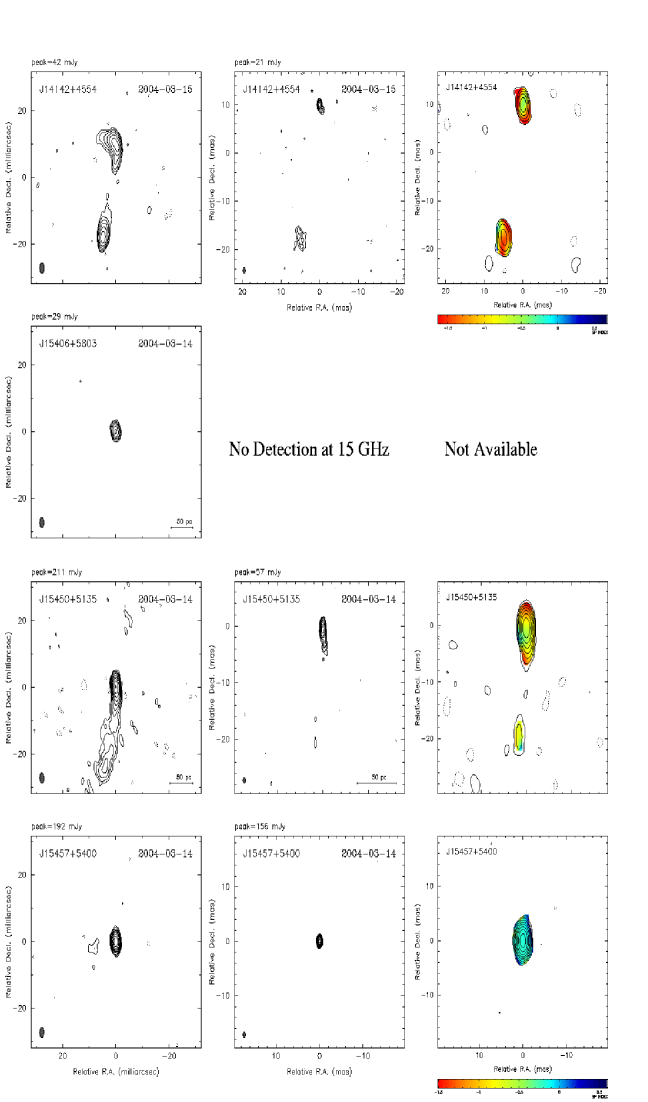
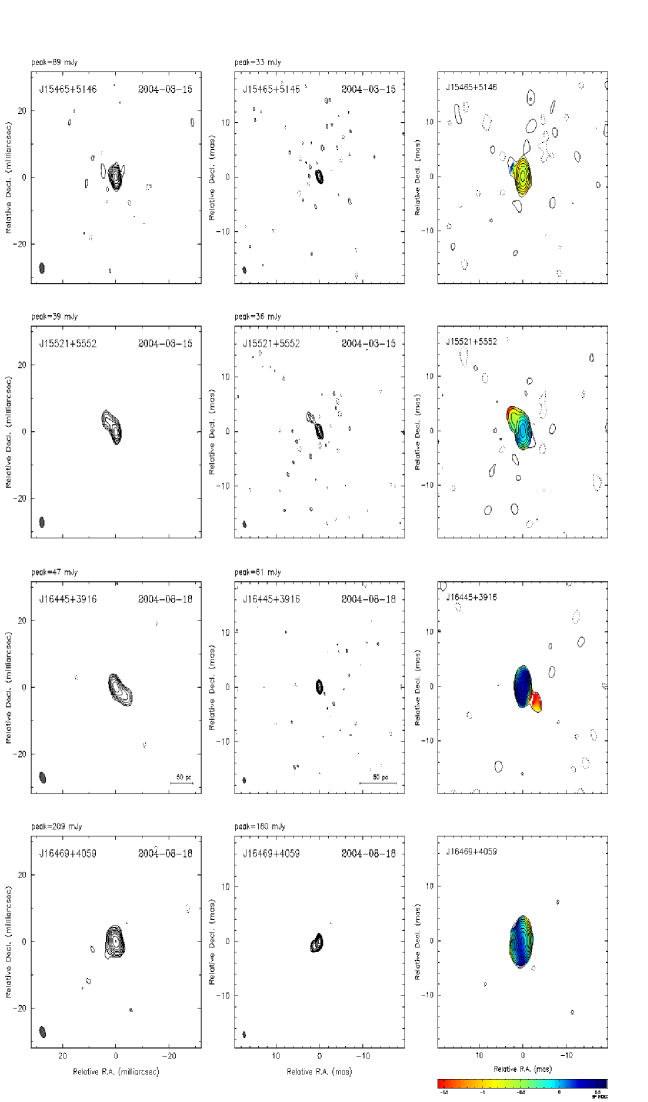
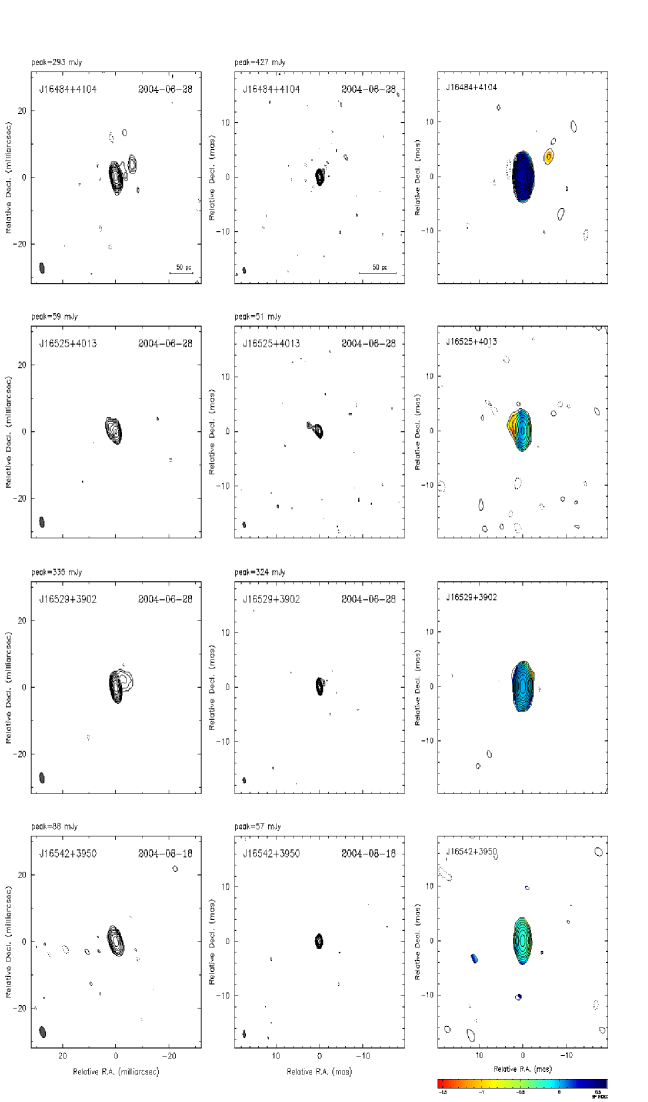
Figure 1 displays total intensity images for all sources in the pilot project at 5 and 15 GHz. Contours are drawn starting at 0.8 mJy beam-1. Further details can be found in Tables 2 and 3. All 24 sources were detected and imaged at 5 GHz. At 15 GHz there was no detection for J08553+5751 = JVAS 0851+580 (see §4.2.1), J08585+5552, or J15406+5803. Since no observations were carried out with phase-referencing, sources with a flux density less than 25 mJy at 15 GHz were too weak to self-calibrate. The lack of detections is due to a combination of moderately steep spectrum sources and the lower sensitivity at 15 GHz within the coherence time used for self-calibration of the phases. The sensitivity limit for detection was a flux density of 10 mJy at 5 GHz and 25 mJy at 15 GHz.
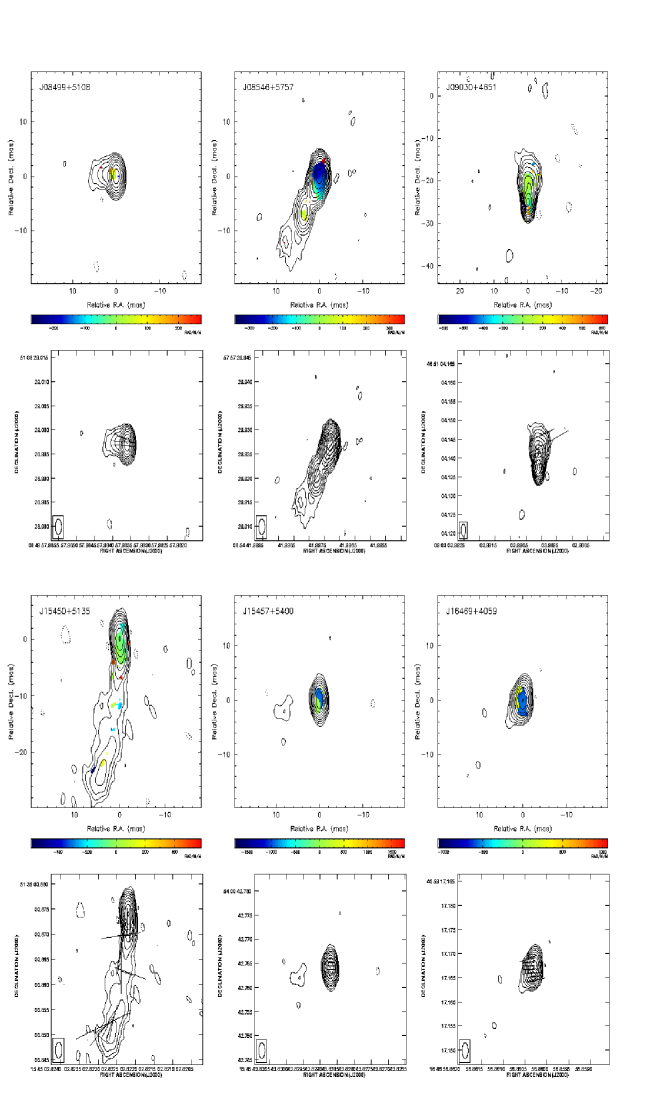
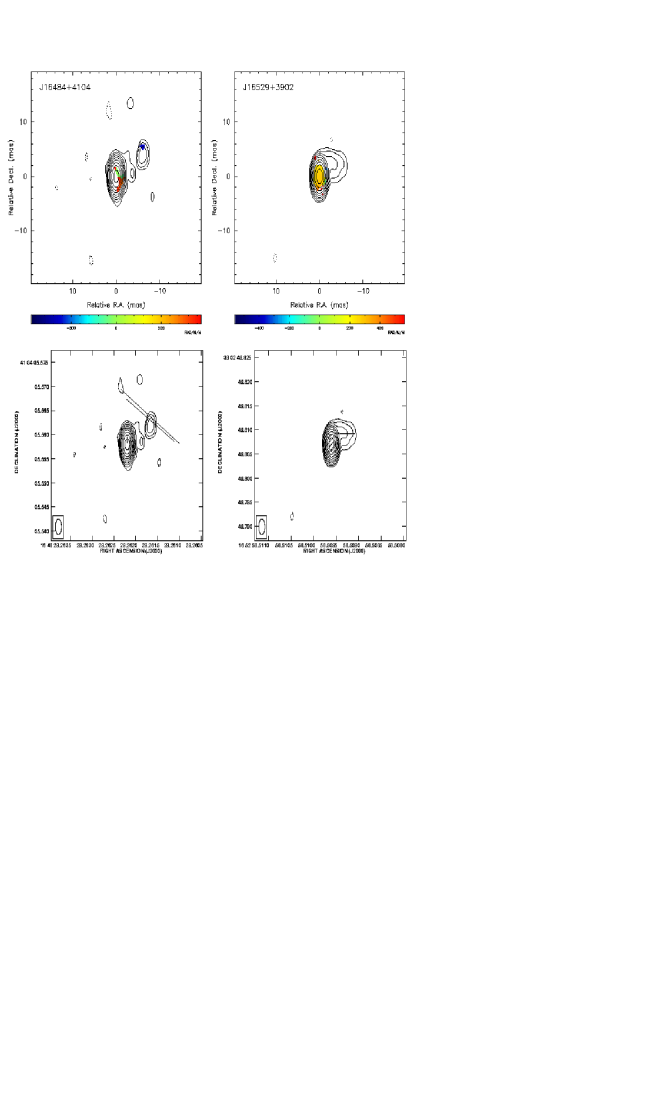
Linear polarization was detected in 8 of 24 sources at both 5 and 15 GHz, and at 15 GHz only in the source J16542+3950. In order to increase the SNR in the polarization images the observations at 4607 and 4677 MHz were combined, as were those at 4992 and 5007 MHz, 14904 and 14970 MHz, and 15267 and 15366 MHz. These 4 pairs were subsequently combined to generate images of the rotation measure by calculating the change in polarization angle with wavelength squared on a pixel by pixel basis. The results are shown in Fig. 2, along with the magnetic field polarization vectors corrected for Faraday rotation. Under the assumption that the radiation is optically thin synchrotron emission in a homogeneous field, the vectors shown indicate the projected source magentic field orientation.
4.1 SDSS Magnitudes and Redshifts
We have searched for optical counterparts for the sources in the SDSS Data Release 3 (Abazajian et al., 2005), with a counterpart defined as a catalog member falling within 1″ of the radio position. There are optical matches for 22 of the 24 VIPS sources. The detected sources have -band magnitudes between 17.5 and 22.1 (Table 1). The SDSS pipeline produces a morphological classification of “STAR” for all but three of the counterparts. These sources are almost certainly quasars, and we have designated them as “Q” in Table 1. Furthermore, SDSS redshifts are available for eight of the sources, all of which have “STAR” morphological classifications. The spectra for these sources are all typical quasar spectra, with broad emission lines of, e.g., CIV, CIII, MgII, or H. The redshifts range between and .
4.2 Notes on Individual Sources
4.2.1 J08553+5751
The morphology of this source revealed by our 5 GHz image (Fig. 1) resembles that of a Compact Symmetric Object (CSO). The identification of 0851+580 with a galaxy, and the lack of linear polarization, is also consistent with a CSO classification, as is the lack of a detection at 15 GHz.
4.2.2 J14142+4554
This known CSO (JVAS 1412+461) (Peck & Taylor, 2000) was included in the sample as a check on the ability of the survey to identify CSOs. In this regard the clear detection of two steep spectrum lobes is quite satisfactory. This source has been associated with a galaxy of magnitude 19.9 and a redshift of 0.190 by Falco, Kochanek, & Muñoz (1998). It has a bent northern lobe and an edge-brightened southern lobe. Gugliucci et al. (2005) find no detectable motions of the lobes with an upper limit of 0.014 mas yr-1, or 0.14 c. This gives a lower limit on the age of the radio source of 2030 yr.
5 Discussion
5.1 Source Morphologies
Of the 24 sources observed we have manually classified them as 6 unresolved naked cores, 10 short jets (less than 10 mas), 4 long jets (more than 10 mas), 2 very bent jets, and 2 CSOs (see Table 2). In Fig. 3 we plot the core fraction, defined as the ratio of the peak to the integrated intensity, versus the spectral index of the core component between 5 and 15 GHz. As expected, the naked core and short jet sources have the flattest spectra (with one exception of a long jet source). Such sources are likely oriented at angles close to the line-of-sight and are prime candidates for gamma-ray emission.
The two sources with highly bent jets have both steep spectra and a low core fraction, possibly indicating that they are viewed at moderately large angles to the line-of-sight. In this case their sharp bends are unlikely to be due to projection effects, and must be intrinsically large. For the one CSO detected at both 5 and 15 GHz, the core fraction is overestimated since the peak in the image corresponds to a hot spot, and not to the core.
5.2 Evolution of AGN
Compact Symmetric Objects (CSOs), by virtue of their small sizes (1 kpc), are thought to be examples of young ( yr) radio sources that may evolve to eventually become the well-known FRII-type radio sources (Readhead et al., 1996). Only small numbers of CSOs are known (40; Peck & Taylor 2000), limiting our ability to study radio sources at early times in their evolutionary history.
We present the discovery of a probable new CSO, J08553+5751. Although this pilot sample is far from complete, and with only 23 sources the statistics are unreliable, the detection rate of 1/23 (not counting the CSO J14142+4554 since it was deliberately selected) or 4% is interesting. Taylor & Peck (2003) found a detection rate of 2% for sources selected from the southern part of the VCS. This is similar to that obtained for the northern part of the VCS (Peck & Taylor, 2000). As pointed out by Peck & Taylor (2000), this detection rate is much lower than that found in the PR sample of 7/65 (11%), or 18/411 (4.4%) found in the combined PR and CJ samples. We expect a slightly lower detection rate because the VCS is comprised predominantly of flat spectrum sources. Nonetheless, the significantly lower detection rate found in the VCS is probably the result of the reduced sensitivity and () coverage compared to the PR and CJ surveys. If the VIPS CSO detection rate is well above 2% then that indicates that the drop previously seen is not the result of looking at the fainter end of the luminosity function. With a 4% detection rate the VIPS survey would add 40 CSOs to those known, roughly doubling the number of objects. Assuming Poisson statistics apply and we get 40 CSOs, then we should be able to determine the CSO fraction to an accuracy of 0.6%.
5.3 Magnetic Fields in the AGN Environment
Typical quasars have rotation measures which are large (1000 rad m-2; Taylor 1998, Zavala & Taylor 2003, 2004) and time-variable (Zavala & Taylor, 2001). In the VIPS pilot sample we find core RMs ranging from 2245 rad m-2 in J16484+4104 to 93120 rad m-2 in J15457+5400 (Table 4). The average absolute value for the 8 sources shown in Fig. 2 is 390 100 rad m-2. This value is somewhat less than the value of 640 rad m-2 found by Zavala & Taylor (2004) for a sample of 40 strong AGN. Presumably the Faraday screen orginates in close proximity to the AGN jet, possibly created by an interaction between the jet and the ambient gas. Note that intrinsic RMs are larger by a factor of (1+z)2. The smaller RMs in the present sample could be the result of higher source redshifts, thinner Faraday screens, or small number statistics.
Knowing the core RM value is also critical in order to make sense of the jet properties as otherwise the RM will tend to “smear-out” intrinsic relationships. With only 8 sources we do not presume to look for any trends in the magnetic field orientation.
We note that the jets in 5 sources with extended polarization detections all have low RMs (in the range 50 rad m-2), consistent with results from Zavala & Taylor (2004).
6 Conclusions
We demonstrate that reliable, high dynamic range, total intensity VLBA images can be obtained at 5 GHz for 100% (24 of 24) sources with an integrated flux density of over 50 mJy at 8.4 GHz, using a survey mode with 1.7 hours total integration time per source. For 21 of 24 sources (88%) high dynamic range images were also obtained at 15 GHz, allowing for the production of spectral index images. We find a third of the target sources can be imaged in linear polarization as well, allowing us to determine Faraday rotation measures. A pilot project of 48 hours of observations yields a wealth of information for 24 AGN. From this sample we report on the discovery of a new CSO, JVAS J08553+5751.
Future observations of the complete VIPS sample of 1000 sources will provide an unparalleled combination of size, depth, and polarization information. The large sample of high-quality data sets, especially when combined with surveys at other wavelengths, will provide an excellent resource for studying the nature of Gamma-ray loud AGN, the jet magnetic fields, the environs of the AGN, and AGN evolution.
This research has made use of the NASA/IPAC Extragalactic Database (NED) which is operated by the Jet Propulsion Laboratory, Caltech, under contract with NASA.
References
- Abazajian et al. (2004) Abazajian, K., et al. 2004, AJ, 128, 502
- Abazajian et al. (2005) Abazajian, K., et al. 2005, AJ, submitted, astro-ph/0410239
- Beasley et al. (2002) Beasley, A. J., Gordon, D., Peck, A. B., Petrov, L., MacMillan, D. S., Fomalont, E. B., & Ma, C. 2002, ApJS, 141, 13
- Condon et al. (1998) Condon, J. J., Cotton, W. D., Greisen, E. W., Yin, Q. F., Perley, R. A., Taylor, G. B., & Broderick, J. J. 1998, AJ, 115, 1693
- Dermer & Schlickeiser (1994) Dermer, C.D. & Schlickeiser, R. 1994, ApJS, 90 945
- Falco, Kochanek, & Muñoz (1998) Falco, E. E., Kochanek, C. S., & Muñoz, J. A. 1998, ApJ, 494, 47
- Fanaroff & Riley (1974) Fanaroff, B. L. & Riley, J. M. 1974, MNRAS, 167, 31P
- Gabuzda et al. (2000) Gabuzda, D.C. et al. 2000, MNRAS, 319, 1109
- Gehrels & Michelson (1999) Gehrels, N. & Michelson, P. 1999, Astroparticle Physics, 11, 277
- Gregory et al. (1996) Gregory, P. C., Scott, W. K., Douglas, K., & Condon, J. J. 1996, ApJS, 103, 427
- Greisen (2003) Greisen, E. W. 2003, in Information Handling in Astronomy - Historical Vistas, ed. A. Heck, Astrophysics and Space Science Library Vol. 285 (Dordrecht: Kluwer), 109
- Gugliucci et al. (2005) Gugliucci, N. E., Taylor, G. B., Peck, A. B., & Giroletti, M. 2005, ApJ, in press
- Ma et al. (1998) Ma, C., et al. 1998, AJ, 116, 516
- Mattox et al. (1997) Mattox, J. R., Schachter, J., Molnar, L., Hartman, R. C., & Patnaik, A. R. 1997, ApJ, 481, 95
- Mattox et al. (2001) Mattox, J. R., Hartman, R. C., & Reimer, O. 2001, ApJS, 135, 155
- Meier, Koide, & Uchida (2001) Meier, D.L., Koide, S., & Uchida, Y. 2001, Science, 291, 84
- Myers et al. (2003) Myers, S. T., et al. 2003, MNRAS 341, 1
- Pearson & Readhead (1988) Pearson T. J., & Readhead A. C. S. 1988, ApJ 328, 114
- Peck & Taylor (2000) Peck, A. B. & Taylor, G. B. 2000, ApJ, 534, 90
- Pollack et al. (2003) Pollack L.K., Taylor G.B., & Zavala R.T. 2003, ApJ 589, 733
- Readhead et al. (1996) Readhead, A. C. S., Taylor, G. B., Pearson, T. J., & Wilkinson, P. N. 1996, ApJ, 460, 634
- Shepherd (1997) Shepherd, M. C. 1997, ASP Conf. Ser. 125: Astronomical Data Analysis Software and Systems VI, 6, 77
- Sowards-Emmerd et al. (2003) Sowards-Emmerd, D., Romani, R. W., & Michelson, P. F. 2003, ApJ, 590, 109
- Taylor et al. (1996) Taylor, G. B., Vermeulen, R. C., Readhead, A. C. S., Pearson, T. J., Henstock, D. R., & Wilkinson, P. N. 1996, ApJS, 107, 37
- Taylor (1998) Taylor, G. B. 1998, ApJ, 506, 637
- Taylor & Myers (2000) Taylor, G. B. & Myers, S. T. 2000 VLBA Scientific Memo 26, National Radio Astronomy Observatory
- Taylor & Peck (2003) Taylor, G. B. & Peck, A. B. 2003, ApJ, 597, 157
- Vercellone et al. (2004) Vercellone, S., Soldi, S., Chen, A. W., & Tavani, M. 2004, MNRAS, 353, 890
- Weinstein et al. (2004) Weinstein, M. A., et al. 2004, ApJS, 155, 243
- Zavala & Taylor (2001) Zavala, R. T. & Taylor, G. B. 2001, ApJ, 550, L147
- Zavala & Taylor (2003) Zavala, R. T. & Taylor, G. B. 2003, ApJ, 589, 126
- Zavala & Taylor (2004) Zavala, R. T. & Taylor, G. B. 2004, ApJ, in press, astro-ph/0405534

| Source | Alternate | 8 GHz | ||||||
|---|---|---|---|---|---|---|---|---|
| Name | Name | RA | Dec | ID | ||||
| (1) | (2) | (3) | (4) | (5) | (6) | (7) | (8) | (9) |
| J08474+5723 | 0843+575 | 08 47 28.0579 | 57 23 38.349 | 240 | … | … | … | C |
| J08490+5603 | 08 49 00.8546 | 56 03 50.122 | 70 | Q | 21.267 | … | A | |
| J08499+5108 | 08 49 57.9836 | 51 08 28.997 | 325 | Q | 18.194 | 0.584 | A | |
| J08507+5159 | 08 50 42.2482 | 51 59 11.674 | 112 | Q | 18.961 | 1.892 | A | |
| J08546+5757 | 0850+581 | 08 54 41.9973 | 57 57 29.927 | 890 | Q | 17.739 | 1.318 | C |
| J08553+5751 | 0851+580 | 08 55 21.3558 | 57 51 44.091 | 160 | G | 19.843 | … | C |
| J08575+5827 | 08 57 31.4511 | 58 27 22.538 | 88 | Q | 22.082 | … | B | |
| J08585+5552 | 08 58 30.4786 | 55 52 41.302 | 52 | G | 18.473 | … | B | |
| J09030+4651 | 0859+470 | 09 03 03.9901030 | 46 51 04.13753 | 963 | Q | 18.989 | 1.47 | B |
| J09470+5907 | 09 47 04.8631 | 59 07 41.467 | 70 | … | … | … | D | |
| J09493+6039 | 09 49 20.2283 | 60 39 22.871 | 325 | Q | 19.917 | … | D | |
| J09496+5819 | 09 49 39.8149 | 58 19 12.933 | 112 | Q | 21.308 | … | D | |
| J14142+4554 | 1412+461 | 14 14 14.8535061 | 45 54 48.65427 | 80 | G | 20.158 | … | B |
| J15406+5803 | 15 40 37.5779 | 58 03 34.398 | 71 | Q | 18.549 | 1.25 | A | |
| J15450+5135 | 1543+517 | 15 45 02.8222 | 51 35 00.874 | 635 | Q | 17.552 | 1.93 | A |
| J15457+5400 | 15 45 43.8287 | 54 00 42.764 | 145 | Q | 19.827 | … | A | |
| J15465+5146 | 15 46 33.6208 | 51 46 45.455 | 90 | Q | 19.943 | … | B | |
| J15521+5552 | 15 52 10.8942 | 55 52 43.211 | 131 | Q | 20.688 | … | B | |
| J16445+3916 | 1642+393 | 16 44 34.4775 | 39 16 04.915 | 635 | Q | 19.808 | 1.583 | D |
| J16469+4059 | 1645+410 | 16 46 56.8603 | 40 59 17.167 | 71 | Q | 19.252 | … | D |
| J16484+4104 | 1646+411 | 16 48 29.2622 | 41 04 05.558 | 210 | Q | 18.741 | 0.852 | C |
| J16525+4013 | 16 52 33.2136 | 40 13 58.339 | 100 | Q | 20.465 | … | C | |
| J16529+3902 | 1651+391 | 16 52 58.5096 | 39 02 49.807 | 330 | Q | 21.341 | … | C |
| J16542+3950 | 16 54 12.7223 | 39 50 05.681 | 145 | Q | 19.948 | … | D |
| Peak Flux | rms | |||||||
|---|---|---|---|---|---|---|---|---|
| Source | Beam | Total Flux | (mJy | (mJy | Fit | Morph- | Core | |
| Name | (mas) | (∘) | (mJy) | beam-1) | beam-1) | ology∗ | Fraction | |
| J08474+5723 | 2.991.53 | 0.8 | 219.5 | 110.0 | 0.21 | 0.998 | bj | 0.50 |
| J08490+5603 | 3.071.50 | 4.0 | 72.6 | 50.2 | 0.23 | 1.014 | sj | 0.69 |
| J08499+5108 | 3.031.51 | 3.5 | 191.8 | 167.5 | 0.19 | 1.009 | sj | 0.87 |
| J08507+5159 | 2.971.50 | 3.8 | 103.5 | 102.3 | 0.24 | 1.064 | nc | 0.99 |
| J08546+5757 | 2.981.54 | 0.6 | 875.3 | 645.8 | 0.23 | 0.979 | lj | 0.74 |
| J08553+5751 | 3.111.61 | 0.7 | 44.4 | 26.2 | 0.21 | 1.015 | CSO | 0.59 |
| J08575+5827 | 2.991.53 | 1.1 | 83.3 | 66.7 | 0.19 | 1.010 | sj | 0.80 |
| J08585+5552 | 3.141.63 | 2.7 | 30.1 | 17.1 | 0.17 | 0.995 | lj | 0.57 |
| J09030+4651 | 3.111.54 | 1.1 | 746.6 | 503.4 | 0.20 | 0.952 | lj | 0.67 |
| J09470+5907 | 3.962.67 | 6.1 | 208.2 | 181.7 | 0.29 | 0.992 | bj | 0.87 |
| J09493+6039 | 3.972.65 | 8.8 | 58.5 | 57.4 | 0.23 | 0.991 | nc | 0.98 |
| J09496+5819 | 3.952.65 | 10.5 | 37.3 | 37.3 | 0.21 | 0.968 | nc | 1.00 |
| J14142+4554 | 3.361.64 | 8.9 | 171.3 | 43.6 | 0.23 | 1.061 | CSO | 0.25 |
| J15406+5803 | 3.011.54 | 1.4 | 35.2 | 28.7 | 0.18 | 0.990 | nc | 0.82 |
| J15450+5135 | 3.111.56 | 3.1 | 318.7 | 211.4 | 0.27 | 1.102 | lj | 0.66 |
| J15457+5400 | 3.091.52 | 0.5 | 192.5 | 192.4 | 0.21 | 1.036 | nc | 1.00 |
| J15465+5146 | 3.231.59 | 4.9 | 78.2 | 69.2 | 0.23 | 1.026 | sj | 0.88 |
| J15521+5552 | 3.171.56 | 5.6 | 59.9 | 39.4 | 0.20 | 1.000 | sj | 0.66 |
| J16445+3916 | 3.471.92 | 21.6 | 64.2 | 46.7 | 0.23 | 0.983 | sj | 0.73 |
| J16469+4059 | 3.441.93 | 20.4 | 247.5 | 209.3 | 0.21 | 0.985 | sj | 0.85 |
| J16484+4104 | 3.201.55 | 11.5 | 307.7 | 291.5 | 0.25 | 1.086 | sj | 0.95 |
| J16525+4013 | 3.201.53 | 9.9 | 76.6 | 59.2 | 0.21 | 0.992 | sj | 0.77 |
| J16529+3902 | 3.261.54 | 10.7 | 345.0 | 334.5 | 0.19 | 0.912 | sj | 0.97 |
| J16542+3950 | 3.481.93 | 20.6 | 91.4 | 88.5 | 0.24 | 1.017 | nc | 0.97 |
| Peak Flux | rms | Spectral | ||||||
|---|---|---|---|---|---|---|---|---|
| Source | Beam | Total Flux | (mJy | (mJy | Fit | Index | Core | |
| Name | (mas) | (∘) | (mJy) | beam-1) | beam-1) | Fraction | ||
| J08474+5723 | 0.980.52 | 2.2 | 66.9 | 24.6 | 0.19 | 0.972 | 1.32 | 0.37 |
| J08490+5603 | 1.000.53 | 1.9 | 44.6 | 33.6 | 0.18 | 0.979 | 0.35 | 0.75 |
| J08499+5108 | 0.980.51 | 2.8 | 198.2 | 159.0 | 0.19 | 0.981 | 0.05 | 0.80 |
| J08507+5159 | 0.980.52 | 4.3 | 54.3 | 49.2 | 0.21 | 0.996 | 0.64 | 0.91 |
| J08546+5757 | 0.970.53 | 1.0 | 495.5 | 266.9 | 0.21 | 1.014 | 0.78 | 0.54 |
| J08553+5751 | ||||||||
| J08575+5827 | 1.060.52 | 1.7 | 52.5 | 28.4 | 0.16 | 0.972 | 0.75 | 0.54 |
| J08585+5552 | ||||||||
| J09030+4651 | 1.100.52 | 2.4 | 748.6 | 616.1 | 0.18 | 0.922 | 0.18 | 0.82 |
| J09470+5907 | 0.980.53 | 7.4 | 133.2 | 59.9 | 0.31 | 1.019 | 0.97 | 0.45 |
| J09493+6039 | 0.940.52 | 9.7 | 53.9 | 40.9 | 0.22 | 0.975 | 0.30 | 0.76 |
| J09496+5819 | 1.000.53 | 1.8 | 45.0 | 45.0 | 0.23 | 0.975 | 0.16 | 1.00 |
| J14142+4554 | 1.210.60 | 0.9 | 34.6 | 21.6 | 0.24 | 0.950 | 0.62 | 0.62 |
| J15406+5803 | ||||||||
| J15450+5135 | 1.040.54 | 1.4 | 116.2 | 56.9 | 0.23 | 1.024 | 1.15 | 0.49 |
| J15457+5400 | 1.020.53 | 0.3 | 156.6 | 155.9 | 0.18 | 0.993 | 0.18 | 1.00 |
| J15465+5146 | 1.180.59 | 16.0 | 33.1 | 33.0 | 0.25 | 0.995 | 0.65 | 1.00 |
| J15521+5552 | 1.160.59 | 17.0 | 42.6 | 36.4 | 0.27 | 1.003 | 0.07 | 0.80 |
| J16445+3916 | 1.050.52 | 8.5 | 65.0 | 61.4 | 0.25 | 0.999 | 0.24 | 0.94 |
| J16469+4059 | 1.050.52 | 8.4 | 265.1 | 179.5 | 0.17 | 0.983 | 0.13 | 0.68 |
| J16484+4104 | 1.040.51 | 12.3 | 452.1 | 426.9 | 0.23 | 0.994 | 0.33 | 0.94 |
| J16525+4013 | 1.040.51 | 12.9 | 63.7 | 50.7 | 0.23 | 0.991 | 0.14 | 0.80 |
| J16529+3902 | 1.060.51 | 10.8 | 332.4 | 323.7 | 0.22 | 0.980 | 0.03 | 0.97 |
| J16542+3950 | 1.050.52 | 7.4 | 77.7 | 57.2 | 0.21 | 0.987 | 0.38 | 0.74 |
| Source | RM | |||||||
|---|---|---|---|---|---|---|---|---|
| Name | (mJy beam-1) | (%) | (deg) | (mJy beam-1) | (%) | (deg) | (rad m-2) | (deg) |
| (1) | (2) | (3) | (4) | (5) | (6) | (7) | (8) | (9) |
| J08499+5108 | 3.6 | 3.9 | 24 | 0.5 | 0.5 | 77 | 282 50 | 173 |
| J08546+5757 | 7.5 | 2.0 | 0 | 6.1 | 2.5 | 51 | 259 7 | 147 |
| J09030+4651 | 1.3 | 0.8 | 18 | 1.7 | 0.8 | 48 | 585 22 | 129 |
| J15450+5135 | 0.9 | 1.9 | 74 | 0.4 | 3.3 | 70 | 200 60 | 28 |
| J15457+5400 | 1.8 | 1.2 | 18 | 3.9 | 3.2 | 26 | 931 20 | 84 |
| J16469+4059 | 2.4 | 1.2 | 79 | 7.1 | 3.0 | 4 | 565 14 | 106 |
| J16484+4104 | 1.2 | 0.6 | 81 | 1.4 | 0.4 | 89 | 22 45 | 179 |
| J16529+3902 | 7.5 | 2.3 | 73 | 4.7 | 1.4 | 48 | 289 8 | 136 |