X-ray Diagnostics of Broad Absorption Line Quasar Geometry
Abstract
A new generation of sensitive X-ray measurements are indicating that the existence of X-ray attenuation column densities, is quite common amongst broad absorption line quasars (BALQSOs). This is significant to the geometry of the broad absorption line (BAL) outflow. In particular, such an X-ray shield also shields equatorial accretion disk winds from the UV, thereby preventing high velocity equatorial outflows from being launched. By contrast, bipolar winds initiated by continuum radiation pressure from the funnel of a slim accretion disk flare outward (like a trumpet) and offer vastly different absorbing columns to the X-ray and UV emission which are emitted from distinct regions of the disk, and , respectively (where is the radius of the black hole). Recent numerical work indicates that it is also possible to launch bipolar outflows from the inner regions of a thin disk. The recent discovery with VLBI that the Galactic analog of a BALQSO, the X-ray binary Circinus X-1 (with high velocity P Cygni X-ray absorption lines) is viewed virtually along the radio jet axis (and therefore along the spin axis of the black hole and the normal to the accretion disk) has rekindled interest in the bipolar models of BALQSOs. We explore this possibility by studying the nearest BAL QSO, MRK 231. High resolution 2-D optical spectroscopy and VLBI mappings of the radio jet axis indicates that the BAL outflow is parallel to the parsec scale radio jet.
1 Introduction
It is of great physical significance that about 10% - 15% of quasars show broad absorption line (loosely defined as absorbing gas that is blue shifted at least 5,000 km/s relative to the QSO rest frame and displaying a spread in velocity of at least 2,000 km/s) outflows (Weymann, 1997). It is widely believed that all radio quiet quasars have BAL flows, but the designation of a quasar as a BALQSO depends on whether the line of sight intersects the solid angle subtended by the outflow. The standard model of quasars is one of a hot accretion flow onto a black hole and a surrounding torus of molecular gas (Antonucci, 1993). A very popular model of the BALQSOs is an equatorial wind driven from the luminous disk that is viewed at low latitudes, just above the molecular gas (Murray et al, 1995). Alternatively, one can have a bipolar BAL flow that conforms with the observations (Punsly, 1999b; Proga and Kallman, 2004). However, BALQSOs are so distant that direct imaging of the BAL region is beyond the resolution of current optical telescopes. Thus, much of the discussion of BAL geometry is based on deductive reasoning. In this Letter, we implement observations of nearby BAL systems in order to achieve the high resolution necessary to determine the geometry directly. In particular, we discuss new observations of the nearest BALQSO MRK 231.
Recently, new studies of the X-ray binary Circinus X-1 has changed our perspective. Circinus X-1 has P Cygni absorption profiles in the X-rays associated with a high velocity broad absorption line flow. Thus, the accretion disk of Circinus X-1 has been considered a Galactic example of a broad absorption line quasar (Brandt and Schulz, 2001). Radio observations of Circinus X-1 have now indicated jet outflow velocities of 15 c (Fender et al, 2004). This can only occur for a relativistic flow that is viewed within a few degrees of the axis of the jet (Lind and Blandford, 1985). The Galactic example of a broad absorption line quasar is therefore viewed pole-on.
The findings on Circinus X-1 raise the question, are BAL QSOs being viewed close to the black hole spin axis? We begin this empirical analysis of BAL geometry by studying the wealth of new X-ray data on BALQSOs. A picture seems to be emerging that shows Thompson thick absorbing columns to the X-ray source. In the most realistic models of equatorial outflows, Murray et al (1995); Proga et al (2000), Thompson thick columns are catastrophic because they block the UV photons form accelerating the BAL region outward. Thus, the new X-ray observations indicate that high velocity equatorial BAL winds as we know them can not be attained in many BALQSOs. In order to determine the geometry of a true BALQSO, one must turn to the nearest example in order to achieve adequate resolution, MRK 231. Fortunately, MRK 231 also has a radio jet that is powerful enough to be imaged on pc scales. In this Letter, we combine VLBI mapping of the jet with 2-D spectroscopy of MRK 231 to show that both the radio jet and the BAL region flow outward from the nucleus along PA .
2 X-ray observations of BALQSOs
The X-ray flux from the quasar tends to over-ionize gas the atoms in a putative BAL outflow, preventing resonant absorption and the resultant line driving force. In a breakthrough paper of Murray et al (1995), it was shown that if the quasar X-rays were shielded, a line driven wind was possible from the accretion disk which they argued was preferable to an outflow of dense BAL clouds and the associated confinement problems. The earliest X-ray observations of BALQSOs supported the notion of X-ray shielding gas. ROSAT soft X-ray measurements indicated that BALQSOs were X-ray suppressed relative to other quasars (Green and Mathur, 1996). Numerically, further evidence was found in Proga et al (2000) in which models naturally produced a shield of X-ray emitting gas between the central radiation source and the high velocity winds. In this section, we consider the most recent X-ray observations and their application to the details of the shielding gas.
2.1 Observing X-ray Absorption Columns
The ROSAT observations of BALQSOs indicated that X-ray absorbing columns were quite typical (Green and Mathur, 1996). However, as observations at higher energy, higher sensitivity and higher resolution have become available estimates of these absorbing columns have increased dramatically. This essentially is a consequence of the fact that at the absorbing column is essentially black to soft X-rays (Murray et al, 1995). One needs higher energy X-ray measurements to learn more. Secondly, the fluxes from the BALQSO nucleus are so attenuated that they can be swamped by any nearby X-ray source. Thus, high resolution telescopes such as XMM are valuable. We illustrate these points with a couple of examples.
The prototypical BALQSO is PHL5200. Deep ASCA observations indicated an absorbing column of Mathur et al (2001). However, deeper high resolution imaging with XMM in Brinkmann et al (2002) indicated that the poor resolution of ASCA allowed X-rays from a background radio source to flood the detectors. Only a small percentage of the total X-ray flux were attributable to PHL 5200. There were not even enough photons detected in ksec to determine the spectral properties and the absorption. One thing that is certain, the absorbing column is clearly significantly larger than the ASCA value of and therefore Thompson thick.
Next we review the X-ray data on MRK 231, the nearest BALQSO. Using ASCA and ROSAT observations, Turner (1999), determined an absorbing column of to depending on whether the absorbing material is neutral or ionized. The ASCA data were analyzed in Maloney and Reynolds (2000) who deduced that the direct observation of the nuclear X-rays was blocked by an optically thick absorber and we observe a strong reflected and scattered component through a neutral column density of . Similarly, from Chandra data Gallagher et al (2002) find a best fit to the data if the central source is blocked by a Compton thick absorber, and we detect scattered X-rays through multiple lines of sight through absorbing columns of - . Finally, hard X-ray BeppoSAX observations of MRK 231 combined with XMM deep observations have been made by Braito et al (2004). The high energy coverage combined with the 20 ks XMM observation provides the best determination of spectral parameters to date. They find that . Thus, as the measurements have improved, the column density estimates have increased.
We also note the deep ASCA observation of PG0946+301 in Mathur et al (2000). After previous non-detections only yielded upper limits to , this deep observation was best fit with a Thompson thick column of . The large column densities that have been deduced from the X-ray data are clearly only lower limits. Once the absorbing column is black, small amounts of scattered X-rays or X-rays leaking through a patchy absorber (small domains with to ) will dominate the X-ray flux and of the bulk of the absorbing column will be greatly underestimated. Therefore, in view of the recent X-ray data it is now apparent that many BALQSOs are likely to have X-ray absorbing columns with Compton optical depths considerably larger than one.
2.2 The Implications for Disk Wind Models
In order for an equatorial flow to be launched from an accretion disk, the wind must emanate at large distances from the hole, cm, so that the radiation source appears as a flux of photons roughly parallel to the accretion disk surface. This allows momentum transfer along the equatorial direction, driving the equatorial BAL wind. As the wind is launched closer and closer to the source it looks more and more bipolar, since the photon flux attains a large vertical component (see Proga et al (2000) and references therein).
A second necessary ingredient for the geometry is a region of X-ray shielding gas in order to insure the proper ionization state is achieved at cm so that lithium like atoms are available for the line driving force to work efficiently (Murray et al, 1995). The discovery of the large X-ray absorbing columns in BALQSOs has been heralded as the likely verification of the shielding gas at the inner edge of the wind and a triumph of the model Gallagher et al (2002). However, this is not really shielding gas, but filtering gas: it must filter out the X-rays and allow the UV emission to pass through with small attenuation. By geometric considerations, the UV and X-ray emitting regions are well inside of the distant wind zone and the shield (Proga et al, 2000). Thus, if the X-rays are shielded, so are the UV photons. For this reason Proga et al (2000) states explicitly that for , ”the line force form the central engine could be so much reduced that it may not be able to accelerate the gas to high radial velocities and no strong wind will be produced.” Thus, the large column densities that have been found are problematic for equatorial models of BALQSO winds. However, there are disk wind models of bipolar outflows that do not suffer these same problems. Bipolar outflows are ejected from the funnels of slim disks in Punsly (1999b) and the work of Proga and Kallman (2004) strongly suggest that bipolar winds can be driven from a thin accretion disk at the relatively small radii.
3 The BAL Outflow Geometry of MRK 231
Bipolar models of BALQSOs do not suffer the UV attenuation problem that arises from the large X-ray absorbing columns (Punsly, 1999a, b). The wind is launched by continuum radiation pressure and subsequently boosted by line driving forces farther out. Thus, near its base the outflow is a hypersonic under-expanded jet that flares outward like a trumpet. Thus, regions at different cylindrical radii on the surface of the disk (i.e., such as the X-ray region, , and the UV region, , where M is the radius of a rapidly rotating central black hole) are exposed to different absorbing columns of wind outflow. The X-rays typically pass through to and the UV passes through (Punsly, 1999b). Combining this with the observation of a polar BAL outflow in Circinus X-1, it is of interest to see if any BALQSO can be shown to have a polar BAL wind. The best possibility for success is to choose the nearest BALQSO in order to get adequate resolution, MRK 231.
3.1 VLBI Observations of MRK 231
High resolution VLBI can be used to determine a radio jet axis at 1pc and give an estimate of the spin axis of the black hole and the therefore the normal to the accretion disk. MRK 231 has been observed with VLBI by Taylor et al (1994); Ulvestad et al (1999a, b); Lonsdale et al (2003). The highest resolution measurements have been made at 15 GHz in Ulvestad et al (1999a, b) with a resolution of about 0.9 pc. A jet like structure propagates at PA = in one epoch and PA = in another epoch. The large variability of the northeast component (a factor of 2.5 in 1.8 years) allows its identification as the radio core. This identification of the core is consistent with our 2-D spectroscopy.
3.2 2-D Optical Spectroscopy of MRK 231
Optical spectroscopy was performed on MRK 231 with the 4.2 m William Herschel Telescope in Lipari et al (2005). The detector was an array of fiber optics and a spectrum was reduced from each of the fiber optic responses. Each fiber optic captured light from a sector of the sky 0.45” in radius. The result is a 2-D mosaic of spectra that covers the central region of MRK 231, 10 kpc x 13 kpc in extent.
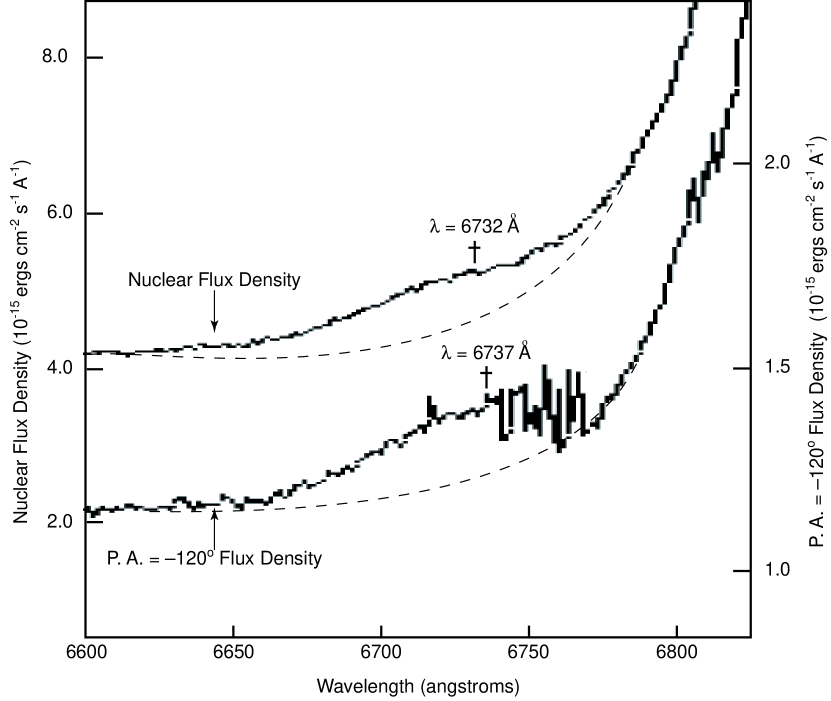
The results of the spectroscopy that are relevant are plotted in figure 1. We are interested in features representing an outflow and the blue wing of the broad H line provides some clues. The upper spectrum is from the nuclear fiber optic and encompasses the region pc, km/s/Mpc. The lower plot is from the adjacent fiber optic at PA = , from the nucleus. Note the broad emission line feature that is superimposed on the blue wing of the H line. This feature exists in the nuclear fiber optic and is more pronounced in the adjacent fiber optic at PA = . There is no evidence of this blue bump in the spectra of any other of the fiber optics that are adjacent to the nucleus (the spectra at all of the fiber optic positions can be found in (Lipari et al, 2005)). The conclusion is that this is high velocity H emitting gas that is flowing at PA . The gas is actually radiating more blue shifted photons from within pc, but this is swamped by the elevated background emission.
One can estimate the peak velocity of the blue shifted H by extrapolating the background broad line wing. This is indicated by the dashed lines in figure 1. The peaks of the emission relative to the background wing are indicated by daggers. The extrapolation of the continuum is somewhat arbitrary and we have chosen are best fit so that the two spectra have similar background blue wings. With this fit, we use the peak of H at from Lipari et al (1994) and the cosmological redshift of z=0.042 to find the relativistic outflow velocities associated with the blue shifted peaks of 4,729 km/s in the nucleus and 4,506 km/sec at PA = (Lightman et al, 1975). Note that there is some uncertainty in the estimate of the PA = peak due to the emergence of narrow line emission that contaminates the broad profile. We fit the background blue wings in a variety of ways that modify the velocity estimate associated with the peak of the nuclear outflow (varies within the range of 4,500 km/sec - 5,000 km/sec depending on the background fit) and for the PA = spectra (varies from 4,300 km/sec - 4,700 km/sec, depending on the background fit).
As mentioned above the narrow line emission at PA = adds some uncertainty to the estimate of the velocity of the blue bump emitting gas. It could be responsible for the slight disagreement with the nuclear blue bump velocity, since the narrow lines contribute flux to the red side of the blue bump. If one goes to the next fiber optic out along PA = located between 1340 pc and 2030 pc from the nucleus, the narrow line emission becomes very strong (Lipari et al, 2005). None of the other fiber optics show this strong emission. The generation of a strong narrow line region is expected from jet propagation in the ISM (Bicknell et al, 1998). In fact, a similar spectral effect has been attributed to bow shocks in the Circinus galaxy (Veilleux and Bland-Hawthorn, 1997). Thus, it seems clear that the outflow, initially traced by the inner VLBI jet, extends kpc at PA . This direction validates the variable VLBA component as the nucleus (as opposed to PA ).
3.3 The Relationship to the BAL Gas
MRK 231 is notable for the existence of many strong low ionization broad absorption lines. It is particularly noteworthy that the primary Na I D doublet, He I 3889 I, Ca II K 3934 and Ca II H 3968 broad absorption lines occur with velocities 4,590 km/sec - 4,670 km/sec (Lipari et al, 1994; Martel, 1997). There is H emitting gas in the nuclear region that also flows at 4,690 km/sec. Either this is a coincidence or the two flows are one and the same. The latter seems more plausible to us and therefore, we conclude that the low ionization BAL gas is flowing outward at PA , parallel to the projection of the jet axis on the sky plane to within . Detailed studies of other low ionization BALQSO place the BAL region 200 pc -700 pc from the nucleus (De Kool et al, 2001, 2002). However, since the blue bump is the most luminous in the nuclear fiber optic, the BAL flow can be located anywhere within the nuclear region, 366 pc and need not be at such large distances.
4 Conclusion
In this Letter, we have discussed how the large observed X-ray absorbing columns in BALQSOs pose an apparent catastrophic problem for the currently realistic existing equatorial BAL wind models. We also point out that this is not an issue for bipolar flows. Evidence is presented from Circinus X-1 and MRK 231 that bipolar BAL flows seem to exist. There is likely many sources of BAL flows in quasars. This is particularly true for IR QSOs and high redshift QSO which are likely to be young objects (Lipari et al, 2005). Our analysis indicates that bipolar BAL flows could be common.
Motivated by our findings it has become apparent that efforts to create new numerical models that are capable of driving bipolar winds from accretion disks is essential to our understanding of BALQSOs. One promising model is the disk wind model of Proga and Kallman (2004). At relatively small radii, it appears that bipolar winds can be launched. At present, it is difficult to compare the anticipated observed properties of these inner-disk driven winds with funnel driven outflows since the published model is merely an example of a broad class of models that was not optimized to produce for bipolar winds. The existing model has some apparent observable properties due to the choice of a disk from (Shakura and Sunayev, 1973) with the far UV emitting region very distant from the black hole at that creates a large extreme UV (EUV) source ( to ) in the inner regions of the disk. This source over-produces the flux in the EUV by 2 orders of magnitude compared to composite HST quasar spectra (Telfer et al, 2002; Zheng et al, 1997). There is a large scatter in the quasar spectral shapes used in these composites, so it is possible that some individual spectral energy distributions could peak deep into the EUV. But, this is clearly not typical. At the present level of modeling, it is not clear if this large EUV excess is an expected characteristic of bipolar winds from the inner disk. It might be that the parameters of future models will not require such an EUV excess to occur. It seems that a high priority in this field is to reproduce these simulations with a different disk model, perhaps a larger central black hole mass about a rapidly spinning black hole that will remove the EUV excess and perhaps enhance the bipolar wind production from the inner disk.
References
- Antonucci (1993) Antonucci, R.J. 1993, Annu. Rev. Astron. Astrophys. 31 473
- Bicknell et al (1998) Bicknell, G. et al 1998, ApJ 495, 680
- Braito et al (2004) Braito, V. et al A & A 2004 420 79
- Brandt and Schulz (2001) Brandt, W.N., Schulz, N. 2001, ApJ 544 123
- Brinkmann et al (2002) Brinkmann, W., Ferrero, E., Gliozzi, M. 2002, A & A 385 31
- De Kool et al (2001) De Kool, M. et al ApJ 2001 548 609
- De Kool et al (2002) De Kool, M. et al ApJ 2002 570 514
- Fender et al (2004) Fender, R. et al 2004, Nature 427 222
- Gallagher et al (2002) Gallagher, S, Brandt, W.N., Chartas, G., Gamire, G.P. ApJ 2002 567 37
- Green and Mathur (1996) Green, P. and Mathur, S. ApJ 1996 462 637
- Lightman et al (1975) Lightman, A., Press, W., Price, R. and Teukolsky, S. 1975, Problem Book in Relativity and Gravitation (Princeton University Press, Princeton)
- Lind and Blandford (1985) Lind, K., Blandford, R. 1985, ApJ 295 358
- Lipari et al (1994) Lipari, S., Colina, L., Macchetto, F. ApJ 1994 427 174
- Lipari et al (2005) Lipari, S. et al 2005 submitted to MNRAS astro-ph/0501253
- Lonsdale et al (2003) Lonsdale, C. et al ApJ 2003 592 804
- Maloney and Reynolds (2000) Maloney, P. and Reynolds, C. ApJL 2000 545 23
- Martel (1997) Martel, A. 1997, PhD Thesis, Univ. California Santa Cruz
- Mathur et al (2000) Mathur, M. et al ApJ 2000 533 79
- Mathur et al (2001) Mathur, S. et al ApJ 2001 55113
- Murray et al (1995) Murray, N. et al 1995, ApJ 451 498
- Proga et al (2000) Proga, D., Stone, J., Kallman, T. ApJ 2000 543 686
- Proga and Kallman (2004) Proga, Kallman, T. ApJ 2004 616 688
- Punsly (1999a) Punsly, B. 1999, ApJ 527 609
- Punsly (1999b) Punsly, B. 1999, ApJ 527 624
- Shakura and Sunayev (1973) Shakura, N., Sunayev, R. 1973, A & A 24 337
- Taylor et al (1994) Taylor, G. et al 1994, ApJS 95 345
- Telfer et al (2002) Telfer, R., Zheng, W., Kriss, G., Davidsen, A. 2002, ApJ 565 773
- Turner (1999) Turner, T.J. ApJ 1999 511 142
- Ulvestad et al (1999a) Ulvestad, J., Wrobel, J. and Carilli, C. 1999, ApJ516 134
- Ulvestad et al (1999b) Ulvestad, J. et al 1999, ApJL517 L81
- Veilleux and Bland-Hawthorn (1997) Veilleux, S. and Bland-Hawthorn, J. 1997, ApJL476 L105
- Weymann (1997) Weymann, R. 1997 in ASP Conf. Ser. 128, Mass Ejection from Active Nuclei ed, N.Arav, I. Shlosman and R.J. Weymann (San Francisco: ASP) 3
- Zheng et al (1997) Zheng, W. et al 1997, ApJ 475 469