Massive young clusters in the disc of M31
Abstract
We have studied the properties of a sample of 67 very blue and likely young massive clusters in M31 extracted from the Bologna Revised Catalog of globular clusters, selected according to their color [] and/or to the strength of their spectral index ( Å). Their existence in M31 has been noted by several authors in the past; we show here that these Blue Luminous Compact Clusters (BLCCs) are a significant fraction (%) of the whole globular cluster system of M31. Compared to the global properties of the M31 globular cluster system, they appear to be intrinsically fainter, morphologically less concentrated, and with a shallower Balmer jump and enhanced absorption in their spectra.
Empirical comparison with integrated properties of clusters with known age as well as with theoretical SSP models consistently indicate that their typical age is less than Gyr, while they probably are not so metal-poor as deduced if considered to be old. Either selecting BLCCs by their colors or by the strength of their index the cluster sample turns out to be distributed onto the outskirts of M31 disc, sharing the kinematical properties of the thin, rapidly rotating disc component.
If confirmed to be young and not metal-poor, these clusters indicate the occurrence of a significant recent star formation in the thin disc of M31, although they do not set constraints on the epoch of its early formation.
1 Introduction
Globular clusters (GCs) are ubiquitous stellar systems living in any kind of galaxies, from dwarf to giants, from the earliest to the latest types. Their integrated properties carry crucial information on the physical characteristics of their host galaxy at the time of their formation. Hence, the study of globular clusters systems is a fundamental tool to understand the evolutionary history of the barionic component of distant galaxies (see Harris, 2001 and references therein).
In this framework, the globular cluster system of the Andromeda galaxy (M31) plays a twofold role, as a natural reference to compare the Milky Way (MW) GC population, and as a fundamental testbed for the techniques to be applied to systems in more distant galaxies (see Barmby et al., 2000; Puzia et al., 2002; Rich, 2003; Barmby, 2003; Galleti et al., 2004, and references therein). Indeed, the comparison of the GC system of M31 and the MW has revealed both fundamental similarities and interesting differences whose complete understanding may have a deep impact on our knowledge of galaxy formation and evolution (Hodge, 1992; van den Bergh, 2000; Morrison et al., 2004; Beasley et al., 2004; Burstein et al., 2004).
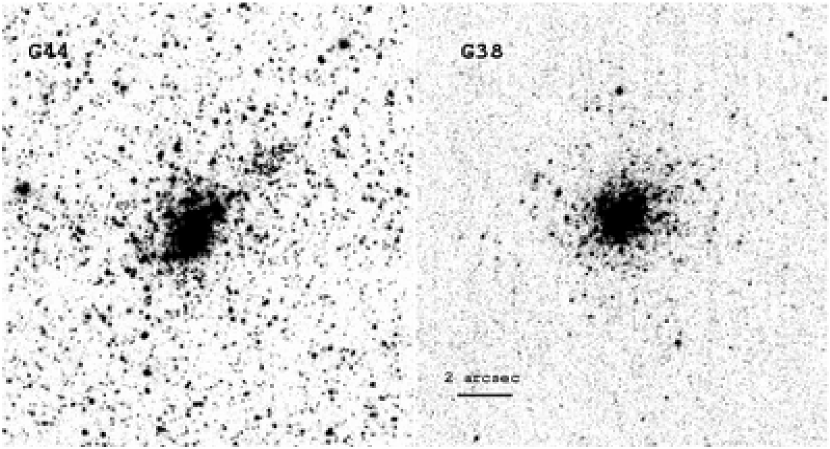
Among the latter ones, in the present contribution we will especially focus on the claimed presence in M31 of stellar systems similar to MW globulars in luminosity and shape but with integrated colors significantly bluer than the bluest MW counterparts. While some of the faintest objects may hardly be distinguished from bright open clusters, the typical family member appears quite similar to classical globulars (two typical examples are shown in Fig. 1, see Williams & Hodge, 2001a, b; Hodge, 1979). In Sec. 3.4 we will provide some evidences suggesting that clusters of similar age and total luminosity may be lacking in the Milky Way. Hereafter, we call them “Blue Luminous Compact Clusters” (BLCCs)111We do not attach any special meaning to this newly introduced term. It must be intended just as a convenient label to describe their color and structural morphology to be used in the following for sake of brevity and clarity.
index.html)
The peculiar colors of BLCCs have been first reported by Vetenik (1962), van den Bergh (1967, 1969), Searle (1978), and this class of objects then received growing attention (Crampton et al., 1985; Cowley & Burstein, 1988; Elson & Walterbos, 1988; King & Lupton, 1991; Bohlin et al., 1993; Barmby et al., 2000; Williams & Hodge, 2001a; Beasley et al., 2004; Burstein et al., 2004), although a systematic study is still lacking.
In particular, Elson & Walterbos (1988) noted 14 such blue clusters, not included in the list of open cluster candidates by Hodge (1979), and better consistent with a GC morphology. Their absolute luminosities spanned the luminosity range , and their positions in a two-color diagram pointed to a possibly young age. For ten of these objects, King & Lupton (1991) provided supplementary UBVR photometry indicating a global luminosity around L⊙. Based on stellar population models, their estimated age appeared to be less than a few yrs, with a typical mass between and M⊙. If confirmed, these values indicate that they are higher than Galactic open clusters, but comparable to those of young, rich globulars found in the Large Magellanic Cloud (Elson & Fall, 1985; van den Bergh, 1991).
Bohlin et al. (1988, 1993), studying the UV-colors of a sample of 49 GC candidates in M31, listed 11 objects classified as blue clusters based on their location in the two-color diagram, and suggested that they are probably young. On the same line, Barmby et al. (2000) noted that their M31 catalog of GC candidates may be contaminated by several young obiects with and they eventually excluded 55 such objects from their analysis of old M31 clusters.
As already stressed long ago (Spinrad & Schweizer, 1972), the integrated spectrum and color of a cluster, especially in the blue, are influenced by the metal abundance and the position of the main sequence turnoff stars (MSTO) (in turn, by the cluster age), by the strength of the horizontal branch (HB), and, to a lesser degree, by the overall luminosity function of its composing stellar population. To disentangle the different effects it is thus very important to obtain the color-magnitude distribution of cluster stellar populations. In this regard, Williams & Hodge (2001a) obtained deep HST photometry of individual stars and c-m diagrams for four of these BLCCs leading to estimate ages in the range 60-160 Myr and metallicity from solar to 2/5 solar. This clearly supports the evidence that the exceedingly blue integrated colors of BLCCs are direct consequence of their remarkably young age.
Beasley et al. (2004) reached similar conclusions for eight BLCCs by comparing high-quality low-resolution spectra of a sample of M31 clusters with similar data for MW and Magellanic Clouds globulars. Burstein et al. (2004) reported a global sample of 19 BLCCs in M31, including 13 “young” objects from the Barmby et al. (2000) survey,222Barmby et al. (2000) classified these clusters as possibly young because of the strong Balmer absorption lines observed in their high-resolution spectra. most of them sharing the kinematical properties of a wider sample of “red” clusters belonging to the cold thin disc detected by Morrison et al. (2004).
In summary, various observations suggest that M31 may have many more young GCs than the MW, and the latest results on the claimed existence of a thin disc subsystem of GCs in M31, quite large in number and covering a very wide range in metallicity from up to solar and above (Perrett et al., 2002; Morrison et al., 2004), have opened an important debate and actually gave rise to the present study.
In fact, as recently discussed by Morrison et al. (2004), Beasley et al. (2004) and Burstein et al. (2004, and references therein), the detection of several old metal-poor clusters with thin-disc kinematics would imply that (i) M31 is likely to have had a disc already in place at the very early stages of the galaxy evolution, and (ii) no substantial merger event can have occurred at later epochs as galaxy disc would have been disrupted or, at least, heated (but see, however, Abadi et al., 2003). This conclusion is at odds with the indications found by Brown et al. (2003), who reported the detection of a wide intermediate-age (6-8 Gyr) population of metal-rich stars (with ) in a minor-axis halo field of M31 observed with HST/ACS, interpreted as the result of the merging with an almost equal-mass companion. As a consequence, it is of primary interest to verify if and how many clusters do belong to the claimed thin disc and, even more important, how old and metal-poor they are.
In the following section we carry out a revision and a new selection of the candidate sample of BLCCs based on different (and partially complementary) criteria, relying on the Bologna Revised Catalog of M31 GCs (hereafter BRC; Galleti et al., 2004).333See the latest electronic version of the catalog available at the Web address: http://www.bo.astro.it/M31 Then, in Sect. 3, we discuss the properties of the global sample of clusters and in particular their kinematical properties, metallicity and estimated ages.
We anticipate that our analysis lead us to conclude that most (if not all) of the BLCCs are younger than Gyr, more metal rich than and they nicely fit the structural and kinematic characteristics of the thin-disc subsystem recently detected by Morrison et al. (2004). This issue is further discussed in Sec. 4, where we also summarize the main results of our analysis.
2 Toward a fair sampling of BLCCs in M31
To carry out a systematic analysis of the BLCC population of the Andromeda galaxy, our BRC data have been complemented with the kinematic and spectral indices information from Perrett et al. (2002). This choice allowed us to preserve full homogeneity in the comparison of line indices, and take advantage at the same time of a larger sample of clusters and a better accuracy of radial velocity measurements. It has to be noted, however, that our main conclusions remain essentially unchanged if the Brodie & Huchra (1990) dataset would have been used instead.
Throughout the paper, for M31 we will assume a distance modulus mag (Freedman & Madore, 1990), a systemic radial velocity km s-1 and a galaxy center, to which refer the XY coordinate system, both from van den Bergh (2000). A single value for the interstellar extinction toward the galaxy is adopted for simplicity, with (McClure & Racine, 1969; Hodge, 1992) and a standard reddening law (e.g. Scheffler, 1982). We verified that our results would remain substantially unaffected when using, in alternative, the Barmby et al. (2000) reddening values.

All the M31 clusters comprised in our analysis (i.e. 67 targets collected in Table 1) belong to Class 1 BRC entries, that is they are all genuine M31 members confirmed either spectroscopically or by means of high-resolution imaging.444Two original Class 1 BRC objects, namely B430-G025 and NB91, eventually resulted foreground field stars to a deeper analysis (Galleti et al., 2004; Beasley et al., 2004) and have been excluded from the present sample. The clusters are selected according to their intrinsic color [i.e. )] and/or to the strength of their spectral index ( Å). The rationale of these selection criteria is explained in detail in the following sections.
2.1 Color selection
Figure 2 is a collection of the GC population for Local Group galaxies in the reddening-corrected U-B vs. B-V color plane. We joined data for the Milky Way (Harris, 1996, and latest updates), the LMC (van den Bergh, 1981), M33 (Chandar et al., 1999), and M31 (Galleti et al., 2004). For the MW globulars, the adopted values of the color excess are those originally provided by (Harris, 1996), while for LMC and 0.07 for M33 (van den Bergh, 2000).
As a well recognized feature, the large majority of M31 GCs in the figure tend to bunch around and closely tracks the locus of the MW globulars, suggesting a similar age and metallicity distribution. On the other hand, as noted long ago by Vetenik (1962), van den Bergh (1967, 1969), and more recently by Barmby et al. (2000), several M31 globulars spread over much bluer colors, compatible with the young and intermediate-age LMC GCs.555Note, however, that some of the most extreme M31 outliers in Fig. 2 plot are probably due to poor photometry in one (likely U) of the UBV bands and/or to inaccurate reddening correction. See Barmby et al. (2000) and Galleti et al. (2004) for a detailed discussion of M31 GC photometry.


Right panels, from top to bottom - Same as the left panels, but for the H-selected BLCCs (Sample “B”; shaded histograms) vs. “ordinary” clusters, now defined as those with H (clean histograms).

On the basis of the B-V distribution of Fig. 2, a more immediate selection criterion for BLCCs in M31 is to pick up those objects bluer than the bluest GC in the MW (i.e. NGC 7492, with ; Harris, 1996). Operationally, we therefore defined a color-selected BLCC sample (referred to as Sample “A” in our following discussion), consisting of 41 objects (out of 330 confirmed GCs in M31, according to BRC) with . These objects are reported in Table 1 (with label “A” in column 12); of them, 29 targets have radial velocity estimates in the list of Perrett et al. (2002). We are aware, of course, that the indicative threshold in the integrated color might be a too “prudent” selection, as for instance it misses cluster G44 (see Fig. 2), claimed by Williams & Hodge (2001a) to have an age about 100 Myr on the basis of the HST c-m diagram. On the other hand, the other three young clusters of Williams & Hodge (2001a) are correctly picked up, and in any case the relevant uncertainty in the reddening correction for most of the M31 clusters prevents any firm selection criteron based on integrated colors alone. Therefore, Sample “A” likely provides a “clean” conservative estimate of the real fraction of young objects in the M31 GC population, and certainly secures our statistics from any contamination of intrisecally “red” clusters, even taking into account the claimed photometric errors, in the range 0.05 to 0.15 mag, depending on the cluster location and the source of the photometry.
2.2 Blue vs. Red GCs: an overall preliminary comparison
Besides the obvious difference in color, it is interesting to further investigate how Sample “A” clusters characterize vs. the remaining fraction of “red” M31 GCs. We therefore extended our analysis to different positional, morphological and spectrophotometric parameters, according to the BRC data. Left panels of Fig. 3 summarize the most striking differences between the two cluster populations. The four histograms report the cluster distribution in absolute magnitude, in two spectrophotometric indices, namely the Brodie & Hanes (1986) and the Lick H index (according to the original definition of Faber et al., 1985), and finally vs. the W1/4 structural parameter measured in an homogeneous way by Buonanno et al. (1982) and Battistini et al. (1987) for almost all the M31 cluster candidates.
In the plots, absolute V magnitudes from the BRC are the result of a full revision of all the available photometry, including the HST data. Magnitude differences with respect to the extended database of Barmby et al. (2000) are typically less than mag, depending in general on a different reddening correction, but with no systematic trend of magnitude residuals with GC color.
Both narrow-band indices considered in Fig. 3 have been taken from Perrett et al. (2002);666Perrett et al. (2002) report all indices in magnitude scale. For the case of H, a transformation to pseudo-equivalent width (EW) units (in Å) has been done through the equation: (see, e.g. Brodie & Huchra, 1990), where is the original index, in magnitude scale. due to their unfluxed observations, however, the instrumental output had to be reduced to a standard system. This has been done relying on a set of 41 M31 GCs in common with Brodie & Huchra (1990) for which both and standard Lick indices are provided in the appropriate units (see Fig. 4). As for H, which measures the strength of the Balmer absorption line in pseudo-equivalent width, we verified that no transformation was necessary for the Perrett et al. (2002) original data, that roughly matched the Lick standard system within a high, but still convenient, 0.9 Å rms. In case of the index, measuring the amplitude of the 4000 Å Balmer jump in the integrated spectra of the clusters, the Brodie & Hanes (1986) standard system was reproduced via a linear transformation in the form
| (1) |
with a 0.12 mag rms in the individual point scatter. The corresponding plots in Fig. 3 have been corrected to the standard system accordingly.
Finally, the bottom histogram of Fig. 3 reports the distribution of the Battistini et al. (1980, 1987) W1/4 morphological parameter, that nicely relates to the cluster core radius through a fitting King profile (see Battistini et al., 1982 for further discussion).
A Kolmogorov-Smirnov test on the data distribution of the left panels of Fig. 3 indicates, at a confidence level better than 99.99%, that Sample “A” BLCCs differ from the remaining fraction of M31 clusters under all the considered aspects. Compared to the GC general distribution, BLCCs are intrinsically fainter, morphologically less concentrated, and with a shallower Balmer jump.
The most striking feature, however, is the intensity of the H absorption line, that is much stronger in BLCCs and essentially out of the range covered by ordinary globulars. This is strongly suggestive of young ages, as we will discuss in better detail in the next sections.
2.3 A different (and complementary) selection: the H index
The claimed H enhancement for BLCC candidates opens our analysis to a complementary selection criterion that, relying on this narrow-band spectrophotometric index, basically overcomes any problem dealing with the (poorly known) reddening correction for M31 GCs. The peculiar strength of H absorption in the spectra of several M31 GCs is a well known feature, discussed since long ago by Burstein et al. (1984), Tripicco (1989), Buzzoni et al. (1994), Lee et al. (2000), Peterson et al. (2003), and Schiavon et al. (2004), among others. Since homogeneous H values are available for most of M31 clusters from the Perrett et al. (2002) database, one could self-consistently rely on this parameter for a more effective diagnostic of BLCCs.
Similar to the color-selected BLCC sample, on the basis of the observed distribution of Fig. 3, we could try a new sample selection picking up BLCCs among those objects with a Lick index H Å(see Fig. 7 and Fig. 8, below). According to this different criterion, a larger number of clusters (51 in total, with 25 objects in common with the color-selected Sample “A”) will be included in our bona fide BLCC dataset. This will be our Sample “B”, as reported in Table 1 and labelled accordingly in column 12.
Among the 45 objects in Table 1 with complete and H photometry, only one Sample “A” cluster should not be comprised in the H-selected Sample “B” (this is B206-D048, with and H Å), while 19 Sample “B” clusters are too red in to be included in Sample “A” (thus confirming the presence of a possibly important fraction of strongly reddened young clusters in the M31 GC population).
The right panels of Fig. 3 complete the comparison between Sample “A” and “B” properties in the different parameter domain. The substantial analogy of the two plots and the sharper characterization of the bona fide BLCC candidates in the H-selected sample makes the latter spectroscopic selection much more safe and efficient in identifying the same kind of clusters selected according to the color criterion alone.
2.4 The final adopted BLCC samples
From the previous arguments, from now on we will adopt the two samples defined above and analyse Sample “A” and “B” objects in parallel. Full information for these 67 clusters is summarized in Table 1. In particular, photometry and positional data in the table are from the BRC (unless otherwise stated), [Fe/H], radial velocity and spectroscopic indices H and are from Perrett et al. (2002) (the latter ones, converted according to Fig. 4), the morphological parameter W1/4 is from Buonanno et al. (1982) and Battistini et al. (1987), while kinematic residuals are from Morrison et al. (2004).
As we already stressed before, a color selection like for Sample “A” better favours a plain observational approach (90% of the objects in Table 1 has a measured , while for only 78% H is provided from spectroscopy), although it is prone to any uncertainty in the reddening correction; on the other hand, H selection, such as in Sample “B”, likely provides a more confident and physical BLCC selection, but suffers from more difficult observing constraints. Quite importantly, however, we will show that, disregarding any preferred selection criterion, the same conclusions hold for both samples.
As a final remark to our sample selection, we should also note that a number of other BLCC candidates (confirmed or not) have been picked up by various authors based on different observations and procedures. For the sake of completeness, we have carried out an exhaustive search in the M31 literature assembling a coarser set of reportedly “young” objects, listing our results in Table 2 (21 confirmed GCs) and Table 3 (69 GC candidates to be confirmed), together with a note to the corresponding reference studies.777Data sources for Table 2 and 3 entries are the same as for Table 1 unless explicitely reported. Note, of course, that for Table 3 targets one would require a clear-cut spectroscopic check due to a possibly high contamination by spurious objects.
In the present analysis, however, we will restrain only to the bona fide samples (i.e. Table 1 data), postponing to a future paper a complete review of each individual object.


3 Dynamics and distinctive physical properties of BLCCs
After a thorough analysis of the positional and kinematical properties of M31 GCs, based on the Perrett et al. (2002) data, Morrison et al. (2004) concluded that the GCs in this galaxy belong to two kinematical components: “…a thin, rapidly rotating disc, and a higher velocity dispersion component whose properties resemble that of the Bulge of M31.” According to these authors, membership to one of the two dynamical components is assessed for each cluster on the basis of its residual velocity with respect to a disc model, picking up disc clusters among those with residual (in normalized units, see Morrison et al., 2004). The claimed probability of mis-classification with this procedure turns to be about 30%.


3.1 The Morrison et al. (2004) framework and the spatial and kinematic properties of BLCCs
In Fig. 5 we compare the spatial distribution (in the X and Y projected distances along the major and minor axes, respectively) and the vs. X distribution of Sample “A” (left panels) and “B” (right panels) BLCC candidates with the remaining fraction of “ordinary” M31 globulars. The thin plot of points in the X vs. Y panels mainly maps the brightest AGB and Carbon stars of M31, from the 2MASS Point Sources Catalogue (Cutri et al., 2003),888The 2MASS sources with color and magnitude constraints such as and have been selected to better tune on M31 stellar population. and gives therefore a neat picture of the outermost structure of galaxy disc (van den Bergh, 2000; Hodge, 1992), allowing us to appreciate in some detail the overplotted GC distribution.
It is evident from the figure that ordinary clusters (upper panels) are uniformly distributed all over the apparent body of M31, up to distances of ( kpc) from the galaxy center, closely tracing the smooth luminosity profile of M31. In addition, most of the bulge clusters show clear sign of coherent rotation in the vs. plane, as a part of the rotationally supported structure of the galaxy (Morrison et al., 2004). However, the large scatter around the overplotted rotation curve (taken from van den Bergh, 2000, see his Fig. 3.10), indicates that pressure support has a significant role in the overall kinematics of the sample (see, however, Morrison et al., 2004 for a deeper analysis of these clusters).
On the contrary, BLCCs seem to avoid the inner regions of the galaxy (see lower panels in Fig. 5) and appear well projected onto the outer disc with a strong correlation with the underlying spiral substructures. Also the velocity pattern quite well traces the velocity curve of the disc.
Our conclusion, therefore, is that both color-selected and H-selected BLCCs belong to the cold thin disc of M31, in agreement with previous results of Beasley et al. (2004) and Burstein et al. (2004), that were limited, however, to a much smaller subset of clusters.
To further clarify this issue, in the upper panels of Fig. 6 we plotted the Morrison et al. (2004) residuals (taken from Table 2 therein), singling out our bona fide BLCCs. It is quite evident from the plots that BLCCs stand out naturally as a very low- family. Almost the whole BLCC population (independent of the adopted selection), in fact, matches the Morrison et al. (2004) disc-membership criterion, and only a few such clusters exceed . This feature is summarized also in the lower panels of Fig. 6, where the shaded histograms give the residual distributions of BLCCs compared to the whole sample of “ordinary” GCs. Complementing the Morrison et al. (2004) results, we can conclude that
both color- and H-selected BLCCs can effectively comprise a significant fraction of “disc clusters”, being natural tracers of the cold thin disc subsystem of M31 (Morrison et al., 2004, but see also Burstein et al., 2004).
BLCCs appear to constitute a separate family for what concerns a number of non-kinematical properties like, for instance, the absolute magnitudes, the H and indices (at least), and the structural parameters.

3.2 The H and indices as age tracers
In a quite common view, a blue integrated color for a cluster is actually an indication of a young age as its integrated color is dominated by the bright blue stars at the MSTO point. On this basis, even the early studies of the M31 clusters (see e.g. van den Bergh, 1967, 1969) immediately noticed that most of the blue cluster candidates should be young. The combined information provided by H and the Balmer jump, , allow in principle to tackle the problem of dating BLCCs on finer detail; both indices, in fact, are contributed by the warmer stellar component in a simple stellar population (SSP), and can selectively probe the MSTO temperature location (Buzzoni, 1995a, b), leading therefore to an indirect estimate of age in a stellar aggregate.
Note that, for its photometric characteristics, the index recalls, to some extent, the broad-band U-B color, but its narrower wavelength baseline makes the Brodie & Hanes (1986) index much less sensitive to the reddening and therefore a better tracer of the intrinsic properties of a stellar cluster.999The Brodie & Hanes (1986) index is defined in a magnitude scale as , where and are the luminosity densities (per unit wavelength) in two 200 Å wide bands centered at 3900 and 4100 Å, respectively. This has to be compared with the Johnson U and B bands, centered respectively at 3600 and 4400 Å. According to Scheffler’s (1982) compilation, the expected color excess can be computed as and .
Figure 7 will be our reference plot to summarize the main features of a H vs. diagram, from the theoretical point of view. In the figure we reported the expected locus for main sequence stars of different temperature, up to K and their inferred spectral type, according to the Johnson (1966) calibration, as labeled.
Our calculations rely on the new Bluered theoretical library of stellar SEDs (Bertone, 2001; Bertone et al., 2003), from which we extracted the grid of model atmospheres with and 5, and [Fe/H] = –2.0, –1.0 and solar. The vanishing sensitivity of both spectral indices to the contribution of late-type stars makes the H vs. information nearly independent of the exact post-MS details of the c-m diagram, as far as we compare with the GC data. This eases a very immediate and straightforward comparison of the theoretical stellar locus with the integrated indices of BLCCs, providing a first effective constraint to age, through a MSTO calibration linking (see, e.g. Buzzoni, 2002).
In a more elaborated scheme relying on SSP models, however, one should also account for the supplementary contribution of blue HB stars, that are expected to play a role at some stage of late evolution of low-mass stars modulating the integrated SED of old stellar populations, typically beyond 10 Gyr. A more accurate prediction of the integrated output for SSPs of different metallicity and HB morphology is reported in the figure, according to the Buzzoni (1989) population synthesis models.
The effect of HB morphology is sketched for the 15 Gyr SSP models mainly resulting in a sensible enhancement of the H strength. It is clear, however, that in no cases the late evolutionary scenario could account for very strong H-lined clusters (i.e. H Å), where a prevailing contribution of F-type stars calls for a genuinely blue MSTO, and therefore for a young age, certainly less than a few Gyrs.

The distribution of M31 GCs in the H vs. plane is displayed in Fig. 8. Big solid dots are the 21 Sample “A” BLCCs from Table 1 with available H and indices (by definition, Sample “B” comprises all the 40 solid and open dots above the H Å threshold, as indicated in the figure). The MW GC data from Brodie & Huchra (1990) (solid triangles) are also reported for comparison. The stellar loci of Fig. 7 (only those for , and different metallicity, for the sake of clarity) have also been overplotted, together with the SSP locus for different age (and a red HB morphology), according to Buzzoni (1989).
It is evident from the figure that, while the bulk of ordinary GCs (including the MW globulars) has spectral properties consistent with an age of several Gyrs, the BLCCs indices are clearly dominated by a younger stellar component of A-F stars of moderately high metallicity (mostly solar or slightly sub-solar). This places a confident upper limit to BLCC age at Gyr. Note also (Fig. 8) that only 4 on 40 BLCCs lie on the branch of the theoretical stellar loci typical of ages lower than Myr (), while the bulk of the population is consistent with ages larger than Myr.
3.2.1 The color as an alternative to the index
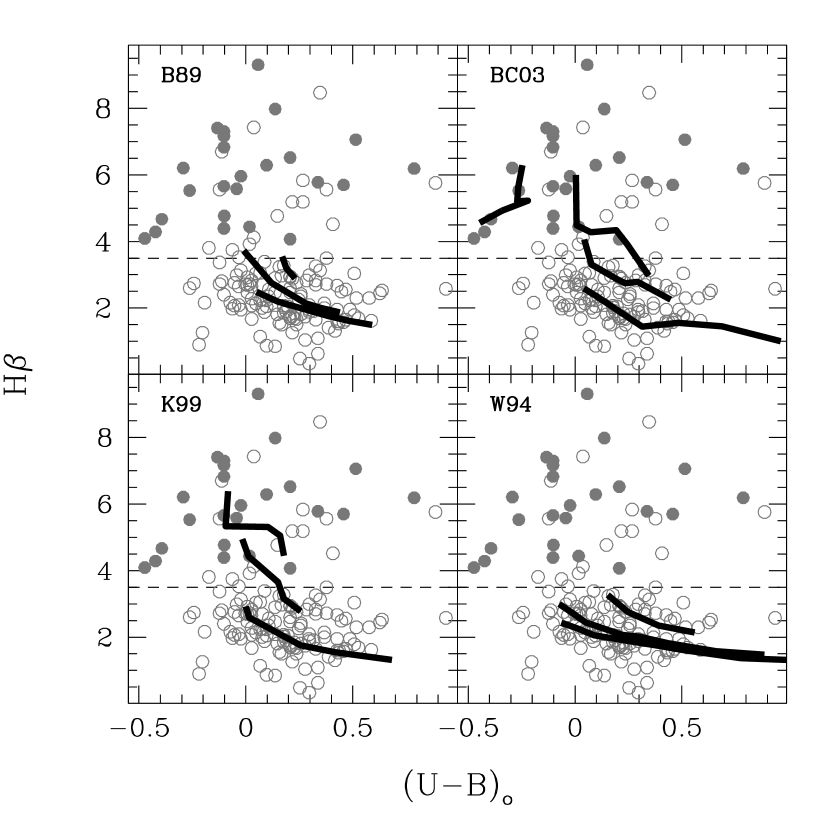
As we have been commenting in previous section, a more standard assessment of the BLCC distribution with respect to the overall GC population in M31 can be carried out relying on the color. For its nature, this choice would allow a more comfortable match with the theoretical output of population synthesis models, and certainly ease the inclusion of a larger GC database with available data, although observations are obviously more critically plagued by reddening uncertainty (cf. footnote 9).
In Fig. 9 the M31 (dereddened) data are compared with the expected SSP evolution according to four different population synthesis codes, namely Buzzoni (1989, and further Web updates), Worthey (1994), Kurth et al. (1999), and Bruzual & Charlot (2003). Again, models agree in the overall classification scheme, with the age of H-poor GCs fully consistent with old (i.e. Gyr) evolutionary scenarios and BLCCs better matched by young ( Gyr) SSPs.101010In this framework, the peculiar case of B206-D048, i.e. the only Sample “A” cluster not comprised in the BLCC H selection (see Sec. 2.3), might be noticing an old and very metal-poor composing stellar population. This interesting cluster does not appear in Fig. 8 and 9 as it lacks and indices (see Table 1).
The emerging evidence, from the combined analysis of the BLCC age range (Fig. 8 and 9), coupled with the kinematical information of Fig. 5 leads eventually to the important conclusion that over 25% of the Perrett et al. (2002) sample (that is at least a 15% of the whole sample of confirmed M31 clusters) consists of young BLCCs, located in the outskirts of the thin disc of M31 and sharing the kinematic properties of this galactic component. This global evidence is quite new and points to the existence of a significant difference between the M31 and MW globular cluster systems, which may have deep implications on the understanding of formation and evolution of the two parent galaxies.
3.3 Metallicity: BLCCs might be not so metal-poor as claimed
Another important issue in the Morrison et al. (2004) discussion concerns the claimed similarity of “disc” and “bulge” GC metallicity that, like in the MW, should be regarded as a striking sign of coevality for the whole GC population in M31. In fact, if our bona fide BLCCs were mostly metal-poor, as apparently deduced from the metallicity values reported by Perrett et al. (2002), one would be left with the embarrassing scenario where the vast majority of the most metal-poor clusters in M31 should be young and likely members of the thin-disc galaxy subsystem. Though not impossible in principle, this conclusion deserves however a deeper check.
The Morrison et al. (2004) metallicity scale comes from the Perrett et al. (2002) [Fe/H] estimates, relying on the empirical calibration of three narrow-band Lick indices (namely, the G-band, Mgb and Fe5335) vs. a coarse set of M31 GCs with available [Fe/H] determination from the literature. Given the prevailing contribution of old GC in this sample, the Perrett et al. (2002) calibration actually introduces a subtly circular bias in the inferred value of [Fe/H] for BLCCs due to the well recognized age-metallicity degeneracy (Renzini & Buzzoni, 1986), that makes young metal-rich clusters to resemble old metal-poor ones. This is shown in the three panels of Fig. 10, where we plotted the [Fe/H] difference as inferred from the Lick index determinations for each individual cluster.

From the figure one can immediately recognize a systematic bias induced by the [Fe/H] estimates from the G-band. As a matter of fact, while the metallicity scale, as derived from the Fe5335 and Mgb indices, basically agrees in average (see middle panel in Fig. 10), for the BLCCs (solid dots in the plots) the G-band line strength tends to yield a significantly lower (roughly dex) value of [Fe/H]. This systematic trend especially affects BLCCs, whose low age mimics the effect of metal deficiency.
In a SSP, this CH-molecular feature maximizes its sensitivity to the coolest stars at the tip of the Asymptotic (AGB) and Red giant branches (RGB) (Gorgas et al., 1993; Burstein et al., 1984), and is therefore a mixed age/metallicity indicator, through a composite and complex dependence on the AGB morphology. Conversely, both the Mg and Fe indices are better sensitive to the bulk of stars in the RGB, via chemical opacity, and more confidently trace SSP metallicity (Buzzoni, 1995a, b).
As a further argument, we note that even the observed morphology of the Williams & Hodge (2001a) c-m diagrams for the four BLCCs observed so far with HST seem to indicate a metallicity in the range . This also basically agrees with our “first-look” estimate of [Fe/H] from Fig. 8, where the BLCCs H vs. distribution suggests a moderately enhanced metallicity (i.e. dex).

3.4 BLCCs: blue globulars or massive open clusters?
The actual classification of BLCCs as ”young globular clusters” or ”massive open clusters” is somehow a question of semantics. The real point that is worth to investigate is if these clusters have a counterpart in our own Galaxy, e.g. if clusters of similar age and luminosity do exist in the Milky Way. While the luminosity range spanned by BLCCs is comprised within that of ordinary globular clusters, the age distribution of present-day MW globulars is obviously not consistent with the young age of BLCCs. On the other hand, Galactic Open Clusters (OC) are comparably young but they appear less luminous on average than BLCCs.
The Luminosity Functions (LFs) of the Sample B clusters and of the Galactic OCs (data drawn from the WEBDA database Mermilliod, 1995, see http://obswww.unige.ch/webda) are compared in the left panel of Fig. 11. The plot shows that Galactic OCs with ages similar to BLCCs are sistematically fainter, the two histograms barely overlaps. The only Galactic OCs that reach the luminosity range covered by BLCCs are younger than 30 Myr (e.g. they are clusters whose luminosity budget is dominated by a few massive stars, much different f.i. from the BLCCs studied by Williams & Hodge (2001a)), while Fig. 7 and Fig. 8 above indicates that per cent of BLCCs is likely older than Gyr. Hence, regardless of the quite high incompleteness that probably still affects the LF of M31 clusters for , the Milky Way lacks OCs as luminous as BLCCs in the proper age range (200 Myr age 2 Gyr).
Conversely, the right panel of Fig. 11 show that the luminosity range spanned by M31 BLCCs is very similar to that covered by LMC globular clusters of similar age (data from van den Bergh, 1981). The above direct evidences lead to conclude that there is no Galactic counterpart to the young massive M31 clusters studied here; they are much younger than present-day Galactic globulars and they are much more luminous than present-day Galactic OCs of similar age. On the other hand BLCC counterparts are quite common in the LMC. Obviously, this conclusion rests on the age estimates of BLCCs as derived from Fig. 8, above. The involved uncertaintes leave (formally) open the possibility that several BLCCs have ages Myr. If so, they should be interpreted as the counterparts of young open clusters of the Milky Way. The availability of a deep c-m diagram is probably the only observational test that can eventually establish the real nature of these objects.
It remains to be explored how BLCCs would appear in the future, e.g., in particular if they will look like classical globulars when they will become comparably old. If we assume BLCCs to consist of plain SSPs, then one should expect their luminosity to fade with time, as far as the composing stellar population becomes older and photometrically dominated by low-mass stars. In particular, for a SSP of roughly solar metallicity and Salpeter IMF, evolutionary population synthesis models predict a quite tuned luminosity change such as over a wide range of age (e.g. Tinsley & Gunn, 1976; Buzzoni, 1995a). According to the assumed age of present-day BLCCs, then one could infer the expected luminosity of these clusters at Gyr and more consistently compare with the observed luminosity function of old MW GCs. The results of this illustrative excercise are summarized in Fig. 12; it is evident from the figure that, in the more likely case of a current age in the range yrs, BLCCs would end up at yrs populating the low-luminosity (and low-mass) tail of current MW GC distribution. On the contrary, in the more extreme (and quite unlikely) case of a current age of only a few yrs we would be left at 10 Gyr with extremely faint BLCCs, certainly out of range of the typical MW GCs. Finally, if nowadays BLCCs are already evolved systems (i.e. a few Gyr or older), then at Gyr their expected luminosity will not change so much and their distribution would maintain them fully consistent with the bulk of both M31 open clusters and MW GCs. A fair assessment of the present-day age distribution of this kind of clusters is therefore a mandatory step to consistently locate them in the appropriate evolutionary framework.

4 Discussion and Summary
Till a few years ago, the M31 cluster system has been commonly viewed as an almost identical (though much larger) analog of the MW GC system, apart from small differences in average metallicity (M31 about 0.2 dex richer than MW) and controversial peculiarities in various spectral indices (Burstein et al., 1984, 2004, and references therein). Recent wide-field imaging (Ibata et al., 2004, and references therein), together with high precision spectroscopy (Perrett et al., 2002; Burstein et al., 2004), have led however to a more detailed recognition and investigation of M31 substructures, including its GC system, leaving space to the idea that the Andromeda and MW cluster systems are actually more different than conceived so far.
In particular, Morrison et al. (2004) have put forward a new scenario suggesting the existence in M31 of quite sizeable population of GCs associated to the thin disc and claimed to be old and metal poor. The natural consequence of such an evidence, if confirmed, is that the thin disc was formed when its oldest metal-poor globulars were in place and that no significant perturbation affected M31, and in particular its thin disc, since then. An in-depth analysis of the claimed thin-disc GC members, and in particular of the metal-poor ones, may thus greatly help clarifying this important dynamical issue.
The present study has tackled the problem from a different point of view, i.e. by building up a revised global sample of M31 GCs with intrinsically bluer color than the MW counterparts and assessing if these bona fide BLCCs (Sample “A” in our analysis) would further discriminate with respect to “normal” M31 and MW globulars as far as other intrinsic properties (like e.g. absolute magnitude, metallicity, spectral indices, structural parameters, and age) and kinematic behaviour are concerned. On the basis of this comparison, a tuned and more physical selection based on the spectral index has been proposed (Sample “B” in previous discussion). Quite interestingly, both color- and -selected samples led to fully consistent conclusions of our analysis.
It has been possible to convincingly demonstrate here that both samples consist of moderately young ( Gyr) stellar systems, not so metal poor as previously estimated, and basically sharing the thin disc kinematics (see also Beasley et al., 2004, on this line). Since (a) essentially all the blue clusters in the thin disc subsystem as defined by Morrison et al. (2004) are likely young and (b) the metallicity values adopted by these authors are sistematically underestimated (at least for most BLCCs, see Sect. 3.3), serious doubts are casted on the actual presence of metal-poor (and old) clusters in the thin disc of M31 as claimed by Morrison et al.111111While the present paper was in the peer review phase, a preprint was posted (Puzia et al., 2005), which also develops some of the arguments discussed here. This argument greatly weakens the possible contrast with the Brown et al. (2003) hypothesis of an equal-mass merging event suffered by M31 6-8 Gyr ago.
Given the evidences presented so far and within the framework discussed above, one might naturally ask whether also the “red” clusters claimed to be member of the M31 thin disc subsystem actually are old and metal-poor (as at least some of them seem to appear) or whether they could display some spread in age and/or metal abundance. The answer to such a question is of paramount importance to settle in finer detail the mechanisms and formation timescale for the M31 thin disc and for the global evolution of the galaxy system as a whole.
References
- Abadi et al. (2003) Abadi, M. G., Navarro, J. F., Steinmetz, M., Eke, V. R. 2003, ApJ, 597, 21
- Barmby & Huchra (2001) Barmby, P., Huchra, J.P. 2001, AJ, 122, 2458
- Barmby (2003) Barmby, P. 2003, in Extragalactic Globular Cluster Systems, ESO Workshop, ed. M. Kissler-Patig, Springer-Verlag, p.143
- Barmby et al. (2000) Barmby, P., Huchra, J.P., Brodie, J.P., Forbes, D.A., Schroder, L.L., Grillmair, C.J. 2000, AJ, 119, 727
- Battistini et al. (1980) Battistini, P.L., Bonoli, F., Braccesi, A., Fusi Pecci, F., Malagnini, M.L., Marano, B. 1980, A&AS, 42, 357
- Battistini et al. (1982) Battistini, P.L., Bonoli, F., Buonanno, R., Corsi, C.E., Fusi Pecci, F. 1982, A&A, 113, 39
- Battistini et al. (1987) Battistini, P.L., Bonoli, F., Braccesi, A., Federici, L., Fusi Pecci, F., Marano, B., Borngren F. 1987, A&AS, 67, 447
- Beasley et al. (2004) Beasley, M.A., Brodie, J.P., Strader, J., et al. 2004, AJ, submitted, (see also: astro-ph/0405009)
- Bertone (2001) Bertone, E. 2001, PhD Thesis, Milan University, Italy
- Bertone et al. (2003) Bertone, E., Rodriguez-Merino, L.H., Chavez, M., Buzzoni, A. 2003, in Galaxy evolution: theory and observations, eds. V. Avila-Reese, C. Firmani, C. Frenk, & C. Allen, Rev. Mex. Astron. Astrophys. Conf. Series, 17, 91
- Bohlin et al. (1988) Bohlin, R.C., Cornett, R.H., Hill, J.K., Hill, R.S., Stecher, T.P. 1988, ApJ, 334, 657
- Bohlin et al. (1993) Bohlin, R.C., Deutsch, E.W., McQuade, K.A., et al. 1993, ApJ, 417, 127
- Brodie & Hanes (1986) Brodie, J.P., Hanes, D.A. 1986, ApJ, 300, 258
- Brodie & Huchra (1990) Brodie, J.P., Huchra, J.P. 1990, ApJ, 362, 503
- Brown et al. (2003) Brown, T.M., Ferguson, H.C., Smith, E., Kimble, R.A., Sweigart, A.V., Renzini, A., Rich, R.M., VandenBerg, D.A. 2003, ApJ, 592, L17
- Bruzual & Charlot (2003) Bruzual, G., Charlot, S. 2003, MNRAS, 344, 1000
- Buonanno et al. (1982) Buonanno, R., Corsi, C.E., Battistini, P., Bonoli, F., Fusi Pecci, F. 1982, A&AS, 47, 451
- Burstein et al. (1984) Burstein, D., Faber, S.M., Gaskell, C.M., Krumm, N. 1984, ApJ, 287, 586
- Burstein et al. (2004) Burstein, D., Li, Y., Freeman, K.C., et al. 2004, ApJ, in press, (see also: astro-ph/0406564)
- Buzzoni (1989) Buzzoni A. 1989, ApJS, 71, 817 (see also: http://www.bo.astro.it/eps/home.html for the latest model update)
- Buzzoni (1995a) Buzzoni, A. 1995a, ApJS, 98, 69
- Buzzoni (1995b) Buzzoni, A. 1995b in Fresh views of elliptical galaxies, ASP Conf. Ser., Vol. 86, eds. A. Buzzoni, A. Renzini & A. Serrano (San Francisco: ASP), p. 189
- Buzzoni (2002) Buzzoni, A. 2002, AJ, 123, 1188
- Buzzoni et al. (1994) Buzzoni, A., Mantegazza, L., Gariboldi, G. 1994, AJ, 107, 513
- Chandar et al. (1999) Chandar, R., Bianchi, L., Ford, H.C. 1999, ApJS, 122, 431
- Cowley & Burstein (1988) Cowley, A.P., Burstein, D. 1988, AJ, 95, 1071
- Crampton et al. (1985) Crampton, D., Cowley, A.P., Shade, D., Chayer, P. 1985, ApJ, 288, 494
-
Cutri et al. (2003)
Cutri et al. 2003, Explanatory Supplement to the 2MASS All Sky Data
Release (see also:
http://www.ipac.caltech.edu/2mass/
releases/allsky/doc/explsup.html) - Elson & Fall (1985) Elson, R.A.W., Fall, S.M. 1985, PASP, 97,692
- Elson & Walterbos (1988) Elson, R.A.W., Walterbos, R. A. M. 1988, ApJ, 333, 594
- Faber et al. (1985) Faber, S. M., Friel, E. D., Burstein, D., Gaskell, C. M. 1985, ApJS, 57, 711
- Freedman & Madore (1990) Freedman, W.L., Madore B.F. 1990, ApJ, 365, 186
- Galleti et al. (2004) Galleti, S., Federici, L., Bellazzini, M., Fusi Pecci, F., Macrina, S. 2004, A&A, 416, 917
- Gorgas et al. (1993) Gorgas, J., Faber, S.M., Burstein, D., González, J.J., Courteau, S., Prosser, C. 1993, ApJS, 86, 153
-
Harris (1996)
Harris, W.E. 1996, AJ, 112, 1487 (see also:
http://physwww.physics.mcmaster.ca/
harris/mwgc.dat for catalog update) - Harris (2001) Harris W.E. 2001, in Star clusters, Saas-Fee Advanced Course 28, Lecture Notes 1998, eds. L. Labhardt and B. Biggeli, Berlin, Springer, p.223
- Hodge (1979) Hodge, P.W. 1979, AJ, 84, 744
- Hodge (1992) Hodge, P.W. 1992, The Andromeda galaxy, Astrophys. and Space Science lib. vol. 176, Dordrecht, Kluwer
- Hodge et al. (1987) Hodge, P.W., Mateo, M., Lee, M.G., Geisler, D. 1987, PASP, 99, 173
- Ibata et al. (2004) Ibata, R., Chapman, S., Ferguson, A.M.N., et al. 2004, MNRAS, 351, 117
- Jiang et al. (2003) Jiang, L., Ma, J., Zhou, X., Chen, J., Wu, H., Jiang, Z. 2003, AJ, 125, 727
- Johnson (1966) Johnson, H.L. 1966, ARA&A, 4, 193
- Kent (1989) Kent, S.M. 1989, AJ, 97, 1614
- King & Lupton (1991) King, J.R., Lupton, R.H. 1991, in The formation and evolution of star clusters, p. 575
- Kurth et al. (1999) Kurth, O. M., Fritze-v. Alvensleben, U., Fricke, K. J. 1999, A&AS, 138, 19
- Lee et al. (2000) Lee, H-C., Yoon, S-J.,Lee, Y-W. 2000, AJ, 120, 998
- McClure & Racine (1969) McClure, R.D., Racine, R. 1969, AJ, 74, 1000
- Mermilliod (1995) Mermilliod J.-C.1995, in The Origins, Evolution, and Destinies of Binary Stars in Clusters, E.F. Milone and J.-C. Mermilliod Eds., ASP, S. Francisco, ASP Conf. Ser. 90, 475
- Morrison et al. (2004) Morrison, H., Harding, P., Perrett, K.M., Hurley-Keller, D. 2004, ApJ, 603, 87
- Perrett et al. (2002) Perrett, K.M., Bridges, T.J, Hanes, D.A., et al. 2002, AJ, 123, 2490
- Peterson et al. (2003) Peterson, R.C., Carney, B.W., Dorman, B., Green, E.M., Landsman, W., Liebert, J., O’Connell, R.W., Rood, R.T. 2003, ApJ, 588, 299
- Puzia et al. (2002) Puzia, T.H., Saglia, R.P., Kissler-Patig, M., Maraston, C., Greggio, L., Renzini, A., Ortolani, S. 2002, A&A, 395, 45
- Puzia et al. (2005) Puzia, T.H., Perrett, K.M., Bridges, T.J., 2005, A&A, in press (see also astro-ph/0501556)
- Renzini & Buzzoni (1986) Renzini, A., Buzzoni, A. 1986, in Spectral evolution of galaxies, eds. C. Chiosi & A. Renzini, Dordrecht, D. Reidel Publishing Co., p. 195
- Rich (2003) Rich, R.M. 2003 in New horizons in globular cluster astronomy, eds. G.Piotto, G. Meylan, S.G. Djorgovski and M. Riello, ASP Conf. Ser. Vol. 296, p. 533
- Sargent et al. (1977) Sargent, W.L.W., Kowal, C.T., Hartwick, F.D.A., van der Bergh S. 1977, AJ, 82, 947
- Scheffler (1982) Scheffler, H. 1982, in Landolt-Borstein ed., Group 6, Vol. 2, Astronomy & Astrophysics. Springer, Berlin, p. 46
- Schiavon et al. (2004) Schiavon, R.P., Rose, J.A., Courteau, S., MacArthur, L. 2004, (see also: astro-ph/0404592)
- Searle (1978) Searle, L. 1978, NATO Advanced Study Institute on Globular Clusters, Cambridge University
- Sharov et al. (1995) Sharov, A.F., Lyutyi, V.M., Esipov, V.F. 1995, PAstL, 21,240
- Spinrad & Schweizer (1972) Spinrad, H., Schweizer, F. 1972, ApJ, 171, 403
- Tinsley & Gunn (1976) Tinsley, B.M., Gunn, J.E. 1976, ApJ, 203, 52
- Tripicco (1989) Tripicco, M.J. 1989, AJ, 97, 735
- van den Bergh (1967) van den Bergh, S. 1967, AJ, 72, 70
- van den Bergh (1969) van den Bergh, S. 1969, ApJS, 19, 145
- van den Bergh (1981) van den Bergh, S. 1981, A&AS, 46, 79
- van den Bergh (1991) van den Bergh, S. 1991, ApJ, 369, 1
- van den Bergh (2000) van den Bergh S. 2000, The Galaxies of the Local Group, Cambridge Astrophysics Ser. vol. 35, Cambridge, Cambridge Univ. Press
- Vetenik (1962) Vetenik, M. 1962, Bull. Astron. Inst. Czechoslovakia, 13, 180
- Williams & Hodge (2001a) Williams, B.F., Hodge, P.W. 2001a, ApJ, 548, 190
- Williams & Hodge (2001b) Williams, B.F., Hodge, P.W. 2001b, ApJ, 559, 851
- Worthey (1994) Worthey, G. 1994, ApJS, 95, 107
| Name | V | B-V | U-B | H | Vr | X | Y | Sample | References | ||||
|---|---|---|---|---|---|---|---|---|---|---|---|---|---|
| mag | Å | km s-1 | arcmin | arcmin | |||||||||
| B008-G060 | 16.56 | 1.10 | 0.50 | –0.41 0.38 | 0.397 | 3.50 | 4.96 | –319 | 0.70 | –15.34 | 19.95 | B | |
| B028-G088 | 16.86 | 0.88 | –0.05 | –1.87 0.29 | 0.404 | 3.81 | 4.80 | –434 | 0.72 | –23.65 | 2.67 | B | 10 |
| B040-G102 | 17.38 | 0.29 | –0.01 | –0.98 0.48 | 0.137 | 7.41 | 5.32 | –463 | –0.40 | –35.48 | –11.77 | A,B | 1,2,6,7 |
| B043-G106 | 16.96 | 0.28 | –0.14 | –2.42 0.51 | 0.144 | 5.53 | 5.13 | –414 | 0.42 | –33.68 | –11.21 | A,B | 1,2,3,4,5,6,7,8 |
| B047-G111 | 17.51 | 0.72 | 0.09 | –1.62 0.41 | 3.53 | 5.57 | –291 | –1.02 | 13.80 | 24.58 | B | ||
| B049-G112 | 17.56 | 0.52 | 0.18 | –2.14 0.55 | 9.31 | 5.83 | –481 | –0.39 | –27.56 | –7.27 | A,B | 7 | |
| B057-G118 | 17.64 | 0.69 | –2.12 0.32 | 0.289 | 5.56 | 4.98 | –437 | 0.27 | –25.00 | –7.02 | B | ||
| B066-G128 | 17.42 | 0.36 | –0.27 | –2.10 0.35 | 0.061 | 4.67 | 4.95 | –389 | 0.70 | –29.61 | –13.02 | A,B | 3,5,6,7 |
| B069-G132 | 18.16 | 0.44 | 0.02 | –1.35 0.43 | 0.338 | 7.17 | 5.72 | –295 | –0.27 | 3.44 | 11.91 | A,B | 7,10 |
| B074-G135 | 16.65 | 0.75 | 0.14 | –1.88 0.06 | 0.346 | 3.92 | 5.15 | –435 | –5.61 | 17.38 | 22.06 | B | |
| B081-G142 | 16.80 | 0.54 | 0.26 | –1.74 0.40 | 0.352 | 7.98 | 4.99 | –430 | –0.47 | –25.32 | –12.23 | A,B | 7 |
| B083-G146 | 17.09 | 0.76 | 0.06 | –1.18 0.44 | 0.047 | 3.75 | 5.75 | –367 | –4.15 | 19.90 | 22.04 | B | |
| B091-G151 | 17.56 | 0.41 | 0.02 | –1.80 0.61 | 0.269 | 7.30 | 5.02 | –290 | –0.16 | 2.08 | 7.01 | A,B | 4,7,10 |
| B114-G175 | 17.28 | 0.42 | 0.33 | 4.90 | –3.87 | –0.58 | A | 10 | |||||
| B160-G214 | 18.02 | 0.55 | 0.05 | –1.17 1.25 | 4.78 | –354 | –0.46 | –7.98 | –13.45 | A | 10 | ||
| B170-G221 | 17.39 | 0.98 | 0.53 | –0.54 0.24 | 4.52 | 4.63 | –295 | 1.54 | –15.59 | –21.43 | B | ||
| B210-M11 | 17.57 | 0.52 | 0.02 | –1.90 0.32 | 0.162 | 6.83 | 4.98 | –265 | 0.11 | 7.69 | –12.70 | A,B | 7,10,12 |
| B216-G267 | 17.25 | 0.20 | 0.02 | –1.87 0.39 | 0.177 | 5.66 | 5.72 | –84 | –0.10 | 26.91 | 0.92 | A,B | 2,3,5,7,8,10,12 |
| B222-G277 | 17.43 | 0.68 | 0.47 | –0.93 0.95 | 0.349 | 8.47 | 6.91 | –311 | –1.07 | 10.14 | –16.17 | B | 10,11 |
| B223-G278 | 17.81 | 0.15 | 0.14 | –1.13 0.51 | 0.297 | 4.44 | 5.65 | –101 | –0.01 | 26.39 | –3.81 | A,B | 7,10,12 |
| B237-G299 | 17.10 | 0.77 | 0.16 | –2.09 0.28 | 0.167 | 7.43 | 5.08 | –86 | 4.54 | 21.81 | –17.48 | B | |
| B281-G288 | 17.67 | 0.84 | 0.50 | –0.87 0.52 | 0.364 | 5.56 | 6.20 | –203 | 0.76 | 16.85 | –15.09 | B | |
| B295-G014 | 16.75 | 0.71 | 0.27 | –1.71 0.15 | 4.77 | 4.92 | –423 | –85.95 | 19.69 | B | 8 | ||
| B303-G026 | 18.22 | 0.24 | 0.46 | –2.09 0.41 | 0.252 | 5.78 | 5.46 | –464 | 1.84 | –65.51 | 5.53 | A,B | 7 |
| B307-G030 | 17.32 | 0.87 | 1.01 | –0.41 0.36 | 5.76 | 6.35 | –407 | 3.02 | –57.96 | 4.58 | B | ||
| B314-G037 | 17.63 | 0.59 | 0.34 | –1.61 0.32 | 0.402 | 5.19 | 6.48 | –485 | 0.51 | –69.94 | –10.77 | B | 3,8,11 |
| B315-G038 | 16.47 | 0.07 | 0.02 | –2.35 0.54 | 0.116 | 4.77 | 5.18 | –559 | –0.18 | –55.65 | –0.83 | A,B | 1,2,3,5,7,8,9,12 |
| B318-G042 | 17.02 | 0.17 | –0.42 | 5.31 | –52.16 | –1.09 | A | 1,2,3,4,5,7,8 | |||||
| B319-G044 | 17.61 | 0.72 | –0.64 | –2.27 0.47 | 0.113 | 5.37 | 5.49 | –535 | 0.21 | –52.03 | –1.54 | B | 1,2,3,5,7,9 |
| B321-G046 | 17.67 | 0.22 | 0.22 | –2.39 0.41 | 0.229 | 6.29 | 5.52 | –518 | –0.05 | –55.54 | –7.17 | A,B | 3,7,8,11,12 |
| B322-G049 | 17.75 | 0.06 | –0.28 | 5.14 | –46.31 | –0.57 | A | 6,7,8,11,12 | |||||
| B327-G053 | 16.58 | 0.32 | –0.35 | –2.33 0.49 | 0.160 | 4.09 | 4.87 | –528 | 0.25 | –47.70 | –3.23 | A,B | 3,4,5,6,7,8,11,12 |
| B331-G057 | 18.19 | 0.25 | 6.31 | 4.76 | 36.35 | A | |||||||
| B342-G094 | 17.73 | 0.30 | 0.64 | –1.62 0.02 | 0.003 | 7.06 | 6.52 | –479 | –0.66 | –40.46 | –12.04 | A,B | 1,2,6,7,9 |
| B354-G186 | 17.81 | 0.13 | 0.69 | 5.45 | 35.36 | 26.68 | A | ||||||
| B355-G193 | 17.76 | 0.53 | 0.02 | –1.62 0.43 | 0.240 | 4.39 | 4.24 | –114 | 5.25 | 34.00 | 24.37 | A,B | |
| B358-G219 | 15.22 | 0.49 | 0.19 | 5.06 | –64.79 | –58.32 | A | ||||||
| B367-G292 | 18.45 | 0.32 | –0.17 | –2.32 0.53 | 0.097 | 6.21 | 5.64 | –152 | –0.58 | 53.03 | 12.32 | A,B | 7 |
| B368-G293 | 17.92 | 0.26 | –0.36 | 5.75 | 41.80 | 3.36 | A | 1,2,3,5,7,9 | |||||
| B374-G306 | 18.31 | 0.44 | 0.33 | –1.90 0.67 | 0.281 | 4.07 | 5.27 | –96 | 0.88 | 41.08 | –10.68 | A,B | 7 |
| B376-G309 | 18.06 | 0.45 | 0.23 | 5.59 | 42.12 | –10.79 | A | 3,5,7,8 | |||||
| B380-G313 | 17.01 | 0.47 | 0.33 | –2.31 0.45 | 0.187 | 6.52 | 6.67 | –13 | 1.14 | 58.47 | –2.07 | A,B | 7,8,11,12 |
| B431-G027 | 17.73 | 0.49 | 0.29 | 5.59 | –59.11 | 9.36 | A | 7 | |||||
| B443-D034 | 18.20 | 0.80 | –0.52 | –2.37 0.46 | 6.72 | 5.40 | –532 | –0.08 | –50.47 | –4.58 | B | ||
| B448-D035 | 17.49 | 0.61 | 0.01 | –2.16 0.19 | 6.70 | 6.54 | –552 | –0.16 | –43.17 | –2.77 | B | 7 | |
| B451-D037 | 18.66 | 0.19 | –2.13 0.43 | 3.50 | 4.40 | –514 | 0.20 | –33.01 | 2.57 | A,B | 7 | ||
| B453-D042 | 17.30 | 0.87 | 0.16 | –2.09 0.53 | 0.234 | 4.12 | 5.27 | –446 | 0.47 | –23.69 | 5.79 | B | |
| B458-D049 | 17.84 | 0.49 | 0.91 | –1.18 0.67 | –0.085 | 6.19 | 5.98 | –521 | –0.83 | –26.50 | –6.22 | A,B | 7 |
| B475-V128 | 17.56 | 0.31 | 0.10 | –2.00 0.14 | 5.96 | 7.24 | –120 | –1.02 | 45.00 | 3.92 | A,B | 7 | |
| B480-V127 | 17.91 | 0.65 | 0.39 | –1.86 0.66 | 0.188 | 5.19 | 4.89 | –135 | –0.50 | 44.30 | –8.38 | B | |
| B483-D085 | 18.46 | 0.27 | 0.08 | –2.96 0.35 | 5.58 | 5.87 | –53 | –0.09 | 58.16 | 0.58 | A,B | 7 | |
| B484-G310 | 18.10 | 0.52 | 0.58 | –1.95 0.59 | 0.110 | 5.70 | 5.45 | –104 | 0.06 | 46.62 | –8.51 | A,B | 7,12 |
| B486-G316 | 17.52 | 0.35 | 0.93 | 5.02 | 9.45 | –41.39 | A | 7 | |||||
| B189D-G047 | –1.19 0.29 | –0.064 | 4.24 | –584 | –0.62 | –45.82 | 0.24 | B | |||||
| VDB0 | 15.28 | 0.23 | –0.37 | –47.41 | –4.31 | A | 3,4,5,6 | ||||||
| NB21-AU5 | 17.86 | 0.31 | –0.88 | 0.85 | A | ||||||||
| NB67-AU13 | 16.14 | 0.48 | –0.03 | –1.43 0.13 | –113 | 1.66 | 1.69 | 3.75 | A | 7 | |||
| NB83 | 16.68 | 0.56 | –0.03 | –1.26 0.16 | –150 | 1.30 | –4.24 | 0.89 | A | ||||
| B006D-D036 | 18.00 | –2.16 0.32 | –0.026 | 5.04 | –522 | 0.51 | –36.31 | 2.25 | B | ||||
| B012D-D039 | 18.40 | –1.22 0.41 | 0.182 | 7.09 | –478 | –0.10 | –26.72 | 6.07 | B | ||||
| B015D-D041 | 17.80 | –1.14 0.30 | 7.32 | –445 | –0.41 | –19.24 | 9.37 | B | |||||
| B111D-D065 | 18.10 | –1.80 0.36 | 0.082 | 5.55 | –130 | –0.81 | 27.38 | 2.27 | B | ||||
| B195D | 15.19 | 0.22 | –0.30 | –1.64 0.19 | 0.166 | 4.29 | –552 | –0.45 | –47.19 | –4.17 | A,B | ||
| B206D-D048 | 19.06 | 0.12 | –2.01 0.99 | 2.53 | –490 | –0.07 | –27.97 | –6.40 | A | ||||
| B257D-D073 | 17.40 | –1.99 0.19 | 0.501 | 5.49 | –114 | –1.25 | 46.00 | 3.87 | B | ||||
| DAO47 | –1.13 0.57 | 0.229 | 4.03 | –490 | –0.35 | –33.09 | –7.67 | B | |||||
| V031 | 17.43 | 0.68 | 0.39 | –1.59 0.06 | 0.497 | 5.84 | –433 | 0.02 | –19.01 | 7.27 | B | 12 |
References. — (1) van den Bergh (1967); (2) Sargent et al. (1977); (3) Elson & Walterbos (1988); (4) Bohlin et al. (1988); (5) King & Lupton (1991); (6) Bohlin et al. (1993); (7) Barmby et al. (2000); (8) Barmby & Huchra (2001); (9) Williams & Hodge (2001a); (10) Jiang et al. (2003), (11) Beasley et al. (2004); (12) Burstein et al. (2004)
| Name | V | B-V | U-B | H | Vr | X | Y | References | ||||
|---|---|---|---|---|---|---|---|---|---|---|---|---|
| mag | Å | km s-1 | arcmin | arcmin | ||||||||
| B015-V204 | 17.79 | 1.41 | –0.35 0.96 | –0.54 | 5.56 | –460 | –0.04 | –26.56 | 7.91 | 10 | ||
| B030-G091 | 17.39 | 1.93 | 0.71 | –0.39 0.36 | 1.62 | 4.69 | –380 | 1.62 | –24.83 | 1.24 | 10 | |
| B090 | 18.80 | –1.39 0.80 | 3.28 | 4.62 | –428 | –0.43 | –13.12 | –4.60 | 10 | |||
| B101-G164 | 16.87 | 0.81 | 0.38 | 4.49 | –8.01 | –2.55 | 10 | |||||
| B102 | 16.58 | 0.62 | –0.12 | –1.57 0.10 | 0.224 | 2.74 | 3.98 | –236 | 0.17 | 12.67 | 13.29 | 7 |
| B117-G176 | 16.34 | 0.65 | 0.45 | –1.33 0.45 | 0.266 | 2.70 | 4.76 | –531 | –2.68 | –16.19 | –10.13 | 8 |
| B146 | 16.95 | 1.49 | –0.54 | 4.86 | 1.51 | –3.23 | 10 | |||||
| B154-G208 | 16.82 | 1.32 | 0.55 | 4.95 | 3.17 | –4.21 | 10 | |||||
| B164-V253 | 17.94 | 1.04 | –0.09 0.40 | 0.559 | 1.48 | 4.74 | –294 | 0.07 | 1.00 | –7.25 | 10 | |
| B197-G247 | 17.63 | 1.08 | 0.19 | –0.43 0.36 | 1.14 | 4.94 | –9 | 1.30 | 18.58 | –1.06 | 10 | |
| B214-G265 | 17.65 | 0.61 | 0.28 | –1.00 0.61 | 3.24 | 4.90 | –258 | –1.26 | 17.19 | –5.53 | 7 | |
| B232-G286 | 15.67 | 0.72 | 0.10 | –1.83 0.14 | 0.242 | 3.13 | 4.73 | –179 | 2.52 | 12.52 | –17.88 | 12 |
| B292-G010 | 16.99 | 0.90 | –0.02 | 5.30 | –58.32 | 47.44 | 11 | |||||
| B311-G033 | 15.44 | 0.96 | 0.14 | –1.96 0.07 | 0.120 | 2.72 | 4.53 | –463 | 2.15 | –57.58 | 1.24 | 12 |
| B324-G051a | 16.91 | 0.66 | 0.79 | 4.87 | 3.10 | 36.44 | 8,11,12 | |||||
| B328-G054 | 17.86 | 0.89 | 0.48 | 5.44 | 3.20 | 35.57 | 7,10 | |||||
| B347-G154 | 16.50 | 0.73 | 0.15 | 5.16 | 27.83 | 26.66 | 8,12 | |||||
| B423 | 17.72 | 0.60 | 0.10 | 6.33 | –47.66 | 31.80 | 7 | |||||
| B468 | 17.79 | 0.70 | 7.52 | –66.43 | –58.30 | 7 | ||||||
| NB16 | 17.55 | 0.66 | –1.36 0.12 | –115 | 1.35 | 1.97 | 4.21 | 8 | ||||
| B150D | 17.55 | 0.61 | –0.04 | –31.77 | 57.17 | 7 |
Note. — a Photometry from Sharov et al. (1995)
References. — (1) van den Bergh (1967); (2) Sargent et al. (1977); (3) Elson & Walterbos (1988); (4) Bohlin et al. (1988); (5) King & Lupton (1991); (6) Bohlin et al. (1993); (7) Barmby et al. (2000); (8) Barmby & Huchra (2001); (9) Williams & Hodge (2001a); (10) Jiang et al. (2003), (11) Beasley et al. (2004); (12) Burstein et al. (2004)
possible BLCCs candidates with
| Name | V | B-V | U-B | X | Y | References |
|---|---|---|---|---|---|---|
| arcmin | arcmin | |||||
| B060-G121 | 16.75 | 0.71 | 0.08 | –14.10 | 0.38 | 7 |
| B070-G133 | 17.07 | 0.54 | 0.19 | –10.83 | 0.56 | |
| B089 | 18.18 | 0.10 | –0.32 | 16.05 | 17.93 | 7 |
| B100-G163 | 17.91 | 0.88 | 0.15 | –22.53 | –13.75 | 7 |
| B108-G167 | 17.47 | 0.89 | 1.01 | –7.30 | –2.49 | 7,10 |
| B145 | 18.10 | 0.32 | 1.48 | –0.95 | –4.82 | 6,7 |
| B150-G203 | 16.80 | 1.10 | 0.39 | 5.97 | –0.87 | 10 |
| B157-G212 | 17.73 | 0.65 | –0.11 | –0.39 | –7.36 | 7 |
| B173-G224 | 18.27 | 0.02 | 10.21 | –2.61 | ||
| B192-G242 | 18.28 | 0.20 | 0.32 | 23.73 | 4.21 | 7,10 |
| B195 | 18.57 | 0.40 | 0.97 | –3.39 | –17.95 | 7 |
| B323 | 17.59 | 0.47 | 0.17 | –51.25 | –4.57 | |
| B330-G056 | 17.72 | 0.95 | 0.09 | 5.33 | 36.93 | 3 |
| B362 | 17.61 | 0.65 | 0.08 | 29.90 | 3.14 | 10 |
| B371-G303 | 17.54 | 0.48 | 0.39 | 40.53 | –7.04 | 7 |
| B414 | 17.98 | 0.50 | 0.08 | 4.58 | 93.72 | |
| B442-D033 | 17.94 | 0.39 | 0.16 | –47.36 | –1.87 | 7 |
| B452-G069 | 17.78 | 0.38 | –0.05 | –45.89 | –7.66 | 7 |
| B460 | 18.35 | 0.54 | –0.23 | –85.52 | –54.13 | |
| B469-G220 | 17.58 | 0.53 | –0.04 | 46.76 | 28.06 | 3,7 |
| B477-D075 | 18.46 | 0.32 | 35.11 | –6.78 | ||
| B508 | 17.12 | 0.46 | 0.27 | 54.77 | –57.54 | |
| B190D-G048 | 18.17 | 0.24 | –0.29 | –46.03 | –0.26 | |
| G085-V015 | 17.39 | 0.23 | 0.05 | –43.73 | –11.86 | |
| B028D-G100 | 18.04 | 0.40 | –0.21 | –26.71 | –4.77 | |
| G137 | 17.81 | –0.02 | –1.16 | 5.75 | 12.76 | |
| G270 | 17.30 | 0.46 | –0.77 | 23.70 | –2.39 | |
| H126 | 16.76 | 0.42 | –0.03 | 43.75 | 13.32 | |
| NB39-AU6 | 17.94 | 0.21 | 0.40 | 0.18 | –0.79 | |
| NB42 | 18.49 | 0.52 | 1.49 | 0.56 | ||
| NB47-AU3 | 18.75 | 0.10 | 1.44 | 3.59 | ||
| B065D-NB69 | 16.83 | 0.37 | 1.41 | 2.52 | ||
| NB79 | 18.27 | 0.53 | –2.87 | 2.01 | ||
| NB107 | 18.65 | 0.31 | –2.28 | 1.62 | ||
| B134D | 18.19 | 0.46 | –0.19 | –74.79 | 46.10 | |
| B137D | 18.51 | 0.54 | –0.05 | –59.80 | 45.32 | |
| B139D | 18.59 | 0.44 | –116.18 | 2.35 | ||
| B147D | 17.96 | 0.49 | –0.44 | –47.16 | 49.24 | |
| B158D | 16.50 | 0.33 | 0.02 | –103.80 | –5.69 | |
| B162D | 17.85 | 0.44 | –0.52 | –91.16 | –0.17 | |
| B171D | 17.80 | 0.43 | 0.08 | –57.63 | 14.65 | |
| B173D | 17.45 | 0.55 | –0.43 | –54.91 | 15.16 | |
| B196D | 18.79 | –0.21 | –0.94 | –54.20 | –10.79 | |
| B216D | 18.21 | 0.30 | 0.01 | 28.36 | 21.50 | |
| B218D | 18.19 | 0.44 | –0.02 | 41.70 | 28.85 | |
| B220D | 16.94 | 0.53 | –0.06 | –65.70 | –55.73 | |
| B225D | 18.15 | 0.50 | –0.19 | –55.82 | –50.27 | |
| B227D | 16.91 | –0.01 | 0.03 | –44.15 | –41.65 | |
| B246D | 18.05 | 0.09 | –0.77 | 49.50 | 15.14 | |
| B253D | 17.68 | 0.53 | 0.03 | –16.92 | –42.36 | |
| B261D | 17.60 | 0.46 | –0.04 | 60.74 | 11.30 | |
| B270D | 17.50 | 0.40 | 0.34 | 10.14 | –36.21 | |
| B272D | 16.34 | 0.51 | 0.37 | –24.27 | –64.72 | |
| B286D | 17.76 | 0.47 | –0.91 | –7.48 | –59.92 | |
| B293D | 17.91 | 0.54 | –0.12 | –29.58 | –81.90 | |
| B303D | 18.27 | 0.31 | 0.91 | –43.52 | –97.03 | |
| B312D | 18.35 | 0.53 | –24.72 | –88.18 | ||
| B320D | 17.78 | 0.45 | –0.56 | 72.08 | –13.85 | |
| B322D | 18.26 | 0.17 | 0.29 | –36.49 | –101.57 | |
| B324D | 18.74 | 0.55 | –0.03 | 58.96 | –27.38 | |
| DA046a | 18.75 | 0.53 | –47.09 | –16.89 | 7 | |
| DA052 | 18.42 | 0.14 | –0.50 | –24.11 | –10.15 | 7 |
| DA069a | 17.48 | 0.26 | 42.11 | 6.66 | 7 | |
| V014 | 17.39 | 0.35 | 0.04 | –43.86 | –12.20 | 1 |
| V034 | 17.48 | 0.13 | –1.15 | –17.30 | 4.24 | |
| V133 | 18.36 | 0.06 | –1.26 | 51.54 | 5.58 | |
| V270 | 18.07 | 0.27 | –0.67 | 12.26 | 9.93 | |
| SH06 | 16.54 | 0.28 | –0.71 | –27.99 | 27.16 | |
| BH02 | 18.50 | 0.40 | –49.25 | –1.15 |
Note. — a Photometry from Barmby et al. (2000)
References. — (1) van den Bergh (1967); (2) Sargent et al. (1977); (3) Elson & Walterbos (1988); (4) Bohlin et al. (1988); (5) King & Lupton (1991); (6) Bohlin et al. (1993); (7) Barmby et al. (2000); (8) Barmby & Huchra (2001); (9) Williams & Hodge (2001a); (10) Jiang et al. (2003), (11) Beasley et al. (2004); (12) Burstein et al. (2004)