Axial Symmetry and Rotation in the SiO Maser Shell of IK Tauri
Abstract
We observed 43-GHz SiO maser emission toward the Mira variable IK Tauri (IK Tau) using the Very Long Baseline Array (VLBA). The images resulting from these observations show that SiO masers form a highly elliptical ring of emission approximately mas with an axial ratio of 1.8:1. The major axis of this elliptical distribution is oriented at position angle of 59∘. The line-of-sight velocity structure of the SiO masers has an apparent axis of symmetry consistent with the elongation axis of the maser distribution. Relative to the assumed stellar velocity of 35 km s-1, the blue- and red-shifted masers were found to lie to the northwest and southeast of this symmetry axis respectively. This velocity structure suggests a NW–SE rotation of the SiO maser shell with an equatorial velocity, which we determine to be 3.6 km s-1. Such a NW–SE rotation is in agreement with a circumstellar envelope geometry invoked to explain previous H2O and OH maser observations. In this geometry, H2O and OH masers are preferentially created in a region of enhanced density along the NE–SW equator orthogonal to the rotation/polar axis suggested by the SiO maser velocities.
1 INTRODUCTION
The star IK Tau, also know as NML Tau (Neugebauer, Martz, & Leighton, 1965), is an extremely red Mira variable with an unusually late spectral type ranging from M8.1–M11.2 (Wing & Lockwood, 1973). The period of IK Tau is 470 days as determined from infrared photometry measurements at 1 m (Wing & Lockwood, 1973) and at 11 m (Hale et al., 1997). Olofsson et al. (1998) computed a distance of 250 pc from integrated visual, near-infrared and IRAS data using the period-luminosity relationship of Whitelock et al. (1994). This distance is consistent with the 270 pc determined by Hyland et al. (1972) using infrared flux measurements and an assumed long-period variable maximum luminosity of . Mass loss rates estimated from the CO() line range from yr-1 (Knapp & Morris, 1985) to yr-1 (Olofsson et al., 1998).
Long-period variables such as IK Tau often exhibit circumstellar maser emission in one or more molecular species (i.e. OH, H2O or SiO). IK Tau is one such star that has maser emission in all three species. The OH and H2O masers toward IK Tau have been mapped using connected element and radio-linked interferometers (Lane et al., 1987; Bowers, Johnston & de Vegt, 1989; Bowers, Claussen & Johnston, 1993; Yates & Cohen, 1994; Bains et al., 2003) revealing the structure of the circumstellar envelope (CSE) on both large scales ( traced by the OH masers) and intermediate scales (200–350 mas traced by the H2O masers). Such studies have been useful in determining the structure of the CSE on these scales. The SiO masers, which lie close to the star, provide a unique probe of the morphology of the CSE and the velocity of the gas in a region just a few stellar radii from the photosphere. Previous Very Long Baseline Interferometry (VLBI) observations of long-period variables have demonstrated the various morphologies that exist in the SiO maser region. Some stars exhibit ring-like SiO maser distributions (Diamond et al., 1994; Diamond & Kemball, 1998; Cotton et al., 2004), while others (e.g. NML Cyg) show more elliptical distributions (Boboltz & Marvel, 2000). Previous SiO maser studies have also revealed the velocity structure of the nearby CSE to be complex showing elements of contraction (Boboltz, Diamond, & Kemball, 1997), expansion (Diamond & Kemball, 2003), and even rotation (Boboltz & Marvel, 2000; Hollis et al., 2001; Sánchez Contreras et al., 2002; Cotton et al., 2004). In this article, we present the results from our VLBI observations of the SiO maser emission toward the long-period variable IK Tau. We discuss how these observations fit into the overall picture of the CSE as traced by the various maser species and the possibility of axial symmetry and rotation in the envelope of IK Tau.
2 OBSERVATIONS AND REDUCTION
We observed the , SiO maser emission toward IK Tau (, , J2000) on 1996 April 5 from 20:00 to 24:00 UT. Based on a period of 470 days (Wing & Lockwood, 1973; Hale et al., 1997) and a maximum at JD 2439440 (Wing & Lockwood, 1973) the stellar phase of IK Tau was 0.85 during the epoch of our observations. IK Tau and a continuum calibrator (0423-013) were observed using the 10 stations of the VLBA plus a single antenna of the Very Large Array (VLA). Both the VLBA and VLA are operated by the National Radio Astronomy Observatory (NRAO).111The National Radio Astronomy Observatory is a facility of the National Science Foundation operated under cooperative agreement by Associated Universities, Inc. A reference frequency of 43.122027 GHz was used for the SiO transition. Data were recorded in dual circular polarization using a single 4-MHz (27.8 km s-1) band centered on the local standard of rest (LSR) velocity of 34.0 km s-1. System temperatures and point source sensitivities were on the order of 150 K and 11 Jy K-1 respectively.
The data were correlated at the VLBA correlator operated by the NRAO in Socorro, New Mexico. Auto and cross-correlation spectra consisting of 128 channels with channel spacings of 31.25 kHz (0.2 km s-1) were produced by the correlator. Calibration was performed using the Astronomical Image Processing System (AIPS) maintained by NRAO. Total intensity (Stokes ) data were calibrated in accordance with the procedures outlined in Diamond (1989). The bandpass response was determined from scans on the continuum calibrator and used to correct the target source data. The time-dependent gains of all antennas relative to a reference antenna were determined by fitting a total-power spectrum (from the reference antenna with the target source at a high elevation) to the total power spectrum of each antenna. The absolute flux density scale was established by scaling these gains by the system temperature and gain of the reference antenna. Errors in the gain and pointing of the reference antenna and the atmospheric opacity contribute to the error in the absolute amplitude calibration, which is accurate to about 15–20%. Residual group delays were determined by performing a fringe fit to the continuum calibrator sources and were applied to the spectral line data. Residual fringe-rate solutions were obtained by fringe-fitting a strong reference feature in the channel at km s-1 and were applied to all channels in the spectrum. An iterative self-calibration and imaging procedure was performed to map the reference channel at 36.2 km s-1. The resulting phase solutions were applied to all channels in the band.
Images of the SiO maser emission consisting of pixels ( mas) were generated using a synthesized beam of mas in natural weighting. Images were produced for spectral channels from 28.8 km s-1 to 41.6 km s-1 forming an image cube of 60 planes. Off-source RMS noise estimates in the spectral channel images range from 10 mJy beam-1 in planes with weak or no maser emission to 80 mJy beam-1 in dynamic-range limited planes containing strong (15 Jy beam-1) maser emission. Figure 1 shows the total intensity contour map of the 43.1-GHz SiO masers integrated over the LSR velocity range above. The dashed circle in the figure represents the stellar photosphere with a diameter of 20.2 mas. This diameter was determined from a uniform disk (UD) diameter fit to combined Keck aperture-masking data and Infrared-Optical Telescope Array (IOTA) data in the near infrared Monnier et al. (2004). It is apparent from Figure 1 that the SiO masers toward IK Tau form an elongated ring roughly mas across oriented in the NE–SW direction. If the star is assumed to be in the center of the distribution, maser distances range from 1.6–2.8 stellar radii.
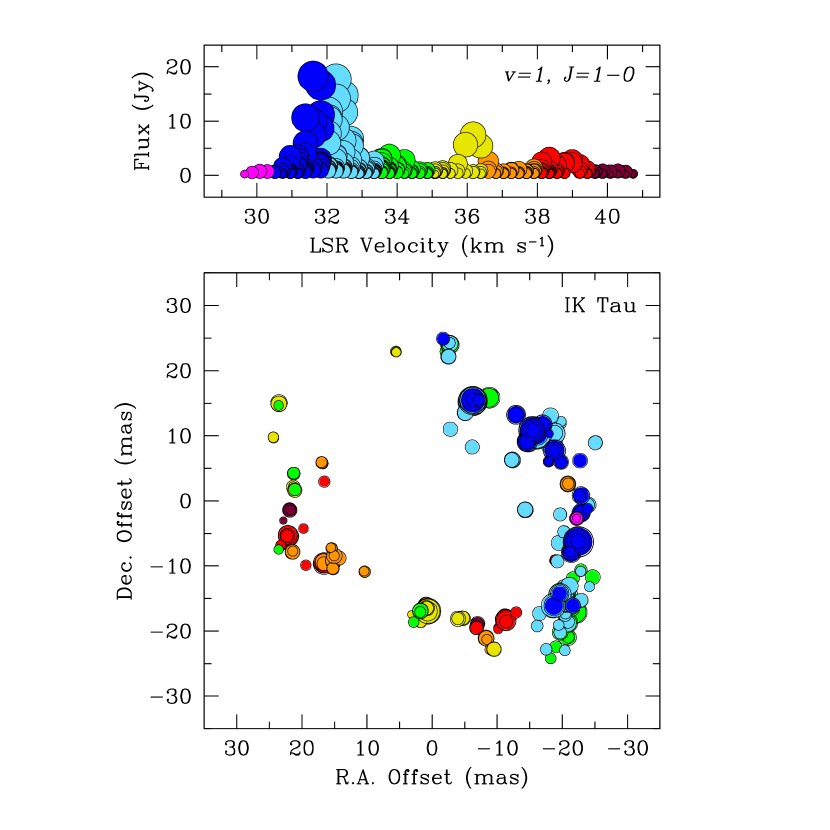
In order to identify and parameterize maser components, two-dimensional Gaussian functions were fit to the emission in each spectral (velocity) channel using the AIPS task SAD. Image quality was assessed using the off-source RMS noise and the deepest negative pixel in the image. A cutoff, above which emission features were fit, was conservatively set to the greater of 10 or 80% of the absolute value of the deepest negative pixel in the plane. Errors reported by SAD were based on the source size divided by twice the signal-to-noise ratio (SNR) in the image and ranged from 5 as for features with high SNR, to 371 as for features with lower SNR. The emission features identified by SAD are represented by the circles in Figure 2. In the figure, point sizes are are proportional to the logarithm of the fitted flux density which ranged from 0.2 to 18.3 Jy. Comparing Figures 1 and 2, we see that the identified features accurately represent the emission summed over all velocity channels in the image cube.
3 RESULTS AND DISCUSSION
3.1 Axial Symmetry in the CSE of IK Tau
Figures 1 and 2 show that the distribution of the 43.1-GHz SiO maser emission toward IK Tau was clearly not circularly symmetric during the epoch of our observations. Instead, the distribution appears to be elongated along an axis running from the northeast to the southwest in the images. We characterized this morphology by performing a least squares fit of an ellipse to the distribution of masers weighted by the flux density of each component. The resulting ellipse is plotted in Figure 2. The lengths of the semimajor and semiminor axes were found to be 29 mas and 16 mas respectively with the semimajor axis of the ellipse oriented at 59∘ measured east of north. At the assumed distance to IK Tau of 250 pc, the distribution of SiO masers is approximately AU. The SiO maser distributions of 20 late-type stars have previously been imaged with angular resolutions provided by VLBI (e.g. Cotton et al., 2004; Diamond & Kemball, 2003; Sánchez Contreras et al., 2002; Hollis et al., 2001; Boboltz & Marvel, 2000; Diamond et al., 1994). Of these stars, IK Tau, with an axial ratio of 1.8:1, appears to have one of the most elongated SiO rings yet observed.
As mentioned previously, Monnier et al. (2004) were able to separate the near-infrared stellar and dust contributions and determine a UD diameter of 20.2 mas for the photosphere of IK Tau. However, they found that the longest (27 m) IOTA baseline data were inconsistent with this fit, and the data were thus ignored. Possible explanations for this deviation are departures from uniform photospheric brightness (e.g. stellar hot spots or extended molecular emission), or the presence of a binary companion (Monnier et al., 2004).
The circumstellar dust shell, typically outside the SiO maser region, has been observed for IK Tau using long baseline interferometers operating at mid-infrared (Danchi et al., 1994; Hale et al., 1997) and near-infrared (Monnier et al., 2004) wavelengths. Hale et al. (1997) found that their Infrared Spatial Interferometer (ISI) 11 m visibilities were best fit by a three spherically symmetric concentric dust shells. However, Monnier et al. (2004) state that their Keck-IOTA data, which includes multiple late-type stars, suggest that the popular strategy of incorporating multiple spherically symmetric shells to model deviations from simple uniform outflow might be misguided and that clumpiness and global asymmetry should be considered more seriously. In fact, Monnier et al. (2004) report that the visibility data for IK Tau shows signs of asymmetries for the dust shell but the data are not of sufficient quality to make a definitive determination.
Beyond the regions of the SiO masers and circumstellar dust shell, there is evidence for axisymmetric structures in the CSE of IK Tau. On large angular scales, Bowers, Johnston & de Vegt (1989) found that the 1612-MHz OH masers form an elongated ring 3.5 with a NW–SE orientation of the long axis. The axisymmetry is especially apparent at high velocities ( km s-1) where nearly all of the emission originates to the SE and NW of the star. Observations of the 22-GHz H2O masers with the VLA (Lane et al., 1987; Bowers, Claussen & Johnston, 1993) and the Multi Element Radio Linked Interferometer Network (MERLIN) (Yates & Cohen, 1994; Bains et al., 2003) show similar axial symmetry with respect to the NW–SE direction. VLA observations by Lane et al. (1987) show that the low-velocity masers have a ring-like distribution, while the high-velocity masers have a flattened distribution with a NW–SE orientation. The overall size of the shell was roughly 330 mas. The VLA data of Bowers, Claussen & Johnston (1993) show the H2O maser distribution to be 220 mas across with a similar elongation in the NW–SE direction. The MERLIN images of Bains et al. (2003) show bright blue- and red-shifted emission distributed over an elliptical region approximately 100 200mas superimposed on a fainter spherical region of emission from all spectral channels.
The observed NE–SW orientation for the elliptical SiO maser distribution is roughly orthogonal to elongations of the H2O and OH maser distributions. Bowers, Johnston & de Vegt (1989) suggest that the axisymmetric structures seen in the OH and H2O maser shells for certain late-type stars are a result of the density distribution of gas and dust in the CSE. They conclude that the density distribution is latitude dependent with the total density decreasing as the latitude increases from the rotationally defined equatorial plane. In stars in which both the OH and H2O masers are axially symmetric (e.g. IK Tau) Bowers, Johnston & de Vegt (1989) suggest that the distributions should be aligned parallel along the equatorial plane since the density enhancement is conducive to the formation of the H2O masers (assuming these masers are collisionally pumped) and since the OH masers are the result of the photodissociation of the H2O by the surrounding UV radiation. Yates & Cohen (1994) state that their MERLIN data are also supportive of a NW–SE equator for IK Tau with the brightest H2O masers observed along this axis as expected. Assuming this NW–SE axis is parallel to the equator of IK Tau as suggested by the OH and H2O maser observations, then the elongation we observe in the SiO maser distribution is along an axis roughly perpedicular to the equator and possibly parallel to the polar axis of the star. The importance of this geometry will become apparent in the discussion of the velocity structure of the SiO masers in the next section.
3.2 Velocity Structure of the SiO Masers
The line-of-sight (LOS) velocity information derived from our VLBA data is shown in Figure 3. The top panel shows the spectrum of SiO maser emission from 28–42 km s-1 color coded by LOS velocity in increments of 1.5 km s-1. The bottom panel of Figure 3 shows the SiO masers plotted in the same velocity color coding as the top panel, with the color of the maser spot representing its corresponding velocity in the spectrum. It is apparent from the figure that there is a symmetry axis for the velocity structure of the SiO maser emission toward IK Tau with the northwestern side of the shell dominated by blue-shifted masers (relative to the assumed stellar velocity of 35 km s-1) and the southeastern side of the shell dominated by red-shifted masers. Such velocity distributions in which blue and red-shifted SiO masers occur on opposite sides of the star have previously been observed for NML Cyg (Boboltz & Marvel, 2000), R Aqr (Hollis et al., 2001; Cotton et al., 2004), OH231.8+4.2 (Sánchez Contreras et al., 2002). For NML Cyg and R Aqr, the maser velocity distributions suggested rotation of their respective maser shells. In the case of OH231.8+4.2 Sánchez Contreras et al. (2002) concluded that the maser distribution could be modeled by a rotating, contracting torus of emission.
The ring-like distributions typically observed in VLBA studies of SiO masers indicate the masers are amplified in a direction perpendicular to the radial direction (i.e. tangential amplification) Diamond et al. (1994). This amplification occurs along the longest path lengths parallel to the observers line of sight. Assuming this is the case for IK Tau, then the velocity structure shown in Figure 3 suggests a NW to SE rotation of the maser shell with the axis of rotation near the elongation axis of the distribution. Such a rotation axis is in agreement with a NE–SW equator for IK Tau as indicated by the previous OH and H2O maser observations mentioned above.
Rotation is not a new concept with regards to the masers in the CSE of IK Tau. Bowers, Johnston & de Vegt (1989) considered models with radial expansion combined with Keplerian rotation to explain the axisymmetric geometries observed for the 1612 MHz OH masers. They concluded that although rotation could not unequivocally be ruled out, the data did not support rotation as a primary component in the kinematics of the OH shell. Additionally, Bowers, Claussen & Johnston (1993) found that the plot of radius versus velocity for their H2O maser data was reminiscent of models of accelerating or axisymmetric outflow with a possible rotational component.
To better characterize the velocity structure of the SiO emission, we investigated a number of models with velocity components including rotation and expansion/contraction. Modeling the three-dimensional velocity structure of the SiO masers toward IK Tau is complicated by the elliptical distribution of the masers and by a lack of knowledge of the shell structure along the observer’s line of sight (LOS). The elliptical distribution of the masers could be modeled by either a ellipsoidal shell or an inclined torus similar to that of Sánchez Contreras et al. (2002). We chose an ellipsoidal shell based on the assumption that the masers are tangentially amplified and the fact that nearly a full ring of emission is observed. In the case of a torus with tangential amplification one would expect to see only two regions of emisison on opposite sides of the star as was observed by Sánchez Contreras et al. (2002). Models developed for IK Tau are based on a prolate spheroid with the long axis oriented at a position angle of 59∘ (as suggested by the elliptical fit shown in Figure 2). Since the true three-dimensional shape of the maser shell is unknown, the axis of the ellipsoidal model along the observers LOS was assumed to be the same size as the minor axis of the model in the plane of the sky. Additionally, the inclination of the ellipsoid was assumed to be zero.
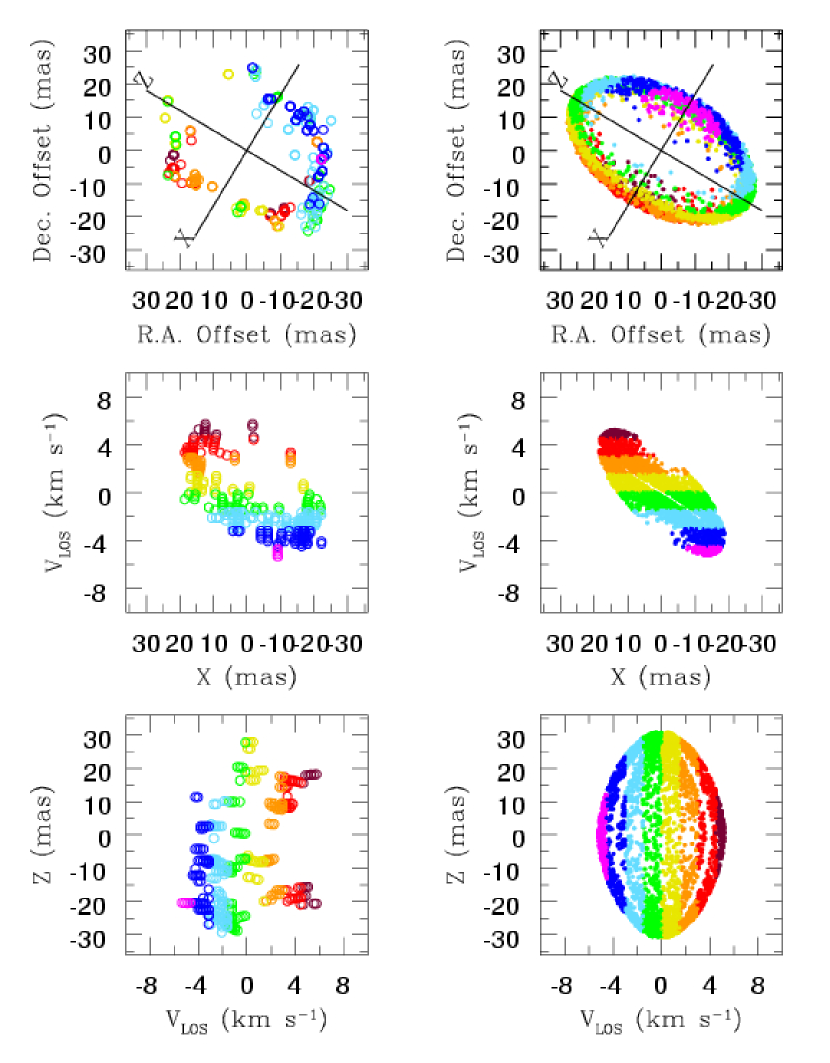
The models were compared “by eye” to the actual data to determine how well they reproduced the true maser spatial and velocity distributions. To make the comparison easier we plotted the data and the models in a manner similar to that presented in Hollis et al. (2001) with three different views. Figure 4 shows the VLBA data plotted in the three panels on the left. The top panel plots the maser distribution with the same color-coding as that of Figure 3 along with a set of axes (,) determined from the elliptical fit of Figure 2. The middle panel plots the component LOS velocity versus its position along the equatorial () axis. The bottom panel plots the component LOS velocity versus its position along the polar () axis. The right three panels of Figure 4 plot the equivalent distributions derived from the model.
The size and shape of the model shell (i.e. major axis, minor axis and shell thickness) were chosen to approximate the spatial distribution of the SiO masers as seen in Figure 3 and the top-left panel of Figure 4. Maser velocities were first modeled with a general form of rotation given by:
| (1) |
It quickly became apparent that models including only rotation do not sufficiently approximate the maser data. In the middle-left panel of Figure 4, we see that there is a significant variation in position along the -axis for masers with small (2 km s-1) LOS velocities. It is this spread in position for low-velocity points that is difficult to model assuming only rotation. For example, solid-body rotation () yields a simple linear variation of LOS velocity with position along the -axis regardless of distance along the -axis. Keplerian rotation () gives a greater variation in -axis position for higher velocity masers, however, at lower velocities the positions are still confined to a narrow region in the vs. plot (see Figure 3 of Hollis et al. (2001)).
One way to produce the observed spread in position at small LOS velocities is to add an expansion term to the equation describing the motion of the masers in the shell. The LOS velocity for an elliptical shell which is in rotation and also has a component of constant velocity expansion, , can be written:
| (2) |
where the rotational term is similar to that of Hollis et al. (2001); note that the exponent allows for sub- or super-Keplerian rotation. In equation 2, represents the mass of the star, is the stellar velocity, the angle is measured in the equatorial plane of the shell and the angle is the latitudinal coordinate of the shell. Since the mass of IK Tau is unknown, 1 was assumed for the model. The stellar velocity, , was assumed to be 35 km s-1 consistent with velocities determined from the midpoints of the spectra of the 1612 MHz OH masers, 33.2 km s-1 (Bowers, Johnston & de Vegt, 1989) and the H2O masers 35.4 km s-1 (Bowers, Claussen & Johnston, 1993). Similar to the models of Humphreys et al. (1996, 2002) maser gain length was approximated by considering the distance along the path in which the LOS velocity changes by less than three times the Doppler width of the line. Amplification becomes negligible for velocity shifts greater than this limit (Humphreys et al., 1996, 2002). For SiO we estimated a Doppler line width km s-1 for a typical temperature of 1500 K in the SiO maser region (Doel et al., 1995). The maser gain length was further constrained to be greater than the minimum path length of cm necessary for SiO maser emission (Elitzur, 1982) and to be less than or equal to the physical LOS path length through the shell.
In practice, a random point is chosen within the region determined by the geometric parameters of the shell (i.e. size, orientation, thickness). The LOS velocity for this point is computed from equation 2. From this point, distances forwards and backwards along the observers line of sight are computed for which the LOS velocity changes by 1.5 times the Doppler line width. Thus, we have a line of points, with the chosen random point as the center, for which is within three times the Doppler line width. If both ends of the line reside within the maser shell and the total length of the line is greater than the minimum path length required for maser emission, then the center point is kept and is color-coded according to its . Otherwise, the point is rejected. In this manner, the model builds up a distribution of points mapping both the structure of the shell and the maser velocity distribution.
The model shown in Figure 4 is meant to provide a qualitative match to the IK Tau SiO maser distribution. The parameters for the model are presented in Table 1. Inner distances of 16 mas and 28 mas were used for the semiminor, , and semimajor, , axes respectively with a shell thickness of 3 mas. As mentioned previously the position angle for the ellipse was set to 59∘. The model is not particularly sensitive to this angle, and changes of 5∘ do not change the results significantly. The two parameters which affect the velocity structure are the exponent and the expansion velocity . Through an iterative process of adjusting parameters and qualitatively comparing the model to the data, values of and km s-1 were determined. Coincidentally, the value for is equivalent to that found for R Aqr by Hollis et al. (2001). As in the model for R Aqr, the model for IK Tau is sensitive to small (0.01) variations in the value of . Unlike the R Aqr case, the mass of IK Tau is not well constrained, and variations in the assumed value for could allow for slight variations in the value of . To produce a similar model to that shown in Figure 4 with pure Keplerian motion () would require a stellar mass . Similarly, the model is sensitive to the the expansion velocity . Changes on the order of 1.0 km s-1 produce significant changes in the velocity distributions of the masers.
Additionally, there is a trade-off between the model expansion velocity, and the quenching of the masers caused by the Doppler line width limitation. Larger values for tend to spread the distribution in the middle panel of the model plot, but only if is increased to allow the greater change in velocity and resulting longer gain lengths. The longer path lengths, in turn, create more masers in front of and behind the star, a characteristic which is clearly not evident in these or any other SiO maser observations of which we are aware. As the top-right panel of Figure 4 shows, the density distribution of masers resulting from the path length considerations is characterized by tangentially amplified masers along the limb of the shell. In order to limit maser emission along the line of sight to the star, the maser shell thickness must be the maser minimum path length. Since we assumed a minimum maser path length of cm (2.7 mas at the assumed distance to IK Tau), the shell thickness was set to 2.6 mas. Without increasing the minimum required path length, increasing the maser shell thickness will produce masers along the line of sight to the star, thus filling in the distribution in the top-right panel of Figure 4.
The expansion velocity km s-1 used in the model is consistent with observational evidence as found in proper motion studies of SiO masers. Boboltz, Diamond, & Kemball (1997) measured the proper motions of the SiO masers toward R Aqr and found an overall infall of the masers (shell contraction) with a velocity of 4 km s-1 over stellar phases . Diamond & Kemball (2003), in an extensive study of the Mira variable TX Cam, determined the dominant mode to be expansion of the SiO masers, with radial proper motion magnitudes of 5–10 km s-1 between stellar phases .
From our single epoch of SiO maser observations, it is difficult to tell whether the model expansion term represents a physical expansion or contraction of the maser shell. This is because both expansion and contraction produce nearly identical distributions in the both the middle- and lower-right panels of Figure 4. The only difference between a positive or negative expansion term is observable in the top-right panel of Figure 4. For example, if we consider only rotation of the shell, we find that all of the red-shifted masers occur along the positive -axis (the SE side of the shell), and all of the blue-shifted masers occur along the negative -axis (NW side of the shell) and the velocities are symmetric about the plane of the sky. The addition of a positive expansion term (as was done for our model) serves to rotate the blue-shifted velocities out of the plane of the sky toward the front of the shell closest to the observer and red-shifted velocities away from the observer. However, the actual masers are still confined to a region around the plane of the sky, thus the shift in the velocity structure is most easily observed near the poles along the -axis where we see in the top-right panel of Figure 4 that some low-velocity blue-shifted masers (green) have been shifted toward the positive -axis. Contraction of the shell has the opposite effect rotating the red-shifted velocity structure out of the plane toward the front of the shell and the blue-shifted velocities toward the back of the shell. It is practically impossible to tell from our maser data whether expansion or contraction is the case for the IK Tau shell. There seems to be a slight preference for blue-shifted masers in general and a tendency for some blue-shifted masers along the positive -axis in the top-left panel of Figure 4, but this is highly dependent on the assumed stellar velocity of 35 km s-1 and the choice of position angle for the major axis of the ellipse.
The maser shell rotational velocities produced in the model are not considered extraordinary. The equatorial velocity at the distance of the mean semiminor axis of 16 mas is 3.6 km s-1 with a corresponding rotational period of 33 yr. At the UD photospheric distance of 10.1 mas the equatorial velocity is 4.6 km s-1 with a corresponding rotational period of 16 yr. These rotational velocities are consistent with observational measurements for R Aqr (3–5 km s-1, Hollis et al., 2001; Cotton et al., 2004) and slightly lower than measurements for NML Cyg (11 km s-1, Boboltz & Marvel, 2000) and OH231.8+4.2 (7–10 km s-1, Sánchez Contreras et al., 2002). Significant stellar rotation velocities (10s to 100s of km s-1) during the asymptotic giant branch (AGB) phase have been invoked in theoretical studies of chemical mixing and the nucleosynthesis of heavy elements in convective envelopes (Langer et al., 1999; Herwig, Langer & Lugaro, 2003; Siess, Goriely & Langer, 2004). Stellar rotation is also factor in models describing the shaping of bipolar and elliptical planetary nebulae, and García-Segura et al. (1999) propose that AGB stars above 1.3 can spin up their extended circumstellar envelopes to rotational speeds on the order of a km s-1. Stellar rotation velocities of 3–7 km s-1 are used in such models that result in equatorial density enhancements and eventually bipolar nebulae (García-Segura et al., 1999). Interestingly, the collective maser observations of IK Tau, which suggest rotation, axial symmetry, and equatorial density enhancement, may be indicating that IK Tau is on its way to becoming such a bipolar planetary nebula.
4 SUMMARY
We have imaged the , SiO maser emission toward the Mira variable IK Tau. We find that the SiO masers are distributed in an elongated ring roughly mas ( AU at the adopted distance of 250 pc) with the major axis of the ellipse at a position angle of 59∘. The NE–SW elongation of the SiO maser distribution is roughly perpendicular to the NW–SE symmetry axis previously determined for the H2O and OH maser distributions. This elongation axis also provides an axis of symmetry for the LOS velocity structure of the SiO masers. Masers having velocities blue-shifted with respect to the assumed center velocity of 35 km s-1 were found to lie on the northwestern side of the shell while the southeastern side of the shell is dominated by red-shifted SiO masers. Under the assumption of tangentially amplified masers, this velocity distribution implies a NW to SE rotation of the SiO shell about a NE–SW rotation/polar axis. Such a polar axis would be in agreement with models invoked to explain the H2O and OH maser geometries which suggest a NW–SE equator for IK Tau.
The inherent transient and irregular nature of SiO maser emission in the atmospheres of long-period variables limits the comparison of models to a single epoch of VLBI data. However, we have attempted to approximate the IK Tau observations presented here assuming an ellipsoidal model of the SiO maser shell. We favor a model that includes both rotation of the form and constant-velocity expansion/contraction as a representation of the velocity field in the CSE of IK Tau at the distance of the SiO maser shell. This model appears to reproduce the global characteristics of the observed SiO masers in terms of structure and velocity distribution. A multi-epoch VLBI monitoring program to determine the SiO maser proper motions could verify this scenario and would greatly clarify our understanding of the CSE of IK Tau.
References
- Bains et al. (2003) Bains, I., Cohen, R. J., Louridas, A., Richards, A. M. S., Rosa-González, D. & Yates, J. A. 2003, MNRAS, 342, 8
- Boboltz, Diamond, & Kemball (1997) Boboltz, D. A., Diamond, P. J. & Kemball, A. J. 1997, ApJ, 487, L147
- Boboltz & Marvel (2000) Boboltz, D. A. & Marvel, K. B. 2000, ApJ, 545, L149
- Bowers, Claussen & Johnston (1993) Bowers, P. F., Claussen, M. J. & Johnston, K. J. 1993, AJ, 105, 284
- Bowers, Johnston & de Vegt (1989) Bowers, P. F., Johnston, K. J. & de Vegt, C. 1989, ApJ, 340, 479
- Cotton et al. (2004) Cotton, W. D., et al. 2004, A&A, 414, 275
- Danchi et al. (1994) Danchi, W. C., Bester, M., Degiacomi, C. G., Greenhill, L. J., & Townes, C. H. 1994, AJ, 107, 1469
- Diamond (1989) Diamond, P. J. 1989, in Very Long Baseline Interferometry: Techniques and Applications, eds. M. Felli & R.E. Spencer, (Dordrecht: Kluwer Academic Press), 233
- Diamond & Kemball (2003) Diamond, P. J. & Kemball, A. J. 2003, ApJ, 599, 1372
- Diamond & Kemball (1998) Diamond, P. J. & Kemball, A. J. 1998, ASP Conf. Ser. 144: IAU Colloq. 164: Radio Emission from Galactic and Extragalactic Compact Sources, eds. J. A. Zensus, G. B. Taylor & J.M. Wrobel, ASP: San Francisco, 245
- Diamond et al. (1994) Diamond, P. J., Kemball, A. J., Junor, W., Zensus, A., Benson, J. & Dhawan, V. 1994, ApJ, 430, L61
- Doel et al. (1995) Doel, R. C., Gray, M. D., Humphreys, E. M. L., Braithwaite, M. F. & Field, D. 1995, A&A, 302, 797
- Elitzur (1982) Elitzur, M. 1982, Rev. Mod. Phys., 54, 1225
- García-Segura et al. (1999) García-Segura, G., Langer, N., Różyczka, M. & Franco, J. 1999, ApJ, 517, 767
- Hale et al. (1997) Hale, D. D. S., Bester, M., Danchi, W. C., Hoss, S., Lipman, E., Monnier, J. D., Tuthill, P. G., Townes, C. H., Johnson, M., Lopez, B. & Geballe, T. R. 1997, ApJ, 490, 407
- Herwig, Langer & Lugaro (2003) Herwig, F., Langer, N. & Lugaro, M. 2003, ApJ, 593, 1056
- Hollis et al. (2001) Hollis, J. M., Boboltz, D. A., Pedelty, J. A., White, S. M. & Forster, J. R. 2001, ApJ, 559, L37
- Humphreys et al. (1996) Humphreys, E. M. L., Gray, M. D., Yates, J. A., Field, D., Bowen, G. & Diamond, P. J. 1996, MNRAS, 282, 1359
- Humphreys et al. (2002) Humphreys, E. M. L., Gray, M. D., Yates, J. A., Field, D., Bowen, G. & Diamond, P. J. 2002, A&A, 386, 256
- Hyland et al. (1972) Hyland, A. R., Becklin, E. E., Frogel, J. A. & Neugebauer, G. 1972, å, 16, 204
- Knapp & Morris (1985) Knapp, G. R. & Morris, M. 1985, ApJ, 292, 640
- Lane et al. (1987) Lane, A. P., Johnston, K. J., Bowers, P. F., Spencer, J. H. & Diamond, P. J. 1987, ApJ, 323, 756
- Langer et al. (1999) Langer, N., Heger, A., Wellstein, S. & Herwig, F. 1999, å, 346, L37
- Monnier et al. (2004) Monnier, J. D. et al. 2004, ApJ, 605, 436
- Neugebauer, Martz, & Leighton (1965) Neugebauer, G., Martz, D. E. & Leighton, R. B. 1965, ApJ, 142, 399
- Olofsson et al. (1998) Olofsson, H., Lindqvist, M., Nyman, L.-Å., & Winnberg, A. 1998, A&A, 329, 1059
- Sánchez Contreras et al. (2002) Sánchez Contreras, C., Desmurs, J. F., Bujarrabal, V., Alcolea, J. & Colomer, F. 2002, å, 385, L1
- Siess, Goriely & Langer (2004) Siess, L., Goriely, S. & Langer, N. 2004, A&A, 415, 1089
- Tuthill et al. (1998) Tuthill, P. G., Monnier, J., Danchi, W. & Haniff, C. 1998, ASP Conf. Ser. 154: Tenth Cambridge Workshop on Cool Stars, Stellar Systems, and the Sun, 10, eds. R. A. Donahue & J. A. Bookbinder, (ASP: San Francisco), 2057
- Yates & Cohen (1994) Yates, J. A. & Cohen, R. J. 1994, MNRAS, 270, 958
- Whitelock et al. (1994) Whitelock, P., Menzies, J., Feast, M., Marang, F., Carter, B., Roberts, G., Catchpole, R., & Chapman, J. 1994, MNRAS, 267, 711
- Wing & Lockwood (1973) Wing, R. F. & Lockwood, G. N. 1973, ApJ, 184, 873
| Parameter | Value |
|---|---|
| Shell Geometry: | |
| semiminor axis, | 16 mas |
| semimajor axis, | 28 mas |
| Shell thickness | 2.6 mas |
| Position angle | 59∘ |
| Inclination, | 0∘ |
| Distance | 250 pc |
| Stellar Mass, | 1 |
| Stellar Velocity, | 35.0 km s-1 |
| Minimum maser path length | cm |
| Doppler line width, | 1.0 km s-1 |
| Expansion velocity, | 3.5 km s-1 |
| Exponent, | 1.09 |