86 GHz SiO maser survey of late-type stars in the Inner Galaxy ††thanks: This is paper no. 22 in a refereed journal based on data from the ISOGAL project. Based on observations with ISO (an ESA project with instruments funded by ESA member states and with the participations of ISAS and NASA), with telescopes of the European Southern Observatory in La Silla, Chile, and with the IRAM 30-m telescope on Pico Veleta, Spain. IRAM is supported by INSU/CNRS (France), MPG (Germany), and IGN (Spain). ††thanks: Table 3 is only available in electronic form at the CDS via anonymous ftp to cdsarc.u-strasbg.fr (130.79.128.5) or via http://cdsweb.u-strasbg.fr/cgi-bin/qcat?J/A+A/
We have determined extinction corrections for a sample of 441 late-type stars in the inner Galaxy, which we previously searched for SiO maser emission, using the 2MASS near-infrared photometry of the surrounding stars. From this, the near-infrared extinction law is found to be approximated by a power law A. Near- and mid-infrared colour-colour properties of known Mira stars are reviewed. From the distribution of the dereddened infrared colours of the SiO target stars we infer mass-loss rates between and M⊙ yr-1.
Key Words.:
dust,extinction – stars: AGB and post-AGB – stars: mass-loss – Infrared: stars – circumstellar matter – Galaxy: stellar content1 Introduction
We study interstellar extinction in the direction a sample of evolved late-type stars in the inner Galaxy (° °, °), which we previously searched for SiO maser emission (“SiO targets” hereafter; Messineo et al. 2002, Paper I). Since SiO maser emission reveals stellar line of sight velocities with an accuracy of a few km s-1, SiO maser stars are ideal for Galactic kinematics studies. Furthermore, the combination of stellar kinematics and physical properties of the stars, e.g. their intrinsic colours and bolometric magnitudes, will enable a revised kinematic study of the inner Galaxy to reveal which Galactic component and which epoch of Galactic star formation the SiO stars are tracing.
A proper correction for interstellar extinction is of primary importance for a photometric study of stellar populations in the inner Galaxy, where extinction can be significant even at infrared wavelengths. Interstellar extinction hampers an accurate determination of the stellar intrinsic colours and bolometric magnitudes (Messineo 2004). This is especially critical in the central Bulge region where interstellar extinction may exceed 30 visual magnitudes and due to the current uncertainty in the near-infrared extinction law (30%) the uncertainty in the bolometric luminosities of evolved late-type stars is at least 1 magnitude.
The available near- and mid-infrared photometry of the SiO targets from the DENIS (Epchtein et al. 1994), 2MASS (Cutri et al. 2003), ISOGAL (Omont et al. 2003; Schuller et al. 2003), and MSX (Egan et al. 1999; Price et al. 2001) surveys were already presented by Messineo et al. (2004, Paper II). The sample consists mainly of large-amplitude variable (LAV) Asymptotic Giant Branch (AGB) stars (\al@messineo02,messineo03_2; \al@messineo02,messineo03_2). The estimates of interstellar extinction toward this class of objects are complicated by the presence of a circumstellar envelope with variable optical depth. Therefore, in order to disentangle circumstellar and interstellar extinction for each AGB star one also needs to study the dust distribution along its line of sight.
In Sect. 2 we discuss the uncertainty of the extinction law at near- and mid-infrared wavelengths and the consequent uncertainty of the stellar luminosities. In Sect. 3 we describe the near-infrared colour-magnitude diagrams (CMDs) of field stars (mainly giants) toward the inner Galaxy and use the latter to derive the median extinction in the direction of each target. In Sect. 4 we review the location of known Mira stars on the CMDs and colour-colour diagrams. In Sects. 5 and 6 we use the median extinction from surrounding field stars to deredden our SiO targets and discuss their colours and mass-loss rates. The main conclusions are given in Sect. 7.
2 Interstellar extinction law
The composition and abundance of interstellar dust and its detailed extinction properties remain unclear, thus limiting the accuracy of stellar population studies in the inner Galaxy. In the following we discuss the near- and mid-infrared extinction law, in order to assess the uncertainty in the extinction correction.
2.1 Near-infrared interstellar extinction
| A | A | A | A | A | A | RV | Ref. | |
|---|---|---|---|---|---|---|---|---|
| 0.592 | 0.256 | 0.150 | 0.089 | 0.533 | 1.459 | 1.85 | Glass (1999) | |
| 0.482 | 0.282 | 0.175 | 0.112 | 0.659 | 1.778 | 1.61 | 3.09 | Rieke & Lebofsky (1985) |
| 0.606 | 0.287 | 0.182 | 0.118 | 0.696 | 1.842 | 1.61 | 3.10 | Cardelli et al. (1989) |
| 0.563 | 0.259 | 0.164 | 0.106 | 0.696 | 1.842 | 1.61 | 2.50∗ | ” |
| 0.606 | 0.267 | 0.158 | 0.096 | 0.561 | 1.548 | 1.85 | 3.10 | Cardelli et al. (1989)+ |
| 0.563 | 0.240 | 0.142 | 0.086 | 0.561 | 1.548 | 1.85 | 2.50 | ” |
| 0.606 | 0.263 | 0.153 | 0.092 | 0.537 | 1.496 | 1.90 | 3.10 | ” |
| 0.563 | 0.237 | 0.138 | 0.083 | 0.537 | 1.496 | 1.90 | 2.50 | ” |
| 0.606 | 0.255 | 0.144 | 0.084 | 0.493 | 1.401 | 2.00 | 3.10 | ” |
| 0.563 | 0.229 | 0.130 | 0.076 | 0.494 | 1.400 | 2.00 | 2.50 | ” |
| 0.606 | 0.238 | 0.127 | 0.070 | 0.420 | 1.236 | 2.20 | 3.10 | ” |
| 0.563 | 0.213 | 0.114 | 0.063 | 0.420 | 1.236 | 2.20 | 2.50 | ” |
-
∗
recent determination toward the Bulge (e.g. Udalski 2003).
-
+
parametric expression modified to extrapolate to m with .
Interstellar extinction at near-infrared wavelengths (1-5 m) is dominated by graphite grains. Near-infrared photometric studies have shown that the wavelength-dependence of the extinction may be expressed by a power law Aλ where was found to range between 1.6 (Rieke & Lebofsky 1985) and 1.9 (Glass 1999; Landini et al. 1984; van de Hulst 1946).
One can estimate the near-infrared extinction by measuring the near-infrared reddening of stars of known colour. When using broad-band photometric measurements, one needs to properly account for the bandpass, stellar spectral shape, and the wavelength-dependence of the extinction. As a function of the Ks band extinction we therefore computed a grid of “effective extinction” values for the DENIS and 2MASS , and bandpass. This effective extinction was computed by reddening an M0 III stellar spectrum (Fluks et al. 1994) with a power law extinction curve and integrating over the respective filter transmission curves. When we convolve the filter response with a stellar sub-type spectrum different from the M0 III, only the effective I-band extinction values change significantly, e.g. decreasing by 3% for a M7 III spectrum (see also van Loon et al. 2003).
The Ks-band extinction A can then be expressed as
where and are the reddening in the and colour, respectively, and the are constants. These relations are independent of visual extinction and of the coefficient of selective extinction, , but they depend on the slope of the near-infrared extinction power law (see Table 1). However, to provide the reader with the familiar ratio between near-infrared effective extinction and visual extinction, we also used the commonly adopted extinction law of Cardelli et al. (1989). Such ratios may be useful in low-extinction Bulge windows, where visual data are also available. The analytic expression given by Cardelli et al., which depends only on the parameter , is based on multi-wavelength stellar colour excess measurements from the violet to 0.9m, and extrapolates to the near-infrared using the power law of Rieke & Lebofsky (1985). We extrapolated Cardelli’s extinction law to near-infrared wavelengths using a set of different power laws (Table 1).
Uncertainty in the slope of the extinction law produces an uncertainty in the estimates of the near-infrared extinction of typically 30% in magnitude (see Table 1). For a Ks band extinction of A mag the uncertainty may be up to 0.9 mag, which translates into an uncertainty in the stellar bolometric magnitudes of the same magnitude.
In Sect. 3 we show that a power law index is inconsistent with the observed near-IR colours of field giant stars toward the inner Galaxy, and that the most likely value of is .
2.2 Mid-infrared interstellar extinction
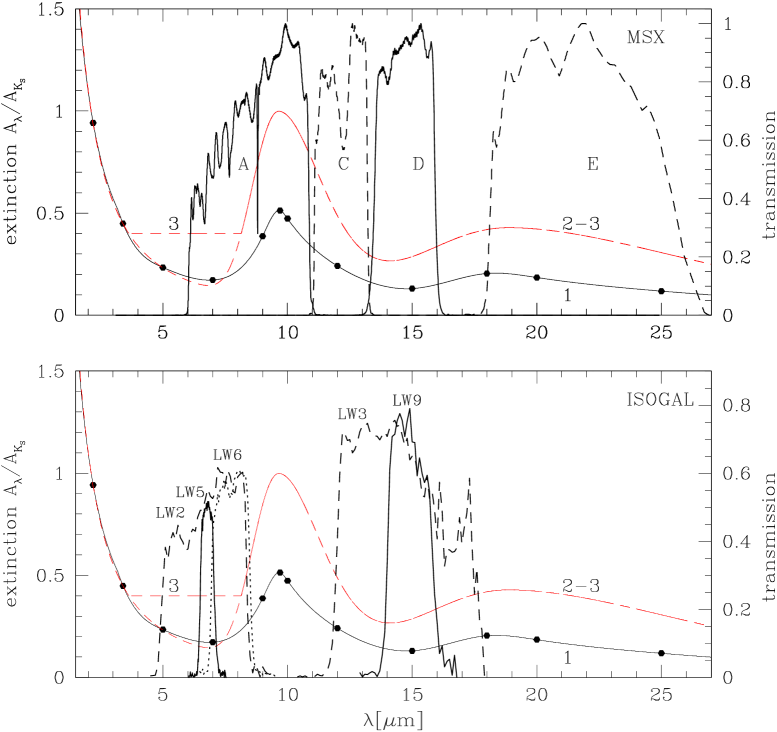
The mid-infrared extinction (5-25 m) is characterised by the 9.7 and 18 m silicate features. The strength and profile of these features are uncertain and appear to vary from one line of sight to another. A standard graphite-silicate mix predicts a minimum in at 7m, which has however been not observed to be very pronounced toward the Galactic Centre (Lutz et al. 1996; Lutz 1999).
| Filter | Curve 1 (Mathis) | Curve 2 | Curve 3 (Lutz) | ||
|---|---|---|---|---|---|
| () | () | ( & no minimum) | |||
| m | m | A/A | A/A | A/A | |
| LW2 | 6.7 | 3.5 | 0.21 | 0.21 | 0.41 |
| LW5 | 6.8 | 0.5 | 0.18 | 0.15 | 0.41 |
| LW6 | 7.7 | 1.5 | 0.21 | 0.26 | 0.43 |
| LW3 | 14.3 | 6.0 | 0.18 | 0.34 | 0.34 |
| LW9 | 14.9 | 2.0 | 0.14 | 0.29 | 0.29 |
| A | 8.28 | 4.0 | 0.26 | 0.38 | 0.55 |
| C | 12.1 | 2.1 | 0.25 | 0.49 | 0.49 |
| D | 14.6 | 2.4 | 0.14 | 0.29 | 0.29 |
| E | 21.3 | 6.9 | 0.17 | 0.41 | 0.41 |
The mid-infrared extinction curve of Mathis (1990) is commonly used with its combination of a power law and the astronomical silicate profile of Draine & Lee (1984) with – a value found in the diffuse interstellar medium toward Wolf-Rayet stars (e.g. Mathis 1998). However, from observations of hydrogen recombination lines, Lutz (1999) concluded that in the direction of the Galactic centre; and analysing the observed H2 level populations toward Orion OMC-1, Rosenthal et al. (2000) derived .
By using a parametric mid-infrared extinction curve by Rosenthal et al. (2000), we computed two curves with 1.0, one in combination with the minimum at 4-8 m (Curve 2) and one without it as suggested by Lutz (1999) (Curve 3) (see Fig. 1). Using these extinction laws we computed the effective extinctions /A for the M-type synthetic spectra (Fluks et al. 1994) in the various filters used by the ISOGAL and MSX surveys (Table 2). The ratios /A are not sensitive to the stellar sub-type used. An increase in the ratio from 0.54 to 1.0 results in an increase between 0.15 and 0.20A of the average attenuation in the , and spectral bands. The spectral bands of the and filters are not very sensitive to the intensity of the silicate feature, but to the minimum of the extinction curve in the 4-8 m region. Although /A varies with A, these variations are small compared with those arising from different choices of the mid-infrared extinction law.
In the most obscured regions (A) uncertainties for the ISOGAL and MSX filters range from 0.45 mag () to 0.85 mag (). Because their energy is emitted mostly at near-infrared wavelengths, this has a negligible effect (0.1 mag in average) on the calculated of the SiO targets and, therefore, also on the mass-loss rate estimates (see Sect. 6). In the following we use the Lutz law (Curve 3), since it ensures consistency between mid-infrared and near-infrared stellar colours (Jiang et al. 2003).
3 Interstellar extinction of field stars derived from near-infrared colour-magnitude diagrams
Most of the sources detected by DENIS and 2MASS toward the inner Galaxy are red giants and AGB stars. Because the intrinsic colours of giants are well known and steadily become redder with increasing luminosity, one can study the near-infrared CMDs to estimate the average extinction toward a given line of sight for a population of such stars. This approach has been used to map the extinction in the central region of the Galaxy (°) (Schultheis et al. 1999; Dutra et al. 2003).
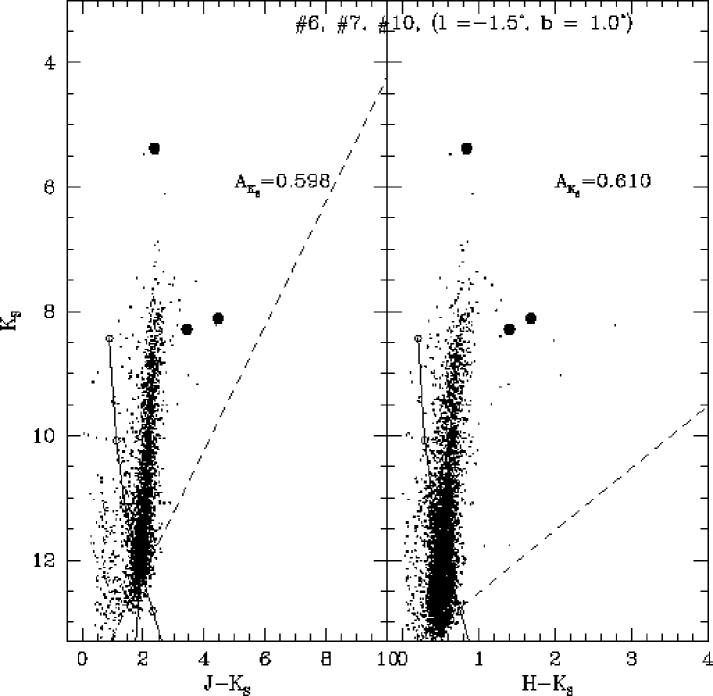
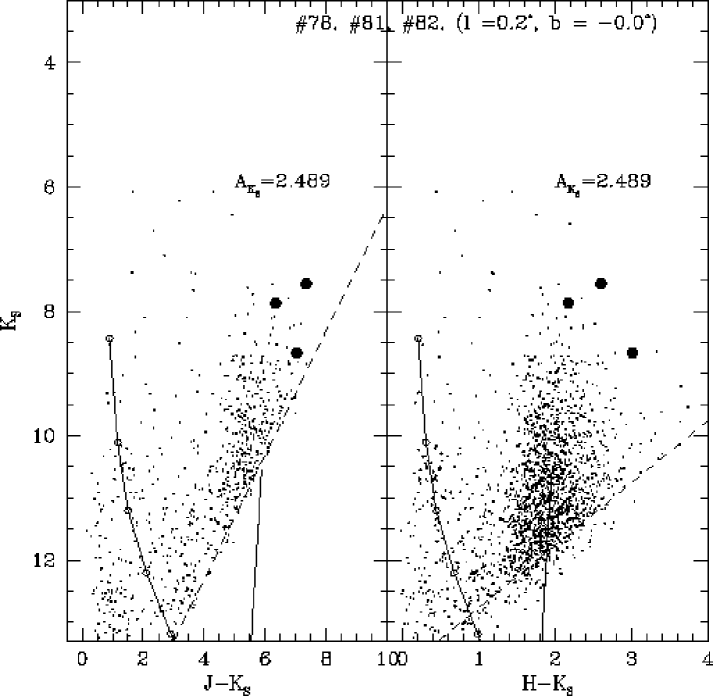
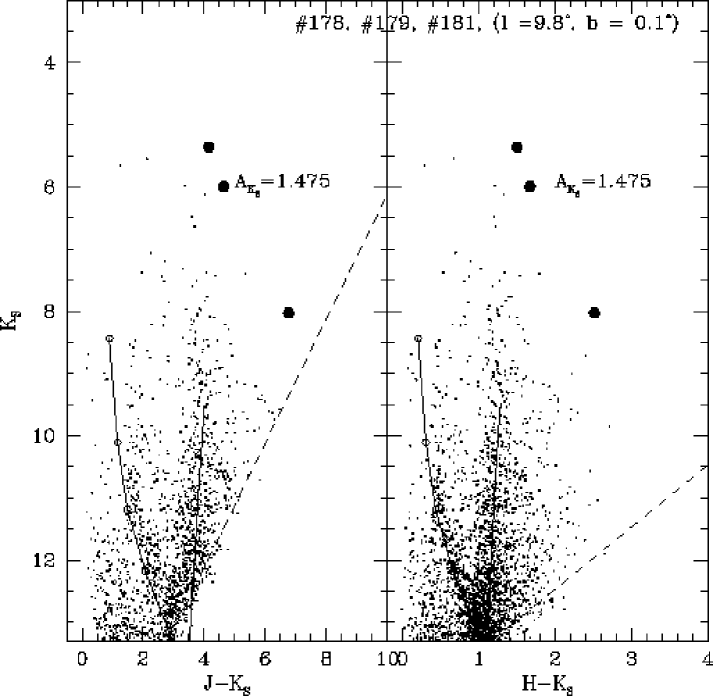
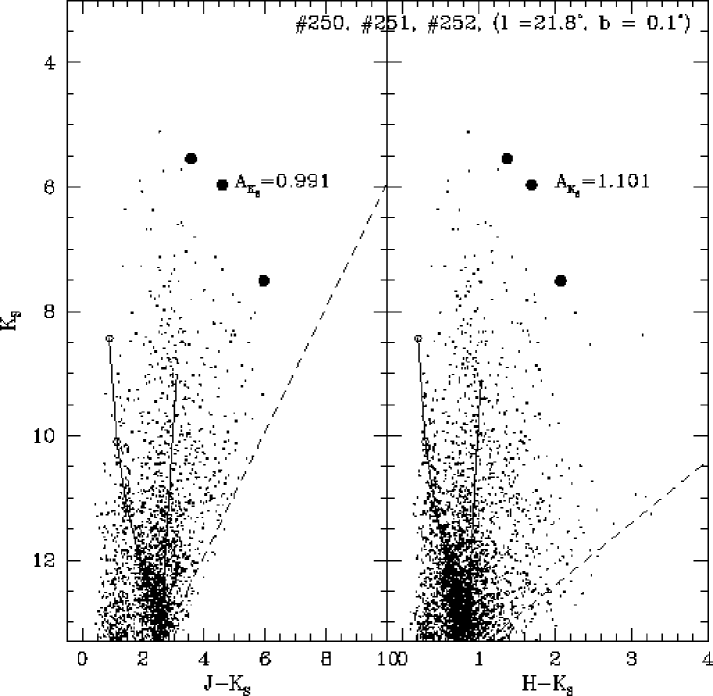
Assuming the SiO target stars to be spatially mixed with the red giant stars, we can similarly estimate extinction, A, toward the 441 SiO targets. In both the (Ks, Ks) and (Ks, Ks) diagrams the colour and magnitude of field stars within a 2-4′ radius from each SiO target were shifted to the reference red giant branch, RGB, (see Sect. 3.1) along the reddening vector. Selection effects due to magnitude limits were taken into account (Sect. 3.2). Median extinction of the field was thereby determined in both the (Ks, Ks) and (Ks, Ks) planes. To exclude foreground stars, an iterative 2 clipping was applied to the extinction distribution (Dutra et al. 2003).
Nearly 90% of the SiO target stars appear redder than their neighbouring field stars (Fig. 2), which implies that the SiO stars are intrinsically obscured, provided their spatial distribution is the same as that of RGB stars.
3.1 Reference red giant branch
Our method for measuring the extinction needs reference to an RGB: we adopted that of 47 Tuc, brought to 8 kpc by adopting a distance modulus of 13.32 (Ferraro et al. 1999). This choice is supported by a recent new near-infrared colour-magnitude analysis of the RGB in globular clusters by Valenti et al. (2004), who obtained photometry taken at the ESO 2.2 m telescope with a spatial resolution of 0.3 and 0.5″ pixel-1, half that of 2MASS. They showed that within 0.05 mag the RGB of 47 Tuc and the metal-rich Bulge globular clusters (such as NGC 6528, NGC 6553, NGC 6540) have identical colours.
In the 2MASS CMD, the upper part (Ks mag) of the 47 Tuc RGB is well represented by a linear fit
| (1) |
in the vs. diagram a second-order polynomial fits well the RGB (Ks mag):
| (2) |
The plane is less sensitive to extinction than the plane: while a colour change of 0.1 in implies a change of 0.05 in A (0.6 in AV), a change of 0.1 mag in implies a change in A. A shift in distance modulus of the reference RGB of mag results in a small change in the extinction of A mag.
| ID | A | tot | Fg | |
|---|---|---|---|---|
| mag | mag | mag | ||
| 1 | 0.96 | 0.18 | 1.63 | |
| 2 | 1.23 | 0.31 | 2.81 | |
| 3 | 1.90 | 0.33 | 1.79 | |
| 4 | 2.16 | 0.52 | 3.00 | |
| 5 | 1.51 | 0.25 | 1.75 | |
| 6 | 0.59 | 0.09 | 1.16 | |
| 7 | 0.57 | 0.07 | 0.51 | |
| 8 | 1.98 | 0.41 | 1.53 | 1 |
| 9 | 2.14 | 0.32 | 2.59 | |
| 10 | 0.61 | 0.11 | 1.48 |
-
∗
The full table is available in electronic form at the CDS via anonymous ftp to cdsarc.u-strasbg.fr (130.79.128.5) or via .
3.2 Determination of extinction value and extinction law in the , , CMD
To properly estimate the interstellar extinction along a given line of sight one should consider only the region of the CMD where the upper RGB is well defined, i.e., not affected by large photometric errors or by the diagonal cut-off from the 2MASS detection limits (see Fig. 2) that would bias the calculation of the median extinction toward a lower value (see also Dutra et al. 2003; Cotera et al. 2000; Figer et al. 2004).
In the inner Galaxy, the photometric error is typically smaller than 0.04 for stars with mag. To quantify the incompleteness due to the diagonal cut-off with zero extinction, our average 2MASS detection limits of and correspond to a RGB Ks magnitude of 15.2 and 13.0 mag, respectively, at a distance of 8 kpc. Accounting for scatter in the observed colours of mag, the RGB would be well sampled to and mag, corresponding to Ks and 12.6, respectively. With a Ks extinction of 3 mag ( mag in , mag in ), which is a typical value toward the Galactic centre, these RGB completeness limits would rise to and 10.8 mag in the and planes, respectively. Therefore only the band can provide a sufficient number of red giant stars to match the reference RGB. With the 2MASS data CMDs are useful for extinction determinations only to a Ks extinction of about 1.6 mag.
For fields with A mag Table 3 lists the extinction values determined from the (Ks,Ks) plane, at larger extinction values those from the (Ks,Ks) plane.

By using both the (Ks,Ks) and (Ks,Ks) planes one can in theory fit the observed field star colours to the RGB and fit both the absolute average band extinction and the index, , of the extinction power law. For this we selected field stars which were detected in , , and Ksand which are brighter than the Ks completeness limits for the RGB at the extinction of each field. For each field we determined the median of the extinctions of the field stars in both the and in the CMDs. The power law index was chosen such that the extinctions agreed in the two planes. For different values of , Fig. 3 shows the differences in median extinction values A(,Ks)A(,Ks) plotted against A. Only for are the two extinction estimates found to be consistent.
3.3 Outside the Bulge
K2 giant stars are the dominant population of late-type stars seen along the galactic disk (e.g. Drimmel et al. 2003; López-Corredoira et al. 2002). They correspond to red clump stars in metal-rich globular clusters such as 47 Tuc. The location of clump stars on the CMD is marked in Fig. 2.
Toward the Bulge, the Bulge RGB population is dominant; therefore, the median interstellar extinction is not affected by possible foreground clump stars. This is not the case in the disk (°), where one must ignore the foreground clump stars before fitting the RGB. As likely clump stars we identify those within 0.3 mag from the Ks colour of the clump trace, and as giants those stars redder than the clump stars (e.g. López-Corredoira et al. 2002).
3.4 Dispersion of the extinctions along a line of sight
Along with the median extinction of the field stars, A, we also determine the standard deviation of the distribution of the individual extinction estimates, . The patchy nature of the extinction is apparent even within the radius sampling area. This patchiness integrated over a longer path generates larger with increasing extinction for Bulge lines of sight. The 1 uncertainty in the field extinction varies from mag when A mag up to mag in the regions with the largest extinction (A). In fields at longitudes longer than 10°, a larger is found than in Bulge fields of similar median extinction. This is probably due to the presence of several Galactic components, e.g. the disk, arms, bar, and molecular ring.
4 Near-infrared properties of known Mira stars
Presently the pulsation periods and amplitudes of our SiO targets are unknown, although most of them must be LAVs (Paper II). This is suggested by photometric variations seen in measurements taken at different times (DENIS, 2MASS and MSX) by the strong 15 m emission (Paper II) and by the SiO maser emission (Paper I).
Although they are 20 times less numerous than semiregular AGB stars (SRs) (Alard et al. 2001), Mira stars are among the best studied pulsating variable stars. They are regular long period variables (LPV) with visual amplitudes larger than 2.5 mag and band amplitudes exceeding mag (LAV stars). Since large amplitudes tend to be associated with the most regular light curves (Cioni et al. 2003), amplitude is the best choice for classifying Mira stars.
To analyse the colours of our SiO targets, in particular to check the quality of the extinction corrections, it is useful to have comparison samples of well studied large amplitude LPV stars with a wide range of intrinsic colours, at low interstellar extinction and at different Galactic positions. Therefore, we examined: two samples of Mira stars in the solar vicinity (Olivier et al. 2001; Whitelock et al. 2000); one sample toward the Galactic Cap taken from Whitelock et al. (1994); 18 Mira stars detected by IRAS (Glass et al. 1995) in the Sgr–I field; 104 IRAS Mira stars in the outer Bulge (Whitelock et al. 1991); and a sample of LPV in the Large Magellanic Cloud (Whitelock et al. 2003). All these stars have IRAS 12 m magnitude [12] and mean magnitudes in the SAAO system (Carter 1990).
Stellar fluxes are given already corrected for reddening only in the work of Olivier et al. (2001). For the LPV stars analysed by Whitelock et al. (2003, 2000, 1994) the effects of interstellar extinction are negligible because these stars are nearby or outside of the Galactic plane, so we did not correct these for extinction. We dereddened the Baade Sgr–I window data (Glass et al. 1995) adopting our favourite extinction curve () and A mag, consistently with the value adopted in Glass et al. (1995). We corrected the magnitudes of the outer Bulge Miras (Whitelock et al. 1991) for reddening adopting values of A derived from their surrounding stars (see next Sect.). Next we analyse the location of these well-known Mira stars in the near-infrared CMDs and colour-colour diagrams.
4.1 Colour-magnitude diagram of outer Bulge Mira stars and surrounding field stars
The outer Bulge LPV stars studied by Whitelock et al. (1991) are particularly interesting for a comparison with our SiO targets because they were selected on the basis of their IRAS fluxes and colours with criteria similar to those used to select our MSX targets (\al@messineo02,messineo03_2; \al@messineo02,messineo03_2). Since their main periods range from 170 to 722 days and their amplitudes from 0.4 to 2.7 mag, they are classical Mira stars. Their distribution of distance moduli, estimated from the period-luminosity relation (Whitelock et al. 1991), peaks at 14.7 mag with a mag. Since they are at latitudes between 6 and 7°, they are in regions of low interstellar extinction. All this makes them ideal for a comparison with our SiO targets, the study of which is complicated by the large interstellar extinction at their low latitudes.
An RGB is clearly apparent in Fig. 4, which shows the 2MASS point sources within 1′ of each Mira star. The median extinction toward each field ranges from A= 0.01 to 0.30 mag with a typical dispersion of 0.01-0.08 mag. On the CMDs the Mira stars appear mostly brighter than the RGB tip of the field stars ( mag at a distance of 8 kpc, see Frogel & Whitford 1987). Due to the presence of a circumstellar envelope, Mira stars have red colours (up to mag) and lie on the red-side of the giant sequence. It is therefore not possible to derive the interstellar extinction toward Mira stars from their colours relative to the RGB.
There is no reason to assume the Mira stars are spatially distributed differently from other giant stars, so that the extinction toward the surrounding field stars may serve as an approximation of that of the respective Mira star. One worry in this assumption is not knowing the actual distribution of extinction along the line of sight.
4.2 Colour-colour diagram of Mira stars
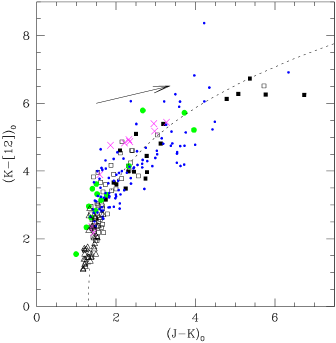
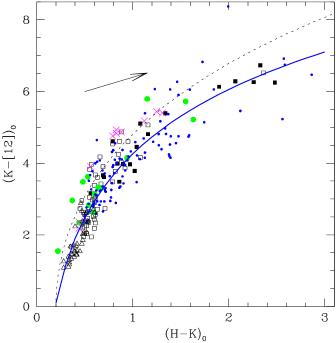
For Mira stars with low mass-loss rate ( M⊙ yr-1), the colours range between 1.2 and 1.6 (Whitelock et al. 2000). Dust-enshrouded IRAS AGB stars with mass-loss rates of M⊙ yr-1 (Olivier et al. 2001) are much redder, with ranging from 2 to 6.5 mag. The overall distribution (Fig. 5) appears to form a sequence of ever redder colours with increasing mass-loss rate, a trend that is well reproduced, e.g., by a model for an M10 type AGB star with increasing shell opacity (Groenewegen & de Jong 1993). Thus, a higher mass loss has the same effect on and colours as more interstellar absorption/reddening, thus making a distinction between intrinsic and interstellar reddening in these colours impossible.
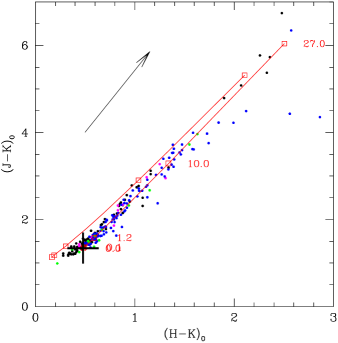
In contrast, in the vs. and the vs. diagrams (Figs. 6 and 7), a separation between interstellar and circumstellar extinction could theoretically be made. However, this is hampered by the large dispersion of the Mira stars around the colour-colour fiducial sequence (0.5 mag), which is due to the non-contemporaneity of the near- and mid-infrared data and to the dependence of such relations on metallicity and stellar spectral type. The uncertainty of interstellar extinction estimates found by shifting a photometry point along the reddening vector onto the curve is larger than AK mag for mag.
In the vs. plane known Mira stars appear to lie below the fiducial colour-colour sequence of IRAS-selected oxygen-rich AGB stars (Fouque et al. 1992; Guglielmo et al. 1993) derived by van Loon et al. (1998). The offset could be due to the band water absorption bands (Frogel & Whitford 1987; Glass et al. 1995) that are found to be strong in LAV stars. However, we did not find a correlation between colour and variability index for these IRAS-selected stars. The offset might also suggest a problem transforming the original ESO photometry of such cold stars in the SAAO system.
Mira stars with mag fit
with an rms deviation of 0.5 mag. Although we use the SAAO system (Carter 1990), in Appendix A we show that this fit is also valid in the 2MASS photometric system.
5 Interstellar extinction and intrinsic colours of the SiO targets

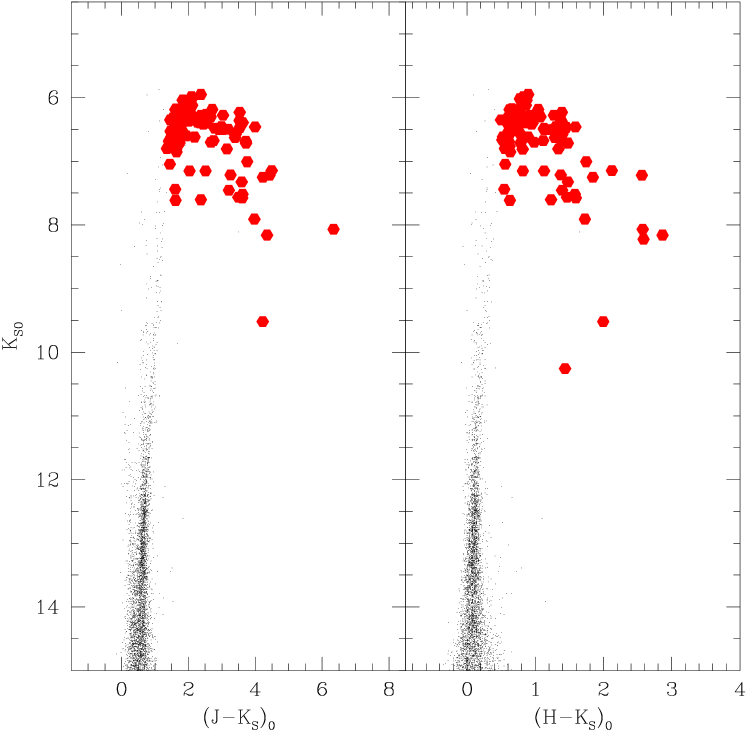
Due to interstellar extinction along the line of sight, for a given Ks, the Ks colours of the SiO targets are much redder than those expected from the colour-colour relation of known Mira stars (upper panels of Fig. 8).
The distribution of the SiO targets in the dereddened diagram (lower panels of Fig. 8) using the “field” extinction values, approaches that of known Mira stars. Therefore, the “field” median extinction is a good approximation of the interstellar extinction for most of the SiO targets. Though the dispersion of individual field star extinctions along a given line of sight is considerable (from 0.1 to 0.8), the distribution is strongly peaked, especially in the Bulge region. Furthermore, the lifetime of a star on the AGB evolutionary phase is very short: it is about % of the time spent on the helium core burning phase and from 0.1 to 2% of the time spent on the main sequence phase of such a star (Vassiliadis & Wood 1993). We therefore expect most AGB stars to be located in the region with the highest stellar density along the line of sight.
There is still an asymmetry in the distribution of the SiO targets around the fiducial colour line of known Miras, which suggests that we could have underestimated the interstellar extinction for part of the sample up to 15%. In regions of high extinction, Mira-like stars are detectable at larger distances than ordinary field stars due to their high near-infrared luminosity. Deeper infrared observations are needed to obtain more accurate extinction estimates (Figer et al. 2004).
5.1 “Foreground objects”
We can measure the total (circumstellar plus interstellar) extinction of each SiO target (Table 3), by assuming a stellar photospheric colour of 1.4 mag and an colour of 0.5 mag (cf. Fig. 5).
The difference between these total extinction estimates and 2MASS and DENIS data gives an rms of A mag, while estimates from 2MASS and colours give an rms difference of AK mag. For only 12 SiO targets we do not have any observed or values to determine the total extinction.
As expected, on average the target stars show larger total extinctions than their surrounding field stars. This is not the case, however, for a group of mostly very bright target stars (Ks ) at various longitudes, marked with flag Fg in Table 3, which have total extinctions lower (a least 1) than the “field” extinction and are therefore likely to be foreground objects. We dereddened the “foreground objects” by directly shifting them on the colour-colour sequence.
6 Intrinsic colours and mass-loss rates
The stellar mass-loss rate is best estimated from measurements of CO rotational lines. The CO emission arises in the circumstellar shell. However, because of confusion with interstellar CO emission, it is difficult to obtain such measurements toward stars in the inner Galaxy (Winnberg et al. 1991). Although infrared emission also arises in the stellar photosphere, stellar outflows may be studied using the infrared emission of dust grains that form in the cool circumstellar envelopes. Relations between the infrared colours (e.g. , , or ) of O-rich AGB stars and their mass-loss rate have been established empirically (e.g. Whitelock et al. 1994; Olivier et al. 2001; Alard et al. 2001) and supported by theoretical models (e.g. Groenewegen & de Jong 1993; Ivezíc et al. 1999; Jeong et al. 2003; Ojha et al. 2003).
The empirical relation between the colour and mass loss rate, , is very useful to study stars detected in the 2MASS or DENIS surveys and in the ISOGAL or MSX surveys toward the most obscured regions of the Galaxy.
The uncertainties arising from the variability of the stars and the temporal difference between the Ks and 15m measurements are somewhat alleviated by using an average of the 2MASS and DENIS Ks fluxes and of the ISOGAL and MSX 15m measurements. The remaining r.m.s. uncertainty of the mass-loss rate is thus a factor 2 for M⊙ yr-1 (Ojha et al. 2003).
Following the prescription of Jeong et al. (2003) and Ojha et al. (2003) we obtained mass-loss rates for the SiO targets, the distribution of which is shown in Fig. 9. 90% of the sources have implied mass-loss rates between and M⊙ yr-1, with a peak in the range – M⊙ yr-1, although the apparent distribution is widened by the uncertainty of the mass-loss–colour relation, by the photometric uncertainty, and by the effects of variability.
Our selection criterion on (Ks for the ISOGAL sample completely eliminated sources with , while the elimination of OH/IR sources and the criteria on and colours for the MSX sample also considerably reduced the proportion of sources with large mass-loss rates (see \al@messineo03_2,messineo02; \al@messineo03_2,messineo02, ). The same results are obtained considering the subsample of targets with the best extinction corrections, i.e. with mag. Furthermore, the distribution of the mass-loss rates of the targets with detected SiO maser emission appears similar to those without detected SiO (Paper I).
A possible underestimation of the interstellar extinction results in an overestimation of the mass-loss rate. Adopting Mathis’ mid-infrared extinction law rather than Luts’s, the distribution of the mass-loss rates only slightly shifts toward lower values (see Fig. 9).

7 Conclusion
We estimated the interstellar extinction toward 441 SiO maser AGB stars. From the 2MASS stars within 2-4′ of each SiO star, we estimated a mean extinction toward the SiO stars. We therefore shifted the colours of field stars and versus magnitudes along the reddening vector onto the reference RGB. The use of both colour-magnitude planes enabled us to obtain a mean extinction for each field and new constraints on the index of the near-infrared extinction power law . We found that a value of is inconsistent with the colours of inner Galactic stars, and by taking 47 Tuc as a reference for the RGB we find .
For Ks-band extinctions larger than 1.6 mag the 2MASS CMD provides extinction estimates that are too low due to a selection effect from the -band dropout of more distant sources. The 2MASS () CMD suffers less from this bias.
We reviewed near- and mid-infrared dereddened colour-colour relations of Mira stars and use them to test the quality of the extinction corrections for each SiO target. Under the assumption that the SiO target stars are spatially distributed similar to the surrounding field stars, we corrected the photometric measurements of the SiO targets by adopting the median extinction of their surrounding field stars. The derredened colours of the SiO targets are not symmetrically distributed around the fiducial colour-colour line of known Mira stars, which suggests that for part of the SiO targets we may still be underestimating the interstellar extinction by up to 15%. About 50 SiO targets lie significantly in the “foreground” of the mean stellar distribution.
Using the relation between mass-loss rate and (Ks colour given by Jeong et al. (2003), we estimated that most of the SiO targets have mass-loss rates in the range 10-7 to 10-5 M⊙ yr-1.
Acknowledgements.
The MSX transmission curves were kindly provided by M. Egan. MM thanks P. Popowski, J. van Loon, S. Ganesh, and M. Schultheis for useful discussions about interstellar extinction, and M. Sevenster for her constructive criticism. This paper uses and partly depends on the studies of Mira stars conducted at the SAAO observatory by P. Whitelock and her collaborators. This publication makes use of data products from the IRAS data base server, from the Two Micron All Sky Survey, from the DEep Near-Infrared Survey of the southern sky, from the Midcourse Space Experiment, and from the SIMBAD data base. The work of MM was funded by the Netherlands Research School for Astronomy (NOVA) through a netwerk 2, Ph.D. stipend.References
- Alard et al. (2001) Alard, C., Blommaert, J. A. D. L., Cesarsky, C., et al. 2001, ApJ, 552, 289
- Blommaert et al. (2003) Blommaert, J. A. D. L., Siebenmorgen, R., Coulais, A., et al., eds. 2003, The ISO Handbook, Volume II - CAM
- Cardelli et al. (1989) Cardelli, J. A., Clayton, G. C., & Mathis, J. S. 1989, ApJ, 345, 245
- Carpenter (2001) Carpenter, J. M. 2001, AJ, 121, 2851
- Carter (1990) Carter, B. S. 1990, MNRAS, 242, 1
- Cioni et al. (2003) Cioni, M.-R. L., Blommaert, J. A. D. L., Groenewegen, M. A. T., et al. 2003, A&A, 406, 51
- Cotera et al. (2000) Cotera, A. S., Simpson, J. P., Erickson, E. F., et al. 2000, ApJS, 129, 123
- Cutri et al. (2003) Cutri, C. M., Skrutskie, M. F., & Van Dyk, S. 2003, on line at http://www.ipac.caltech.edu/2mass/
- Draine & Lee (1984) Draine, B. T. & Lee, H. M. 1984, ApJ, 285, 89
- Drimmel et al. (2003) Drimmel, R., Cabrera-Lavers, A., & López-Corredoira, M. 2003, A&A, 409, 205
- Dutra et al. (2003) Dutra, C. M., Santiago, B. X., Bica, E. L. D., & Barbuy, B. 2003, MNRAS, 338, 253
- Egan et al. (1999) Egan, M. P., Price, S. D., Moshir, M. M., et al. 1999, AFRL-VS-TR-1999, 1522
- Epchtein et al. (1994) Epchtein, N., de Batz, B., Copet, E., et al. 1994, Ap&SS, 217, 3
- Ferraro et al. (1999) Ferraro, F. R., Messineo, M., Fusi Pecci, F., et al. 1999, AJ, 118, 1738
- Figer et al. (2004) Figer, D. F., Rich, R. M., Kim, S. S., Morris, M., & Serabyn, E. 2004, ApJ, 601, 319
- Fluks et al. (1994) Fluks, M. A., Plez, B., The, P. S., et al. 1994, A&AS, 105, 311
- Fouque et al. (1992) Fouque, P., Le Bertre, T., Epchtein, N., Guglielmo, F., & Kerschbaum, F. 1992, A&AS, 93, 151
- Frogel & Whitford (1987) Frogel, J. A. & Whitford, A. E. 1987, ApJ, 320, 199
- Glass (1999) Glass, I. S. 1999, Handbook of infrared astronomy
- Glass et al. (1995) Glass, I. S., Whitelock, P. A., Catchpole, R. M., & Feast, M. W. 1995, MNRAS, 273, 383
- Groenewegen & de Jong (1993) Groenewegen, M. A. T. & de Jong, T. 1993, A&A, 267, 410
- Guglielmo et al. (1993) Guglielmo, F., Epchtein, N., Le Bertre, T., et al. 1993, A&AS, 99, 31
- Ivezíc et al. (1999) Ivezíc, Z., Nenkova, M., & Elitzur, M. 1999, User Manual for DUSTY (Lexington: Univ. Kentucky)
- Jeong et al. (2003) Jeong, K. S., Winters, J. M., Le Bertre, T., & Sedlmayr, E. 2003, in ASSL Vol. 283: Mass-Losing Pulsating Stars and their Circumstellar Matter, 139
- Jiang et al. (2003) Jiang, B. W., Omont, A., Ganesh, S., Simon, G., & Schuller, F. 2003, A&A, 400, 903
- López-Corredoira et al. (2002) López-Corredoira, M., Cabrera-Lavers, A., Garzón, F., & Hammersley, P. L. 2002, A&A, 394, 883
- Landini et al. (1984) Landini, M., Natta, A., Salinari, P., Oliva, E., & Moorwood, A. F. M. 1984, A&A, 134, 284
- Lutz (1999) Lutz, D. 1999, in ESA SP-427: The Universe as Seen by ISO, Vol. 427, 623
- Lutz et al. (1996) Lutz, D., Feuchtgruber, H., Genzel, R., et al. 1996, A&A, 315, L269
- Mathis (1990) Mathis, J. S. 1990, ARA&A, 28, 37
- Mathis (1998) Mathis, J. S. 1998, ApJ, 497, 824
- Messineo (2004) Messineo, M. 2004, Ph.D. Thesis, astro-ph/0407559
- Messineo et al. (2004) Messineo, M., Habing, H. J., Menten, K. M., Omont, A., & Sjouwerman, L. O. 2004, A&A, 418, 103 (Paper II)
- Messineo et al. (2002) Messineo, M., Habing, H. J., Sjouwerman, L. O., Omont, A., & Menten, K. M. 2002, A&A, 393, 115 (Paper I)
- Ojha et al. (2003) Ojha, D. K., Omont, A., Schuller, F., et al. 2003, A&A, 403, 141
- Olivier et al. (2001) Olivier, E. A., Whitelock, P., & Marang, F. 2001, MNRAS, 326, 490
- Omont et al. (2003) Omont, A., Gilmore, G. F., Alard, C., et al. 2003, A&A, 403, 975
- Price et al. (2001) Price, S. D., Egan, M. P., Carey, S. J., Mizuno, D. R., & Kuchar, T. A. 2001, AJ, 121, 2819
- Rieke & Lebofsky (1985) Rieke, G. H. & Lebofsky, M. J. 1985, ApJ, 288, 618
- Rosenthal et al. (2000) Rosenthal, D., Bertoldi, F., & Drapatz, S. 2000, A&A, 356, 705
- Schuller et al. (2003) Schuller, F., Ganesh, S., Messineo, M., et al. 2003, A&A, 403, 955
- Schultheis et al. (1999) Schultheis, M., Ganesh, S., Simon, G., et al. 1999, A&A, 349, L69
- Udalski (2003) Udalski, A. 2003, ApJ, 590, 284
- Valenti et al. (2004) Valenti, E., Ferraro, F. R., & Origlia, L. 2004, MNRAS, 351, 1204
- van de Hulst (1946) van de Hulst, H. C. 1946, Optics of spherical particles. (Amsterdam, Drukkerij J. F. Duwaer, 1946.), 1
- van Loon et al. (2003) van Loon, J. T., Gilmore, G. F., Omont, A., et al. 2003, MNRAS, 338, 857
- van Loon et al. (1998) van Loon, J. T., Zijlstra, A. A., Whitelock, P. A., et al. 1998, A&A, 329, 169
- van Loon et al. (1997) van Loon, J. T., Zijlstra, A. A., Whitelock, P. A., et al. 1997, A&A, 325, 585
- Vassiliadis & Wood (1993) Vassiliadis, E. & Wood, P. R. 1993, ApJ, 413, 641
- Wainscoat et al. (1992) Wainscoat, R. J., Cohen, M., Volk, K., Walker, H. J., & Schwartz, D. E. 1992, ApJS, 83, 111
- Whitelock et al. (1991) Whitelock, P., Feast, M., & Catchpole, R. 1991, MNRAS, 248, 276
- Whitelock et al. (2000) Whitelock, P., Marang, F., & Feast, M. 2000, MNRAS, 319, 728
- Whitelock et al. (1994) Whitelock, P., Menzies, J., Feast, M., et al. 1994, MNRAS, 267, 711
- Whitelock et al. (2003) Whitelock, P. A., Feast, M. W., van Loon, J. T., & Zijlstra, A. A. 2003, MNRAS, 342, 86
- Winnberg et al. (1991) Winnberg, A., Lindqvist, M., Olofsson, H., & Henkel, C. 1991, A&A, 245, 195
Appendix A SAAO and 2MASS colours and magnitudes
Transformation equations between the colours and magnitudes measured in the SAAO Carter (1990) and 2MASS photometric systems have been derived by Carpenter (2001) using a list of mostly blue 94 photometric standards. Figure 12 in Carpenter (2001) shows that the differences between magnitudes and colours obtained with the two systems are smaller than 0.15 mag.
Considering that Mira stars typically have a pulsation amplitude in the near-infrared of 1-2 mag and that 2MASS data are from a single-epoch observation randomly taken with respect to the stellar phase, the system transformations only have a secondary effect on the total colour and magnitude uncertainty, when comparing data from 2MASS with data taken with the SAAO telescope. However, since Mira stars are cold objects, we must exclude the idea that a combination of molecular bands and filter transmissions could generate a different colour transformation for this special class of objects. We therefore looked for 2MASS counterparts of the 104 outer Bulge Mira stars monitored by Whitelock et al. (1994). Mira stars are among the brightest objects detected in the band such that identification of their 2MASS counterparts is straightforward (Paper II) (only three sources were excluded because they had no unique counterparts).
Differences between the mean magnitudes obtained with SAAO observations (Whitelock et al. 1991) and the single-epoch 2MASS data have a dispersion of up to 0.8 mag and the following mean differences:
The colour-colour relations described in Sect. 4 using SAAO photometry also describe the 2MASS sequence of Mira stars well.
Appendix B IRAS and MSX filters
Most of the past work was carried out using IRAS photometry; therefore, the currently available colour-colour relations of Mira stars use mid-infrared data from the IRAS catalogue. A comparison of mid-infrared filters is therefore mandatory when translating old findings into new MSX and ISOGAL colours.

Figure 10 shows the difference between MSX magnitudes
and IRAS 12 m magnitude for the SiO targets. Note that the
filter excludes the silicate feature around 9.7 m, while and
filters include part of it (see Fig. 1).
Therefore the ( colour shows a dependence on the ()
colour, which increases when the silicate feature at 9.7 m starts
to be self-absorbed. The () and () colours do not
show any trend with the () colour. Due to both uncertainties of
photometric measurements and source variability, scatter is large;
however we derived relations between the , , and and the
[12] magnitudes, as follow:
mag
mag
mag.