How To Distinguish Neutron Star and Black Hole X-ray Binaries? Spectral index and Quasi-Periodic Oscillation Frequency Correlation
Abstract
Recent studies have revealed strong correlations between 1-10 Hz frequencies of quasiperiodic oscillations (QPOs) and the spectral power law index of several Black Hole (BH) candidate sources when seen in the low/hard state, the steep power-law (soft) state, and in transition between these states. In the soft state these index-QPO frequency correlations show a saturation of the photon index at high values of the low frequency . This saturation effect was previously identified as a black hole signature. In this paper we argue that this saturation does not occur, at least for one neutron star (NS) source 4U 1728-34, for which the index monotonically increases with to the values of 6 and higher. We base this conclusion on our analysis of Msec of RXTE archival data for 4U 1728-34. We reveal the spectral evolution of the Comptonized blackbody spectra when the source transitions from the hard to soft states. The hard state spectrum is a typical thermal Comptonization spectrum of the soft photons which originate in the disk and the NS outer photospheric layers. The hard state photon index is . The soft state spectrum consists of two blackbody components which are only slightly Comptonized. Thus we can claim (as expected from theory) that in NS sources thermal equilibrium is established for the soft state. To the contrary in BH sources, the equilibrium is never established due to the presence of the BH horizon. The emergent BH spectrum, even in the high/soft state, has a power law component. We also identify the low QPO frequency as a fundamental frequency of the quasi-spherical component of the transition layer (presumably related to the corona and the NS and disk magnetic closed field lines). The lower frequency is identified as the frequency of oscillations of a quasi-cylindrical configuration of the TL (presumably related to the NS and disk magnetic open field lines). We also show that the presence of Fe Kα emission-line strengths, QPOs, and the link between them does not depend on radio flux in 4U 1728-34.
1 Introduction
One of the basic questions addressed in many observational and theoretical studies is how can one observationaly distinguish a neutron star from a black hole. Before the Rossi X-ray Timing Explorer (RXTE) era most of the efforts to identify black hole (BH) and neutron star (NS) were primarily concentrated on the observations of features in the energy spectra of these objects. However, one attempt to use timing behavior to identify the nature of compact object can be mentioned. Specifically, QPO phenomena discovered in some of the bright low mass X-ray binaries (LMXBs) in the 6-60 Hz range by EXOSAT (see e.g. van der Klis et al. 1985) were considered to be NS signatures and were interpreted as that time as a beat effect between the inner edge of an accretion disk and a neutron star magnetosphere (Alpar & Shaham 1985, see also Lamb et al. 1985).
The first attempts to look for the effect of the presence or absence of a surface on the spectrum concentrated on comparing BH and NS stars in the high/soft state when the mass accretion rate in the source is presumably high. Chakrabarti & Titarchuk (1995), hereafter CT95, Titarchuk, Mastihiadis & Kylafis (1996), (1997), hereafter TMK96, TMK97 respectively, Titarchuk & Zannias (1998), hereafter TZ98, and Laurent & Titarchuk (1999, 2001), hereafter LT99, LT01 respectively, argue that in BHs the specific extended power-law spectrum is formed with a photon index of 2.5-2.7 (depending on the plasma temperature of the accretion flow) due to the bulk motion Comptonization in the converging flow into the BH. On the other hand, in a high mass accretion rate NS, the emergent spectrum acquires blackbody like shape (see LT99 and TMK96).
Narayan, Garcia & McClintock (1997, 2002) and Garcia et al. (2001) introduced the idea of comparing the NS and BH in quiescence. They suggested that the advection dominated flow (ADAF) into a black hole is radiatively inefficient. Hence, the NS boundary layer should be more luminous with respect to BH for the same mass accretion rate. However, while NSs are somewhat more luminous than BH systems, the difference is not nearly as large as predicted by the ADAF models (Menou et al., 1999).
Titarchuk & Zannias (1998) calculated the space distribution of the high energy photons produced in the converging flow by the bulk motion Comptonization. Later LT01 confirmed that this distribution peaks between 2 and 3 Schwarzchild radii, . This result led them to the prediction that any high frequency oscillation occurring in the innermost part of the accretion disk should be seen as a quasi-periodic oscillation (QPO) of the high energy emission from converging flow (the extended power law) but not as a QPO of the soft blackbody emission of the accretion disk. This is to be expected because the effective area of the soft X-ray disk emission, is at least of one order of magnitude larger than that of the innermost part of the disk, . Thus the QPOs of 100-200 Hz frequencies are seen as the oscillations of the extended steep power-law component, and should be considered to be a BH signature. This consequence of the Bulk motion Comptonization is supported by the observational correlation of the extended power law with the high frequency QPOs (see details of the observations in a review by McClintock & Remillard 2003).
Sunyaev & Revnitsev (2000) and Belloni, Psaltis & van der Klis (2002) suggested that one could discriminate between NS and BH systems using their timing signatures. Particularly, Sunyaev & Revnitsev (2000) analyzed a sample of 9 NS and 9 BH in the low/hard spectral states and presented observational evidence that in the PDS of accreting neutron stars with weak magnetic field significant power is contained at frequencies close to one kHz. For most Galactic black holes, the power spectrum demonstrates a strong decline at frequencies higher than 10-50 Hz. Using the data analysis of power spectra of NS and BH sources Belloni, Psaltis & van der Klis (2002) found that all characteristic frequencies are lower in the case of the BH, probably reflecting the mass dependence of the dynamical timescale in accretion flow (see more evidence of this mass scaling of QPO frequencies in Titarchuk & Fiorito 2004, hereafter TF04). Another important effect should be noted. Homan et al. (2003) found that the power of the high-frequency QPOs ( Hz) is comparable and even sometimes higher than that of the low-frequency QPOs ( Hz) during the transition from low/hard to high/soft states of BH sources. For this transitional state they reported the detection of the QPO high frequency at 250 Hz in black hole transient XTE J1650-500 and also found that its strength changed with the total count rate in the 2.5-60 keV band. The QPO power also increased with energy with rms amplitudes of %, % and % respectively in 2-6.2, 6.2-15.0 and 15.0-60 keV bands (see Fig. 2 in Homan et al. 2003).
The well-known absence of type I X-ray bursts in BH candidate sources leads Narayan & Heyl (2002) to conclude that these sources have event horizons. They have carried out a linear stability analysis of the accumulating fuel on the surface of a compact star to identify the conditions under which thermonuclear bursts are triggered. It is also shown that, if BH candidates had surfaces, they would very likely exhibit instabilities similar to those that lead to type I bursts on neutron stars.
In early spectral studies of BHs, and the identification of the BH signatures by Shrader & Titarchuk (1998), (1999), (2003), Borozdin et al. (1999), and Titarchuk & Shrader (2002), the authors stated that, in the high/soft states, the keV thermal emission along with the steep power-law tail of the photon index 2.5-2.7 are the observational evidence of the BH signature. This particular spectral BH signature was predicted by CT95, TMK96, TMK97, TZ98, LT99, LT01 using the extensive radiative transfer calculations of soft (disk) photon Comptonization in the advection dominated converging flows onto black hole and neutron stars. Furthermore, recently Done, & Gierlinski, (2003) compiled a large sample of high-quality data from RXTE Proportional Counter Array (PCA) observations of BHs and low-magnetic-field NSs (atolls and Z sources) and showed that the source evolution as a function of luminosity is very different depending on the nature of the compact object. They also reported a spectral state that is only seen in BH systems when the sources are bright. In this state the thermal emission, presumably, from a low temperature disc dominates, but also a steep power-law tail to high energies is observed. They argue that this is a unique signature for any new transient to be identified as a black hole. In fact, the Done & Gierlinski’s (2003) study supports our conclusions regarding uniqueness of this black hole signature. They come to the same conclusions regarding the spectral BH signature as the thermal emission along with the steep power-law tail in the high/soft state of the source.
In the context of drawing a distinction between NS and BH sources we would like to point out the recent paper by Torrejon et al. (2004) who offered a new method of identification of neutron star systems using a temperature-luminosity relation. The source can only be a NS if a soft blackbody-like component with the color temperature of order of 1 keV is observed in the spectrum of the low/hard state. On the contrary, such a high temperature is necessarily related to a high disk luminosity in the case of a BH and this case is never observed for BHs in the low hard state. In fact, the low/hard state spectra are similar for BH and NS sources. Both of them are fitted by Comptonization spectra with the index in the range of 1.5-1.8 and with the electron temperatures of the Comptonizing medium in the range of 30-60 keV. Torrejon et al. (2004) applied this new method for identification for a NS in the non-pulsating massive X-ray binary 4U2206+54.
However, one can argue that similar spectra consisting of thermal emission and a steep power-law tail of the photon index 2.7 can be observed in NS sources. In fact, this type of spectra have been detected from Sco X-1 using X-ray observations from rockets in the very beginning of X-ray Astronomy (see Morrison 1967) and confirmed 30 years later by Strickman & Barret (1997) using GRO and RXTE observations of Sco X-1. It is worth noting that this photon index 2.7 is only one value which is necessarily indicative of saturation level observed in BHs (see Vignarca et al. 2003 and TF04).
Thus, to reveal the nature of a compact object, one has to study the evolution of the source X-ray spectra as a function of luminosity (or mass accretion rate), but not just the evolution of the color-color diagram [cf. Done & Gierlinski (2003)]. The actual difference in the BH and NS spectra should be expected in the high state when the thermal equilibrium is established and a blackbody spectrum is formed in NS sources due to the presence of solid surface. This thermal equilibrium condition is never satisfied for a BH because of the event horizon. In this paper we present a comprehensive spectral and timing analysis of archival RXTE data from the NS source 4U 1728-34 in order to establish the spectral evolution of the source as a function of luminosity and its timing characteristics of the power spectrum (PDS).
Recent studies by Vignarca et al. (2003) and TF04 have revealed strong correlations between low frequency QPOs (1-10 Hz) and the spectral power law index of several Black Hole candidate sources when seen in the low/hard state, the steep power-law (soft) state, or in transition between these states. The observations support the notion that the presence of a power-law component in the low/hard state spectrum is related to simultaneous radio emission, which, in turn, indicates the probable presence of a jet [see e.g. Mirabel et al. (1998); Klein-Wolt et al. (2002)].
TF04 show that the observed low frequency QPO - spectral index correlation is a natural consequence of an adjustment of the Keplerian disk to the innermost sub-Keplerian boundary conditions near the central object. This ultimately leads to the formation of the sub-Keplerian transition layer (TL) between the adjustment radius and the innermost boundary (the horizon for BH) [see details of the transition layer model (TLM) in Titarchuk, Lapidus & Muslimov (1998), hereafter TLM98]. In the framework of TLM the low frequency is related to the magnetoacoustic oscillation frequency . Using a relation between , the mass accretion rate, the photon index and the mass accretion rate TF04 infer a correlation between and the spectral photon index . TF04 present strong arguments that in BHs the two particular distinct phases occur in which one of them, the steep power-law phase is the signature of a BH. They also found that a hard state (related to an extended Compton cloud) is characterized by the photon index at about 1.7 and the low QPO frequencies below 1 Hz. This is the regime where thermal Comptonization dominates the upscattering of soft disk photons and the spectral shape (index) is almost independent of mass accretion rate. TF04 find that the soft state is related to the very compact region where soft photons of the disk are upscattered to form the steep power law spectrum with photon index saturating at about 2.8. This is the regime where Bulk Motion Comptonization dominates and the effect of an increase in the mass accretion is offset by the effect of photon trapping in the converging flow into the BH.
In this Paper we study the low frequency-index correlation for a NS source 4U 1728-34. We find that this correlation is different from that was previously found in BH sources (see TF04 and Vignarca et al. (2003) where the low frequency-index correlation is presented for large samples of BH sources). In PDSs observed by the RXTE for 4U 1728-34, Ford & van der Klis (1998, hereafter FV98) discovered low-frequency Lorentzian (LFL) oscillations with frequencies between 10 and 50 Hz. These frequencies as well as the break frequency were shown to be correlated with high frequency QPO peaks (FV98). We also note that nearly coherent (burst) oscillations with frequency Hz was discovered by for Strohmayer et al. (1996) during the type I X-ray bursts in this source. Titarchuk, & Osherovich (1999) presented a model for the radial oscillations and diffusion in the TL surrounding the neutron star. Titarchuk & Osherovich, using dimensional analysis, have identified the corresponding radial oscillation and diffusion frequencies in the TL with the low-Lorentzian and break frequencies for 4U 1728-34. They predicted values for related to the diffusion in the boundary layer, that are consistent with the observed . Both the Keplerian and radial oscillations, along with diffusion in the transition layer, are controlled by the same parameter: the Reynolds number , which in turn is related to the accretion rate (see also TLM98). It is worth noting that the nature of the break frequency as a diffusion effect (the inverse of time of the diffusion propagation in the bounded configuration) was later corroborated by Wood et al. (2001) and Gilfanov & Arefiev (2005). Particularly, Wood et al. demonstrated that in BHC XTE 1118+480 X-ray light curves with fast rise/exponential decay profile are a consequence of the diffusion matter propagation in the disk. On the other hand, Gilfanov & Arefiev studied X-ray variability of persistent LMXBs in the Hz frequency range aiming to detect features in their PDS associated with diffusion time scale of the accretion disk . As this is the longest intrinsic time scale of the disk, the power spectrum is expected to be independent of the frequencies less than . They found that the break frequency correlates very well with the binary orbital frequency in a broad range of binary periods min - 33.5 days, in accord with theoretical expectations for the diffusion time scale of the disk.
The observational signature of the mass accretion rate is the QPO low frequency as has been shown for BH sources by TF04. The QPO frequency is not only related to but also the size of the Comptonizing region, i.e. . The behavior of with respect to spectral index connects the characteristics of the Comptonization and spectral state with . This is graphically represented for BHs in the observations of Vignarca et al. (2003). We will similarly employ this type of data to compare NS spectral states with BHs to show their qualitative differences.
In §2 we present the details of the our spectral and timing data analysis of archival RXTE data from the NS source 4U 1728-34. In §3 we present and discuss the results of the data analysis and we compare them to that presented by TF04 for BH sources. In §4 we offer an explanation of the pair of QPO low frequencies detected in 4U 1728-34. A link between Fe Kα emission-line strength and QPO frequencies in 4U 1728-34 is presented and disk-jet coupling in X-ray binaries is discussed in §5. Conclusions follow in §6.
2 Observations and data analysis
We analyzed the data collected by PCA (Jahoda et al. 1996), the main instrument on board the RXTE. Observational RXTE data for 4U 1728-34 that are available through the GSFC public archive 111http://heasarc.gsfc.nasa.gov. Data reduction and analysis was conducted with FTOOLS 5.3 software according to the recipes from “RXTE Cook Book”.
The summary of the RXTE observation proposals and data used in the presented analysis is given in Table 1. Each proposal consists of a set observations that can be divided into intervals of continuous on-source exposure (usually about 3 ks) corresponding to one RXTE orbit. For each proposal we provide its archival identification number (proposal ID), the dates between which the data were collected, the total on-source exposure, the number of observations in the proposal , the number of continuous data intervals , the average number of operational PCUs in the proposal and a set of references related to the timing analysis of the persistent flux of 4U 1728-34. The data collected during the first two years of RXTE operation have been the main focus of the data analysis and interpretation (see Strohmayer et al. 1996; Ford & van der Klis 1998; van Straaten et al. 2002; Di Salvo et al. 2001; Mendez, van der Klis & Ford 2001; Jonker, Mendez & van der Klis 2000). Timing analysis of 4U 1728-43 data from years 1999, 2000 and 2001 was presented in Migliari, van der Klis & Fender (2003) where the authors studied correlation between the source timing properties and its position on color-color diagram. The overall exposure of the data used is ks.
We calculated an energy spectrum and an averaged PDS for each continuous interval of data (excluding X-ray bursts), which correspond to one orbital RXTE revolution. First we performed the data screening to calculate good time intervals for Fourier analysis. We excluded the data collected for elevation angles less than and during South Atlantic Anomaly passage. To avoid the electron contamination we also applied the condition for electron rate in the PCU 2 (which is operational during all observations) to be less than 0.1. The data was rebinned to second time resolution to obtain Nyquist frequency of 2048 Hz. Individual PDS were calculated for each consecutive 8 second intervals, and then was averaged to obtain a final PDS for the entire continuous interval. The PDS are normalized to give rms fractional variability per Hz. Noise level is calculated between 1500 and 2000 Hz where no source variability is expected and is subtracted before applying any model fitting. For the PDS modeling we used the broken power law (see van Straaten et al., 2000, for definition) component to fit broad band frequency noise and Lorentzians to describe QPO profiles.
We extract energy spectra from Standard2 data files using counts from upper xenon layer of all operational detectors. For the PDS calculation we used high resolution Event data mode which comprises counts from all layers of all detectors which are on during a particular observation. Spectral fitting was performed using the XSPEC astrophysical fitting package.
To describe the shape of outgoing spectrum we use the BMC XSPEC model (Titarchuk et al. 1997) for both the NS and disk components. The BMC model spectrum is the sum of the (disk or NS) black-body component and Comptonized black-body component. It has four parameters: is a color temperature of thermal photon spectrum, is the energy spectral index (, where is the photon index), the parameter related to the weight of the Comptonized component, , and a normalization of the blackbody component.
The radiation from central object and inner parts of accretion disk is Comptonized by a surrounding cloud. As long as the spectral index for each BMC model is a physical characteristic of the Comptonized region (i.e. the Compton cloud), we tie these parameters together for the BMC models describing disk and NS spectral components. We found during fitting procedure that the relative weight of the Comptonized component is very close to one, in other words that all radiation from NS and inner disk passing through the cloud and get Comptonized. Thus, we freeze log A parameter at 5.0 to ensure this equality is satisfied. We also add a Gaussian of energy 6.4 keV, which is presumably due to an iron emission line. We use a fixed hydrogen column of provided by HEASARC [see Dickey & Lockman (1990) for details] to model Galactic absorption. Consequently the XSPEC model for the spectral fitting reads as WABS(GAUSSIAN+BMC+BMC) and we use , the NS and disk color temperatures, the NS and disk blackbody normalizations as free parameters of the spectral continuum model. The spectral fits was obtained using 3.5-30.0 keV energy range. We add 1% error to the data to account for systematic uncertainty in the PCA calibration. The typical quality of fit is good with in the range of 0.3-0.9, and more than 90% of fits having in the range 0.7-0.9.
3 Data analysis results. The spectral evolution and index-frequency correlation and in 4U 1728-34
The evolution of spectral properties of the source during the transition from low/hard to high/soft state is shown on Figures 1 and 2. The temperature profiles of two BMC spectral components are plotted versus break frequency in Figure 1. The higher temperatures presented by filled circles are presumably related to the Comptonized NS blackbody component which color temperature reaches keV for the hardest states ( Hz). For between 2 and 8 Hz, it softens steeply to keV and levels off at this value for break frequencies higher than 10 Hz. The soft (disk) color temperature changes only slightly, decreasing from keV in the low/hard state to keV in the high/soft state.
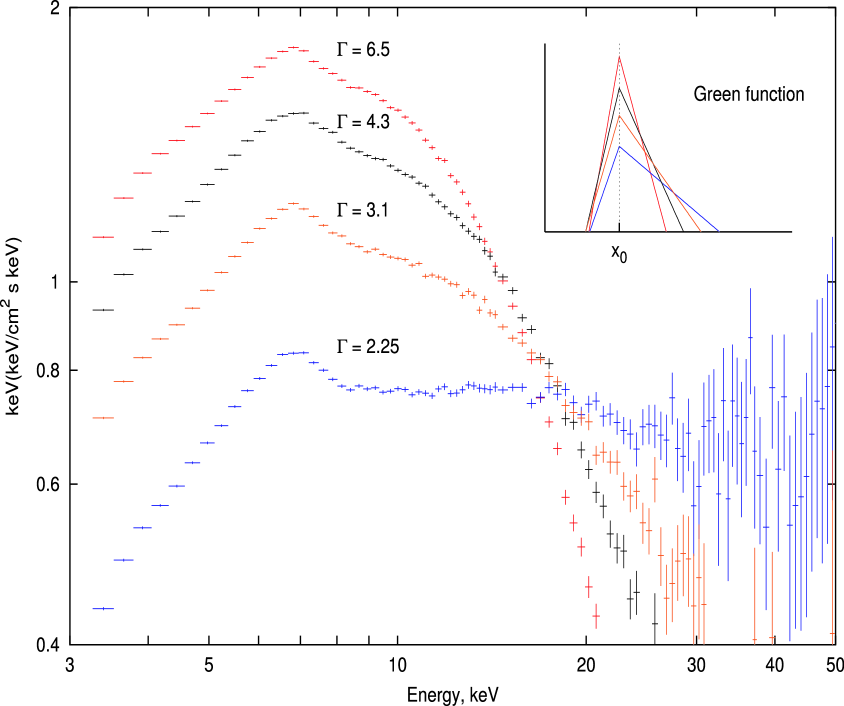
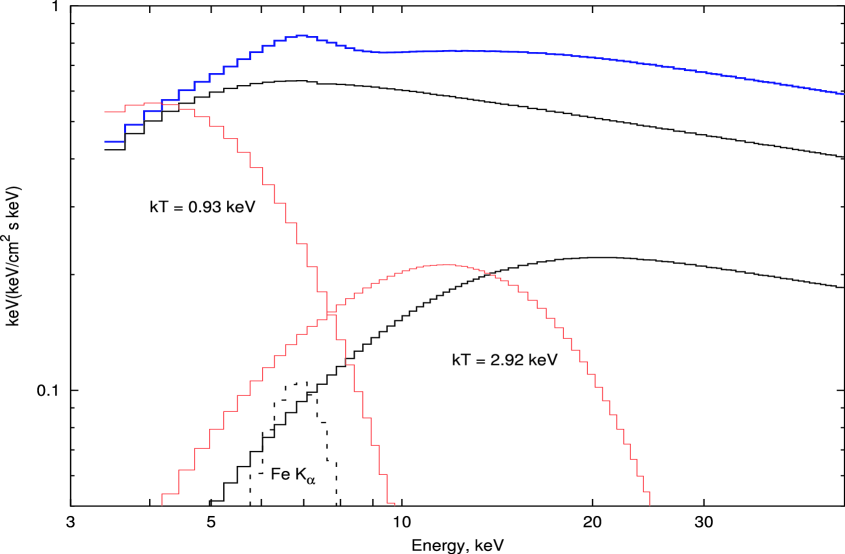
In our timing study of the persistent radiation we reveal the following PDS features: break frequency , two Lorentzian low-frequencies and , and two kilohertz QPO frequencies. The presence of the second low frequency Lorentzian, which we refer to as , has been reported in previous works on timing properties of 4U 1728-34 (see Migliari, van der Klis & Fender, 2003; van Straaten et al., 2002; Di Salvo et al., 2001). In Figure 2 we present the observed correlations of photon index vs (lower panel), (middle panel) and (upper panel) for a NS source 4U 1728-34. The index saturation seen in BH sources at high values of (see TF04) is not observed in this NS source. The index seemingly increases without any sign of saturation as the low and break frequencies increase. One can naturally expect that in the high/soft state of an accreting NS source thermal equilibrium is achieved and that two blackbody components related to the disk and the NS would be seen in the data. Our data analysis confirms this expectation. In the NS high/soft state the temperature of the Comptonizing cloud is very close to the temperature of the NS blackbody component, namely a few keV. In this case the blackbody soft photons do not gain any energy from the electrons of surrounding plasma cloud, i.e. the energy exchange between the electron gas to the photons is very small. The photon index of the Comptonization Green’s function is (see Sunyaev & Titarchuk 1980, hereafter ST80). The blackbody spectra are only slightly Comptonized. Figure 3 shows the evolution of a spectrum when the mass accretion rate increases. When the source is in low/hard state the emerging radiation spectrum is formed as a result of Comptonization of soft photons generated in the disk and neutron star atmospheres (see Figure 4, upper panel). In comparison with low/hard BH spectra (for which ) the NS spectra are slightly softer and have indices .
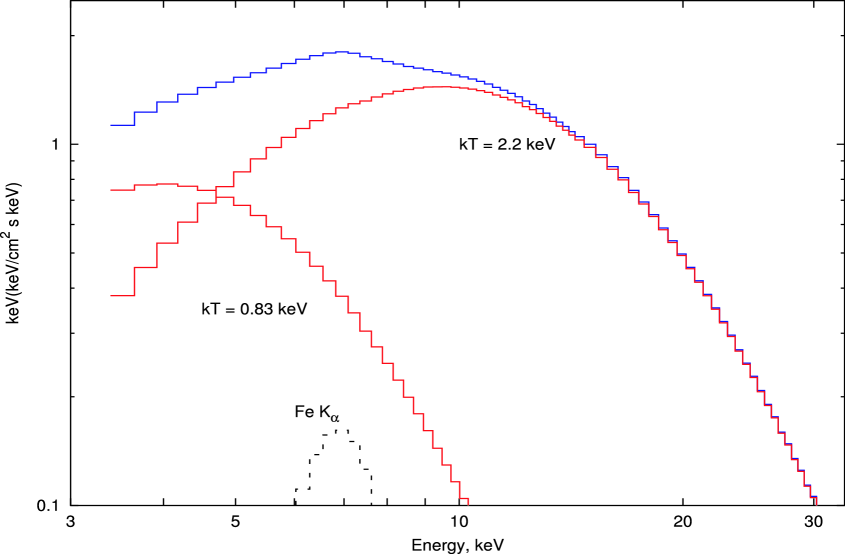
In the NS case, which we analyze, the high/soft spectrum is the sum of two blackbody components, no power-law component is seen in the observed spectrum (see Figure 4, lower panel). It clearly indicates that the thermal equilibrium is established when mass accretion rate is high. On the other hand in black holes the thermal equilibrium is not achieved in high/soft state because of the presence the event horizon in the system. The emergent spectrum should deviate from the blackbody. Grove et al. (1998) and BRT99 presented a set of high/soft spectra for black holes. They showed that in addition to the soft (disk) blackbody component there is an extended power-law component (for which ).
4 On the nature of low-frequency oscillation modes
In Figure 5 we present the observed ratio . It is apparent that this ratio anticorrelates with and consequently with mass accretion rate. The number of points presented in Figure 5 is 118, for which the correlation coefficient is -0.52 and thus the probability of non-correlation of and is . The fit to the linear function gives us that . The present analysis indicates that the observed trend is statistically significant. The apparent trend in relation does not fit within a simple harmonic-subharmonic picture.
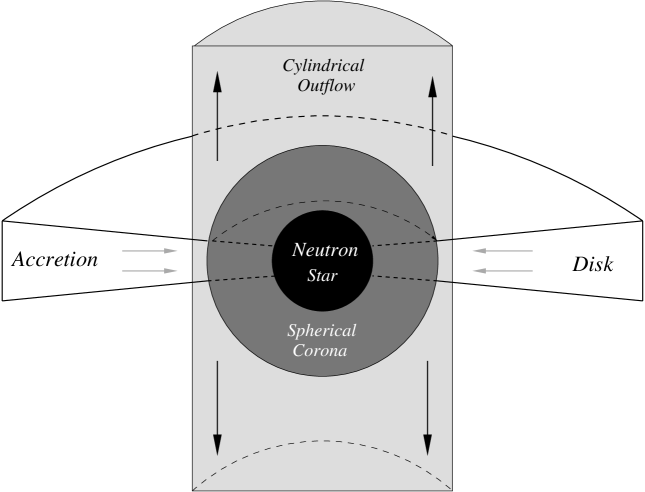
We propose a model to explain this behavior of and frequencies. We suggest that the accretion flow consists of two major geometrical components, namely, a spherical Compton corona and a cylindrical (outflow) component related to the disk (see Figure 6). We treat and its as normal mode oscillation frequencies of spherical and cylindrical components respectively. We assume that spherical component is embedded into the cylindrical configuration and the corona radius is equal to the cylinder radius , i.e. . The height of the cylinder .
The wave equation for the displacement (e.g. Landau & Lifshitz, 1959) reads
| (1) |
where is sound speed in the plasma and is a radius vector for a given point in the configuration. The Laplace operator, has the form
| (2) |
for the spherical geometry. In the cylindrical geometry is
| (3) |
where , and . Two cases of boundary conditions can be considered: (fixed boundary), (free boundary) for spherical geometry and (fixed boundary), (free boundary) for cylindrical geometry.
In order to find the eigen frequency for a given configuration one should solve the eigenvalue problem for Eq. (2) or (3) with the appropriate (fixed or free) boundary conditions. We are interested in the least (fundamental) eigen frequencies. Using the separation variable method we present the solution of Eq. (1) in the form for the spherical geometry, where can be found as a nontrivial (eigen) solution of equation
| (4) |
for the homogeneous (fixed or free) boundary conditions. The solution of Eq. (4) is and the appropriate first (fundamental) eigenvalue is for the fixed boundary condition . For the free boundary condition the eigenvalue can be found as the first nontrivial root of transcendental equation , which is .
For the cylindrical geometry one can look for the solution as , where is a nontrivial solution of equation
| (5) |
and is the solution of the following equation
| (6) |
where and are eigenvalues for the eigenfunctions and respectively. With an assumption of symmetry of with respect to plane we obtain and for the fixed boundary condition we have which gives . The bounded solution of Eq. (6) in the interval from to is expressed through the Bessel function of zero order . For the fixed boundary condition is the first root of equation . Then we obtain as a function and :
| (7) |
For the free boundary condition we find from the equation . The eigenvalue of Eq. (6) can be found using the roots of equation , where we use the recurrent relation for the Bessel functions (Abramovitz & Stegun 1970, formula 9.1.27). The expression for reads
| (8) |
The time-dependent component of the solution is , where is the fundamental rotational frequency related to the fundamental eigenvalue . Evidently, the ratio of fundamental frequencies for cylindrical and for spherical configuration equals to the ratio of corresponding eigenvalues, i.e. . For the fixed boundary conditions the resulting ratio is
| (9) |
while for the free boundary conditions we get
| (10) |
Using Equations (9) and (10) in case of one can obtain as and for the fixed and free boundary conditions respectively. For the corresponding ratios are 0.58 and 0.50.
Our identification of the observed low frequency features and as the fundamental oscillation modes of the spherical and cylindrical configurations sheds light on the nature of the observed dependence of versus presented in Figure 5. In the low/hard state, when is about 10 Hz, the observed ratio reaches its highest values of about 0.8. The ratio steadily decreases from around 0.7 to values lower than 0.5 when the frequency grows from 10 Hz to 120 Hz, i.e. when the source undergoes a transition from low/hard state to the high/soft state. Using the above analysis of the behavior of as a function of corresponding sizes of the spherical and cylindrical configurations ( and ) one can argue that in the hard state the vertical size of the cylindrical configuration is much larger than the size of the spherical corona. As the source progresses toward the soft state the sizes of configurations become comparable. We associate the cylindrical configuration with the outflow and open field lines of the NS magnetosphere. The size of this component should be related to the radio emission in the source. We can thus conclude that the radio flux should be highest in the hard state and then to decrease steadily toward soft state.
5 Disk-jet coupling in X-ray binaries and a link between Fe Kα emission-line strength and QPO frequencies
The expected anticorrelation of X-ray spectral hardness and the radio brightness has already been established by Homan et al. (2004) for the low-mass X-ray binary GX 13+1 and by Mirabel et al. (1998); Klein-Wolt et al. (2002) in the BHC GRS 1915+105. In fact, Homan et al. have observed the neutron star LMXB GX 13+1 simultaneously in X-rays and radio. The hard state has been linked with radio fluxes, which were found to be 4 and 18 times higher than the maximum detected in the soft state. This dependence of the radio flux on X-ray state has also been found in 4U 1728-34 by Migliari et al. (2003) who analysed 12 simultaneous radio and X-ray observations performed in two blocks in 2000 and 2001. They found that the strongest and most variable radio emission seems to be associated with transition between hard and soft states, while weaker, persistent radio emission is observed when the source remains steadily in hard state. In the hard state, when the break frequency changes from 1 Hz to 10 Hz (see Fig. 2 and also Fig. 5), there are significant correlations between the radio flux density at 8.46 GHz and the 2-10 keV X-ray flux and also between radio flux density and the break and low-frequency Lorentzian frequencies, and in our definitions. Migliari et al. also confirm previous findings that accreting neutron stars are a factor of less “radio loud” than black holes.
Recently Miller & Homan (2005) claimed that the presence of Fe Kα emission-line strengths, QPOs, and the link between them do not depend of jet activity (taking radio flux as a jet indicator) in GRS 1915+105. We find that a similar phenomenon takes place in 4U 1728-34: while radio (and X-ray) emission strongly correlates with QPO frequencies (see Figs. 3, 4 in Migliari et al.) one can not see that Fe Kα equivalent width (EW) is correlated with QPO frequencies. In Figure 7 we present the behavior of the Fe Kα EW as a function of . Morever our EW range of 100-400 eV is similar to that obtained in BHC GRS 1915+105. Miller & Homan argue that the Fe K - connection has the potential to reveal the innermost regime in an accreting system. They also state that disk reflection models provide the best overall fit to the broadband spectrum in GRS 1915+105. But it is not the case for 4U 1728-34. We find the spectra from this source are well fitted by a sum of two Comptonization components and the line component (see details in §2) and one does not need to include any additional components in the spectral model. We find that the intrinsic NS and disk emissions are completely scattered in the optically thick Compton cloud. The relative weight of the Comptonized component, is close to 1 as indicated by our fitting to the data. On the other hand the Fe Kα EW is almost insensitive to QPO values (taking QPO frequency value as a compactness indicator of X-ray continuum area). That leads one to conclude that the size of the Fe Kα emission area is weakly related to the compactness of X-ray continuum emission. This Kα emission in 4U 1728-34 is possibly produced when the emergent Comptonized spectrum illuminates the wind (outflow) emanated from the binary. Laming & Titarchuk (2004) calculate the temperature and ionization balance in the outflow from an accreting system under illumination by hard radiation from the central object. They find that the equivalent width of Fe Kα line that originated in the wind is on the order of hundreds eV, close to the observed values in 4U 1728-34. Laming & Titarchuk also show that the strong iron line can be generated in the relatively cold extended region far away from the source of the illuminating photons (of order - Schwarzchild radii).
6 Conclusions
We present a detailed spectral and timing analysis of X-ray data for 4U 1728-34 collected with the RXTE. We find observational evidence for the correlation of spectral index with low-frequency features: , and . The photon index steadily increases from 1.8 in low/hard state to values exceeding 6.0 in the high/soft state. Unlike in BH sources, there is no sign of saturation of the index in the high/soft state for 4U 1728-34. If this effect was confirmed for other NS sources, it could be considered to be a neutron star signature. On the other hand, the presence of a photon-index saturation (when the low QPO frequency increases) would indicate the presence a black hole. The two black-body component spectrum observed in the high/soft state can be also considered as a neutron star signature.
We also propose a model to explain the nature of the pair of QPO low frequencies and and their behavior as a function of the source spectral hardness. We argue that is a frequency of the radial oscillations of the quasi-spherical configuration around the NS and is a frequency of the radial and vertical oscillations of the cylindrical configuration there. We show that the values of and are determined by the sizes of the spherical and cylindrical components of the accretion flow. Our analysis indicates that the vertical size of the cylindrical component is much larger than the corona radius in the low/hard state. We suggest that the size of the cylindrical component is related to an outflow activity and, consequently, should be correlated with source radio flux. We expect the highest radio emission in the X-ray low/hard state.
While radio and X-ray emission and the X-ray spectral softness strongly correlate with QPO frequencies, the Fe Kα line equivalent width does not show a significant correlation with QPO frequencies at least in NS binary 4U 1728-34. It leads us to conclude that the compactness of the X-ray (radio) emission area (taking the QPO frequency value as a compactness indicator) is higher for softer spectra (related to higher mass accretion rate). On the other hand the Fe Kα emission-line strength (EW) is almost insensitive to QPO values (mass accretion rate) and one can conclude that the size of Fe Kα emission area is not related to the size of the X-ray continuum emission area. Thus the observations possibly suggest that the photospheric radius of the Fe Kα emission is orders of magnitude larger than that for the X-ray continuum.
We appreciate productive discussions with Ralph Fiorito and Chris Shrader and we thank the referee for his/her constructive criticism and suggestions that improve the paper presentation.
References
- Abramovitz & Stegun (1970) Abramowitz, M., & Stegun, I. 1970, Handbook of Mathematical Functions, Dover Publications, New York
- Alpar, & Shaham, (1985) Alpar, M. & Shaham, J. 1985, Nature, 316, 239
- Belloni, Psaltis & van der Klis (2002) Belloni, T., Psaltis, D., & van der Klis, M. 2002, ApJ, 572, 392
- Borozdin et al. (1999) Borozdin, K., Revnivtsev, M., Trudolyubov, S., Shrader, C, & Titarchuk, L. 1999, ApJ, 517, 367 (BRT99)
- Chakrabarti & Titarchuk (1995) Chakrabarti S.K. & Titarchuk, L. G. 1995, ApJ, 455, 623
- Di Salvo et al. (2001) Di Salvo T., Mendez, M., van der Klis, M., Ford, E., & Robba, N.R. 2001, ApJ, 546, 1107
- Dickey & Lockman (1990) Dickey,J.M., & Lockman, F.J. 1990, ARAA, 28, 215
- Done, & Gierlinski, (2003) Done, C, & Gierlinski, M. 2003, MNRAS, 342, 1041
- Garcia et al. (2001) Garcia, M.R. et al. 2001, ApJ, 553, L47
- Gilfanov & Aref’ev (2005) Gilfanov, M., & Arefiev, V. 2005, MNRAS, submitted, (astro-ph/0501215)
- Grove et al. (1998) Grove, J.E., et al. 1998, ApJ, 500, 899
- Ford & van der Klis (1998) Ford, E., & van der Klis, M. 1998, ApJ, 506, L39 (FV98)
- Homan et al. (2004) Homan, J., et al. 2004, A&A, 418, 255
- Homan et al. (2003) Homan, J., et al. 2003, ApJ, 586, 1262
- Jahoda et al. (1996) Jahoda, K., Swank, J.H., Giles, A.B., Stark, M.J., Strohmayer, T., Zhang, W., & Morgan, E.H. 1996, Proc. SPIE, 2808,59
- Jonker, Mendez & Klis (2000) Jonker, P. G., Mendez, M., van der Klis, M. 2000, ApJ, 540, L29
- Klein-Wolt et al. (2002) Klein-Wolt, M., et al. 2002, MNRAS, 331, 745
- Lamb et al. (1985) Lamb, F.K, Shibazaki, N., Alpar, M.A., & Shaham, J. 1985, Nature 317, 681
- Laming& Titarchuk (2004) Laming, J.M. & Titarchuk, L. 2005, ApJ, 615, L121
- Landau & Lifshitz (1959) Landau, L.D., & Lifshitz, E.M. 1959, Fluid Mechanics, Pergamon Press: New York
- Laurent & Titarchuk (1999) Laurent, P. & Titarchuk, L. 1999, ApJ, 511, 289 (LT99)
- Laurent & Titarchuk (2001) Laurent, P. & Titarchuk, L. 2001, ApJ, 562, L67
- McClintock & Remillard (2003) McClintock & Remillard, R. 2003, preprint (astro-ph/0306213)
- Mendez, van der Klis & Ford (2001) Mendez, M., van der Klis, M., & Ford, E. 2001, ApJ, 561, 1016
- Menou et al. (1999) Menou, K., et al. 1999, ApJ, 520, 276
- Miller & Homan (2005) Miller, J.M., & Homan, J. 2005, ApJ, 618, 107
- Migliari, van der Klis & Fender (2003) Migliari, S., et al. 2003, MNRAS, 342, L67
- Migliari, van der Klis & Fender (2003) Migliari, S., van der Klis, M., & Fender, R. P. 2003, MNRAS, 345, L35
- Mirabel et al. (1998) Mirabel, I. F., et al. 1998, A&A, 330, L9
- Morrison (1967) Morrison, P. 1967, Ann. Rev. Astron. and Astroph., 5, 325
- Narayan & Heyl (2002) Narayan, R., & Heyl, J. 2002, ApJ, 574, L139
- Narayan et al. (1997) Narayan, R., & Garcia, M.R. & McClintock, J.E. 1997, ApJ, 478, 79
- Shrader & Titarchuk (2003) Shrader, C., & Titarchuk, L.G. 2003, ApJ, 598, 168 (ST03)
- Shrader & Titarchuk (1999) Shrader, C., & Titarchuk, L.G. 1999, ApJ, 521, L121 (ST99)
- Shrader & Titarchuk (1998) Shrader, C., & Titarchuk, L. 1998, ApJ, 499, L31 (ShT98)
- Strickman & Barret (1997) Strickman, M., & Barret, D. 1997, in proc. 4th Compton Symposium, AIP-509
- Strohmayer et al. (1996) Strohmayer, T. E., et al. 1996, ApJ, 469, L9
- Sunyaev & Revnitsev (2000) Sunyaev, R.A. & Revnitsev, M. 2000, A&A, 358, 617
- Sunyaev & Titarchuk (1980) Sunyaev, R.A. & Titarchuk, L.G. 1980, A&A, 86, 121 (ST80)
- Titarchuk, & Fiorito (2004) Titarchuk, L.G. & Fiorito, R. 2004, ApJ, 612, 988 (TF04)
- Titarchuk, Lapidus & Muslimov (1998) Titarchuk, L., Lapidus, I.I., & Muslimov, A. 1998, ApJ, 499, 315 (TLM98)
- Titarchuk, Mastichiadis & Kylafis, (1997) Titarchuk, L. G., Mastichiadis, A., & Kylafis, N. D. 1997, ApJ, 487, 834 (TMK97)
- Titarchuk, Mastichiadis & Kylafis, (1996) Titarchuk, L. G., Mastichiadis, A., & Kylafis, N. D. 1996, A&A, 120, 171 (TMK96)
- Titarchuk, & Osherovich (1999) Titarchuk, L.G. & Osherovich, V.A. 1999, ApJ, 518, L95
- Titarchuk, & Shrader (2002) Titarchuk, L. & Shrader, C.R. 2002, ApJ, 567, 1057
- Titarchuk & Zannias (1998) Titarchuk, L.G. & Zannias, T. 1998, 493, 863 (TZ98)
- Torrejon et al. (2004) Torrejon, J. M., et al. 2004, A&A, 423, 301
- van der Klis et al. (1985) van der Klis, M. et al. 1985, Nature, 316, 225
- van Straaten et al. (2000) van Straaten, S., Ford, E., van der Klis, M., Mendez, M., & Kaaret, P. 2000, ApJ, 540, 1049
- van Straaten et al. (2002) van Straaten, S., van der Klis, M., Di Salvo, T., & Belloni, T. 2002, ApJ, 568, 2, 912
- Vignarca et al. (2003) Vignarca, F., Migliari, S., Belloni, T., Psaltis, D., & van der Klis, M. 2003, A&A, 397, 729 (V03)
- Wood et al. (2001) Wood, K. S., Titarchuk, L., Ray, P.S., et al. 2001, ApJ, 563, 246


| Proposal ID | Start Date | Stop Date | Time, sec | refs. | |||
|---|---|---|---|---|---|---|---|
| 10073 | 15/02/96 | 01/03/96 | 253248 | 18 | 70 | 5.00 | 1,2,3,4,5,7 |
| 20083 | 19/09/97 | 01/10/97 | 193760 | 15 | 46 | 4.89 | 3,4,5,7 |
| 30042 | 30/09/98 | 19/01/99 | 248352 | 31 | 68 | 5.00 | |
| 40019 | 19/08/99 | 22/09/99 | 121472 | 16 | 33 | 3.31 | 6 |
| 40027 | 01/03/99 | 30/06/99 | 111904 | 17 | 32 | 4.27 | 6 |
| 40033 | 20/01/99 | 05/02/99 | 199008 | 19 | 42 | 4.51 | 6 |
| 50023 | 07/03/00 | 08/07/00 | 104336 | 32 | 34 | 3.98 | 6 |
| 50029 | 18/04/00 | 23/04/00 | 27168 | 6 | 9 | 4.05 | 6 |
| 50030 | 29/01/01 | 15/11/01 | 251088 | 29 | 65 | 3.75 | 6 |
References. — (1) Strohmayer et al. 1996; (2) Ford & van der Klis (1998); (3) van Straaten et al. (2002); (4) Di Salvo et al. (2001); (5) Mendez, van der Klis & Ford (2001); (6) Migliari, van der Klis & Fender (2003); (7) Jonker, Mendez & van der Klis (2000)