PMAS, the Potsdam Multi-Aperture Spectrophotometer
I. Design, Manufacture, and Performance
Abstract
We describe the design, manufacture, commissioning, and performance of PMAS, the Potsdam Multi-Aperture Spectrophotometer. PMAS is a dedicated integral field spectrophotometer, optimized to cover the optical wavelength regime of 0.35–1 m. It is based on the lens array – fiber bundle principle of operation. The instrument employs an all-refractive fiber spectrograph, built with CaF2 optics, to provide good transmission and high image quality over the entire nominal wavelength range. A set of user-selectable reflective gratings provides low to medium spectral resolution in first order of approx. 1.5, 3.2, and 7 Å, depending on the groove density (1200, 600, 300 gr/mm). While the standard integral field unit (IFU) uses a 16 element lens array, which provides seeing-limited sampling in a relatively small field-of-view (FOV) in one of three magnifications (8, 12, or 16 arcsec2, respectively), a recently retrofitted bare fiber bundle IFU (PPak) expands the FOV to a hexagonal area with a footprint of 6574 arcsec2. Other special features include a cryogenic CCD camera for field acquisition and guiding, a nod-shuffle mode for beam switching and improved sky background subtraction, and a scanning Fabry-Pérot etalon in combination with the standard IFU (PYTHEAS mode). PMAS was initially designed and built as an experimental traveling instrument with optical interfaces to various telescopes (Calar Alto 3.5m, ESO-VLT, LBT). It is offered as a common user instrument at Calar Alto under contract with MPIA Heidelberg since 2002.
1 Introduction
Unlike optional integral field units which can be deployed in front of a conventional slit spectrograph, PMAS, the Potsdam Multi-Aperture Spectrophotometer, was designed as a dedicated integral field spectrophotometer. It was built entirely at the Astrophysical Institute Potsdam (AIP), Germany. Initially designed as a travelling instrument, PMAS was commissioned and subsequently installed as a common user instrument at the Cassegrain focus of the Calar Alto Observatory 3.5m Telescope in southern Spain.
The instrument was specifically designed to address the science case of 3D spectrophotometry of spatially resolved, individual objects, with an emphasis on broad wavelength coverage in the optical wavelength regime. The spectrograph camera was designed to accommodate a single 2K4K / 15m pixel CCD, or a 22K4K mosaic for the full field, providing 2048 or 4096 pixels in the spectral direction, and 4096 pixels in the spatial direction, respectively. The standard lens array IFU has a relatively small field-of-view (FOV) of 1616 square spatial elements (“spaxels”) on the sky, corresponding to 88 arcsec2 with seeing-limited sampling of 0.5 arcsec/spaxel, or 1616 arcsec2 in the 2 magnification mode with a sampling of 1.0 arcsec/spaxel. The instrument is based on a modular design, including a telescope module with fore optics and the standard IFU, a fiber module to couple the light from the IFU to the spectrograph, and the fiber spectrograph with CCD camera. The fore optics, standard IFU, and spectrograph optics are all built from fused silica, CaF2, or other UV-transparent media such that PMAS is optically corrected and transparent from 0.35—1 m. The instrument also includes a direct imaging cryogenic CCD camera for field acquisition and guiding.
| SPECTROGRAPH: | |
|---|---|
| focal station: | cassegrain |
| principle of operation: | IFU + fiber-coupled spectrograph |
| spectrograph type: | fully refractive f/3 collimator and f/1.5 camera |
| wavelength range: | 0.35-1.0 m (CaF2 optics) |
| gratings: | 1200, 600 and 300 gr/mm reflective gratings |
| linear dispersion: | approx. 0.35, 0.8, and 1.7 Å/pixel, respectively |
| spectrograph FOV: | 60 60 mm2 |
| spectrograph detector | single 2K4K, or 2 2K4K mosaic CCD camera, 15m pixels |
| LENS ARRAY IFU (LARR) | |
| principle of operation: | square lens array with magnifying fore optics |
| lens array: | 16 16 square elements, 1mm pitch |
| fore optics magnifications: | — 0.5 arcsec sampling, 8 8 arcsec2 FOV |
| — 0.75 arcsec sampling, 12 12 arcsec2 FOV | |
| — 1.0 arcsec sampling, 16 16 arcsec2 FOV | |
| fiber configuration: | 256 OH-doped fibers, 100 m core diameter |
| filters: | filter slider with five 1-inch round filter positions |
| FIBER BUNDLE IFU (PPAK) | |
| principle of operation: | focal reducer + hexagonal packed fiber-bundle |
| fore optics: | focal reducer lens F10 to F/3.3, plate scale: 17.7 arcsec/mm |
| fiber configuration: | 331 object + 36 sky + 15 calibration fibers, 150 m core diameter |
| field-of-view: | 74 65 arcsec2, hexagonal |
| spatial sampling: | 2.7 arcsec per fiber diameter, 3.45 arcsec pitch (nearest neighbour) |
| filters: | user-selectable 35140 mm2 order separating filter in |
| spectrograph collimator mount; | |
| alternatively: 50 mm round filter in front of fiber bundle | |
| ACQUISITION AND GUIDING CAMERA | |
| detector: | 1K1K CCD, thinned backside illuminated, AR coated |
| field-of-view: | 205 205 arcsec2 |
| pixelsize, scale: | 24m, 0.2 arcsec/pixel |
| filters: | filter slider with four 2-inch round filter positions |
Since commissioning at Calar Alto in 2001, and facilitated by the open and modular structure of PMAS, several new features have been added to the initial configuration of the instrument: an off-axis fiber bundle (“PPak”) for an enlarged FOV1 arcmin (Verheijen et al. 2004), a nod-shuffle mode of operation for faint object integral field spectroscopy (Roth et al. 2002d), and the PYTHEAS mode with a scanning Fabry-Pérot etalon for an increased spectral resolution over a large free spectral range (Le Coarer 1995). We shall give detailed reports on these special modes in future papers II., III., and IV., respectively.
The initial conceptual design, progress reports on assembly, integration, and test, and first results from commissioning are given in Roth et al. 1997, Roth et al. 1998, Roth et al. 2000a,b, Roth et al. 2003, Kelz et al. 2003a, and Kelz et al. 2003b. First results from a science verification run were reported in Roth et al. 2004a.
2 Science Case and Requirements
Integral field spectroscopy111also referred to as 3D spectroscopy is an emerging observing technique on the verge of becoming a standard method. After a period of experimental developments since the late 1980’s, several facility instruments in the optical and NIR were planned and subsequently built for some 4-8m class telescopes, e.g. INTEGRAL/WHT (Arribas et al. 1998), GMOS-IFU/Gemini (Allington-Smith et al. 2002), GNIRS-IFU/Gemini (Elias et al. 1998), FLAMES-IFU/VLT (Pasquini et al. 2000), VIMOS-IFU/VLT (Le Fevre et al. 2003), SINFONI/VLT (Eisenhauer et al. 2003). In this ground-breaking era, PMAS was intended to make a contribution to the development of crowded field 3D spectroscopy, analogous to the successful introduction of crowded field photometry with the advent of CCD detectors in Astronomy.
Unlike most of the more conventional applications of 3D spectroscopy, where the simultaneous coverage of a – preferably large – area for the purpose of creating 2-dimensional maps of emission line intensities, velocity fields, velocity dispersions, absorption line indices, etc. have determined the technical requirements (e.g. de Zeeuw et al. 2002), it was the primary goal for PMAS to provide an optimal sampling of the point-spread-function (PSF) over the entire optical wavelength region, from the atmospheric cutoff in the UV to the NIR. Such properties would make an integral field spectrograph an ideal tool for the spectrophotometry of faint point sources, with superior properties over slit spectrographs in terms of slit losses, of sensitivity to differential atmospheric refraction and pointing errors, and of accurate background subtraction in fields where source confusion is an issue (Roth et al. 1997, 1998, 2000c).
Among the major science cases to demand such properties there were considered: spectrophotometry of resolved stellar populations in nearby galaxies (including extragalactic planetary nebulae, H II regions, optical counterparts of ultraluminous X-ray sources), supernovae, gravitationally lensed QSOs, QSO host galaxies, high redshift galaxies. The recent discussion of the science case for extremely large telescopes (ELTs) has shown that this motivation is, in fact, timely and relevant for future developments of ground-based optical Astronomy (e.g. Najita & Strom 2002, Hawarden et al. 2003). We shall summarize some first PMAS results on these topics in § 4.13.
The PMAS requirements derived from these science cases include wide wavelength coverage of 0.35–1 m, high efficiency, low to medium spectral resolution, seeing-limited spatial sampling at a modest FOV, high stability, a supporting direct imager for field acquisition, guiding, and differential spectrophotometry, and a self-contained design (traveling instrument).
The science case for the bare fiber bundle IFU (PPak) is identical to the one of SparsePak (Bershady et al. 2004), see Verheijen et al. 2004. It is complementary to the standard IFU in the sense that it adresses the problem of low surface brightness 3D spectroscopy using large spaxels over a large FOV at the expense of spatial resolution.
3 Instrument Description
3.1 Overview
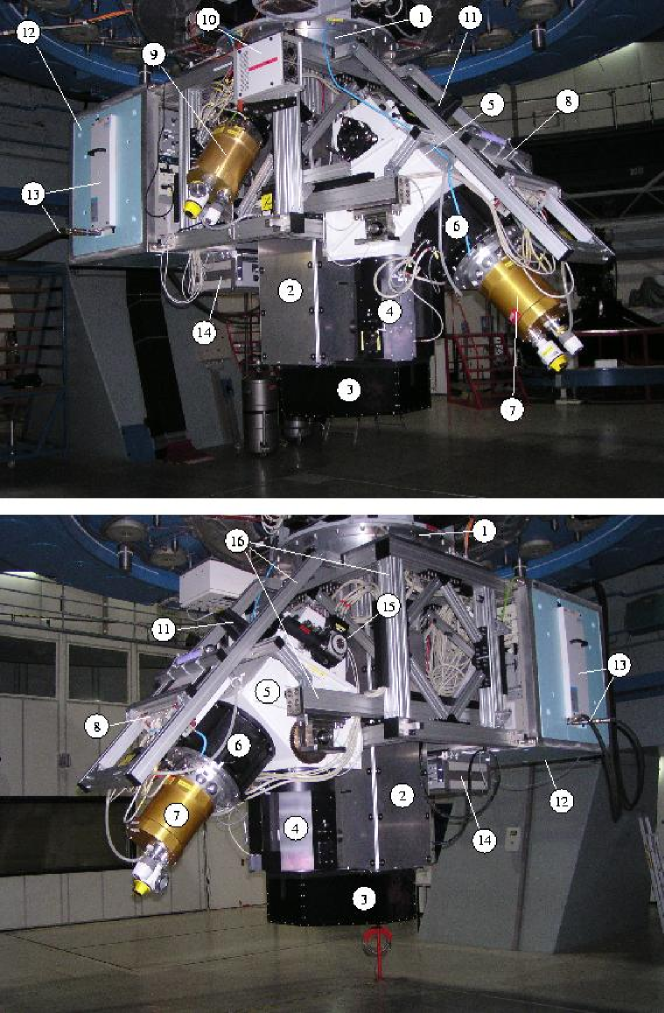
PMAS is based on the principle of a fiber-coupled lens array IFU, employing a dedicated fiber spectrograph. Initially, PMAS was required to operate as a traveling instrument. Therefore, the instrument was designed for operation at the cassegrain focus station of a 4-8m class telescope with a self-contained structure, having a minimal number of interfaces to its environment. It has a modular layout with the following major components (Fig. 1): telescope module with flange to the telescope, the main frame as a support structure for the remaining modules, the fiber spectrograph, the fiber module, connecting the telescope module and the fiber spectrograph, and the electronics rack for the instrument control subsystem. Except for the telescope flange, the 230VAC power cable, a connection to the LAN, and two pairs of cooling hoses for a closed cycle heat exchanger, PMAS has no connections to the outside world.
3.2 The Spectrograph Module
In terms of importance and costs, the fiber spectrograph is the dominant component of the instrument and determines to a large extent its overall properties. It employs an all-refractive optical design with an f/3 collimator, a beam size of 150mm in diameter, interchangeable reflective gratings, and an f/1.5 camera with a corrected focal plane of 6060 mm2. The nominal wavelength range is 0.35–1 m.
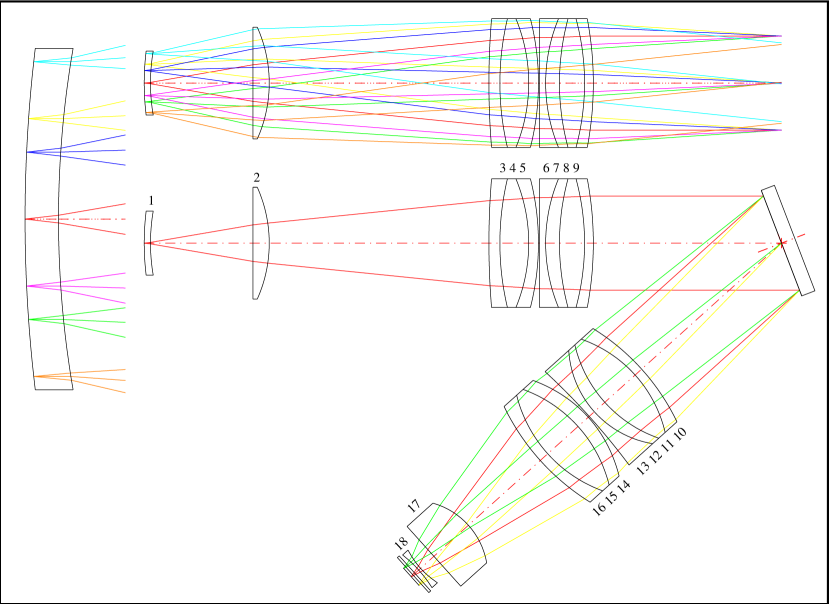
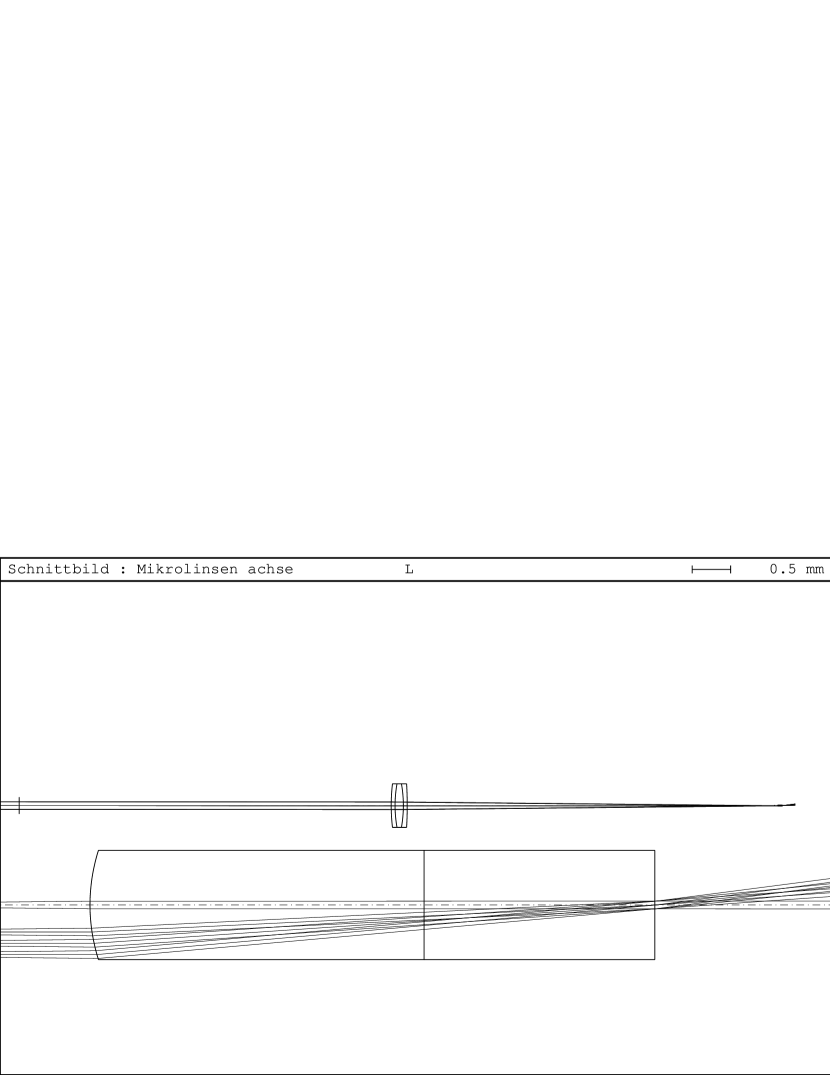
The optical design principle and optimization was performed by UL with proprietary software (Laux 1999). The result was double-checked using the commercial ZEMAX and Code-V programmes. The collimator and camera systems are characterized by a similar layout (see Fig. 2), each consisting of the combination of two lens groups (triplet, quadruplet), combined with two singlet field lenses near the fiber slit (collimator) and the detector focal plane (camera), respectively. The camera has two aspherical surfaces, viz. the first surface of the triplet (lens 14), and the first surface of the field lens (lens 18), as seen from the grating. The camera field lens is followed by a plane-parallel quartz plate, acting as the cryostat window of the CCD detector subsystem. The external focus of the camera has the significant advantage of allowing for an easy interchange of detectors.
As a result of the compact configuration of the two front lens groups, the optical system presents comparatively few (18) glass-air interfaces which are all covered with high quality broadband AR coatings, yielding an average residual reflectance of 0.8% per surface in the wavelength interval 0.35–1 m. Due to the excellent transmission properties of the glasses, the system has a high throughput down to 350nm. The image quality is well-matched to the nominal pixel size of 15 m (Tab. 4). There is a modest amount of vignetting () near the edge of the spectrograph FOV. The masses of the complete collimator and camera subsystems, including the massive lens mounts, are 60 kg each, respectively. The optical systems were manufactured and assembled by Carl Zeiss Jena, Germany. The results of the acceptance tests were reported by Roth et al. 2000b.
The spectrograph mechanical design is characterized by a solid aluminum cast housing, which keeps the heavy collimator and camera optics in place. Both lens barrels are protected by stiff aluminum tubes which are mounted to the center case, but decoupled from the lenses. The camera tube carries the spectrograph CCD camera, which is also mechanically decoupled from the optics. The design was optimized for high mechanical stability using the ANSYS finite element code (Dionies 1998). The whole spectrograph subsystem is suspended at two points near the center of gravity and mounted to the main frame such as to avoid the variation of torque over different pointings of the telescope.
The exchangeable reflective grating is mounted on a 360∘ rotator which accommodates any required grating orientation, depending on the choice of ruling and blaze. The gratings are fixed in a 6-point kinematic mount, the blazed front surface coinciding with the rotation axis of the device. The grating rotator is balanced by counter-weights, again to avoid any torque effects under varying orientations.
PMAS is equipped with a set of interchangeable reflective gratings (Tab. 2), each of which is mounted in an individual frame and stored in a protective cartridge when not installed in the instrument. The gratings were manufactured by Richardson Grating Laboratory, Rochester, U.S.A., as replicas from master gratings for astronomical use with a ruled area of 154206 mm2 and a blank size of 16522035 mm3. Each grating frame carries a 4-bit code made out of small magnets (grating ID), which is read upon loading a grating from its cartridge into the grating rotator and is used to generate a corresponding FITS header entry GRAT_ID for each spectrograph data file.
The spectral resolution depends on the choice of grating, the zero-th order projected fiber size on the grating (4 pixels or 6 pixels diameter for the lens array and PPak IFUs, respectively), anamorphic (de-)magnification (Schweizer 1979), and tilt and orientation of the grating. Depending on the orientation, i.e. the normal of the blaze surface facing either the camera (“forward”), or the collimator (“backward”), the anamorphism is effected in opposite ways, and the tilt must be adjusted accordingly. The grating cartridges are built such as to allow operation both in forward or backward blaze with just a minor mechanical modification at the frame. The default orientation of PMAS gratings for spectrophotometry is forward. However, a significant increase in spectral resolution is obtained for the J1200 grating in 2nd order backward blaze, as discussed in paper II. A comprehensive listing of grating parameters as a function of grating angle and orientation are given in the PMAS online manual222http://www.aip.de/groups/opti/pmas/OptI_pmas.html.
TABLE 2
| Grating | ID | lpmm | D | |||
|---|---|---|---|---|---|---|
| U1200 | 1 | 1200 | 0.39 | 10.4 | 300 | 794 |
| V1200 | 2 | 1200 | 0.35 | 17.5 | 500 | 725 |
| R1200 | 3 | 1200 | 0.30 | 26.7 | 750 | 609 |
| I1200 | 4 | 1200 | 0.22 | 36.8 | 1000 | 460 |
| J1200 | 5 | 1200 | 0.22 | 46.0 | 1200 | 450 |
| J1200(∗) | 5 | 1200 | 0.17 | 46.0 | 600 | 341 |
| U600 | 6 | 600 | 0.81 | 5.2 | 300 | 1656 |
| V600 | 7 | 600 | 0.80 | 8.6 | 500 | 1630 |
| R600 | 8 | 600 | 0.75 | 13.9 | 800 | 1533 |
| U300 | 9 | 300 | 1.67 | 2.5 | 300 | 3404 |
| V300 | 10 | 300 | 1.67 | 4.3 | 500 | 3404 |
PMAS grating parameters. Column 1: name, Col.2: identifier, Col.3: groove density [gr/mm], Col.4: reciprocal dispersion [Å/pixel], Col.5: blaze angle, Col.6: blaze wavelength [nm], Col.7: wavelength coverage for 2K4K CCD [Å]. Note (∗): 2nd order backward.
3.3 Telescope Module
The telescope module is designed for three major purposes: to re-image the telescope focal plane onto the lens array (fore optics), to illuminate the lens array from an internal calibration light source (calibration unit), and to project an area around the IFU onto a camera for target acquisition and guiding (A&G subsystem). For the latter, either an external slit-viewing TV guider camera can be used, or, alternatively, a cryogenic CCD camera which is internal to the PMAS instrument.
The three optical systems are shown schematically in Fig. 3. Light entering from the telescope is combined in the focal plane FP (intersection of the tilted A&G pick-off mirror and optical axis, upper part of the drawing).
The optical train of the fore optics begins at a central hole in the pick-off mirror which gives way for the field-of-view of the lens array, onto which the telescope focal plane is imaged with a magnification of 1:11.8 (for the standard sampling of 0.5 arcsec per lens). Re-imaging is accomplished through the combination of a collimating lens, and a camera objective. Owing to a double 2f arrangement of these lenses, an intermediate pupil is formed at the conjugate of the telescope focal plane. For unbaffled telescopes this is a convenient location for a Lyot stop. Near the intermediate pupil there is also a shutter, and a linear stage, accommodating up to 5 order separation filters. The double 2f scheme has the disadvantage of a relatively long optical train (1m), but the significant advantage of allowing for future experimental upgrades, e.g. Fabry-Pérot etalon (PHYTEAS mode, Le Coarer 1995, see paper IV), or polarimetry. Also, telecentricity for optimal lens array–fiber coupling is ensured without the need for an additional field lens in front of the IFU. Three different magnifications are chosen by interchangeable collimator lenses which are mounted on a linear stage. Tab. 3 lists the parameters for lenses with focal length 50mm, 75mm, and 100mm, respectively, which were computed for three telescopes (Calar Alto 3.5m, VLT, LBT f/15 Gregorian focus). Switching to another scale requires also to adjust the position of the following camera lens and the lens array along the optical axis of the fore optics. They are mounted at the ends of a stable tube, thus forming a single unit whose position along the optical axis can be adjusted by translation on a precision linear stage.
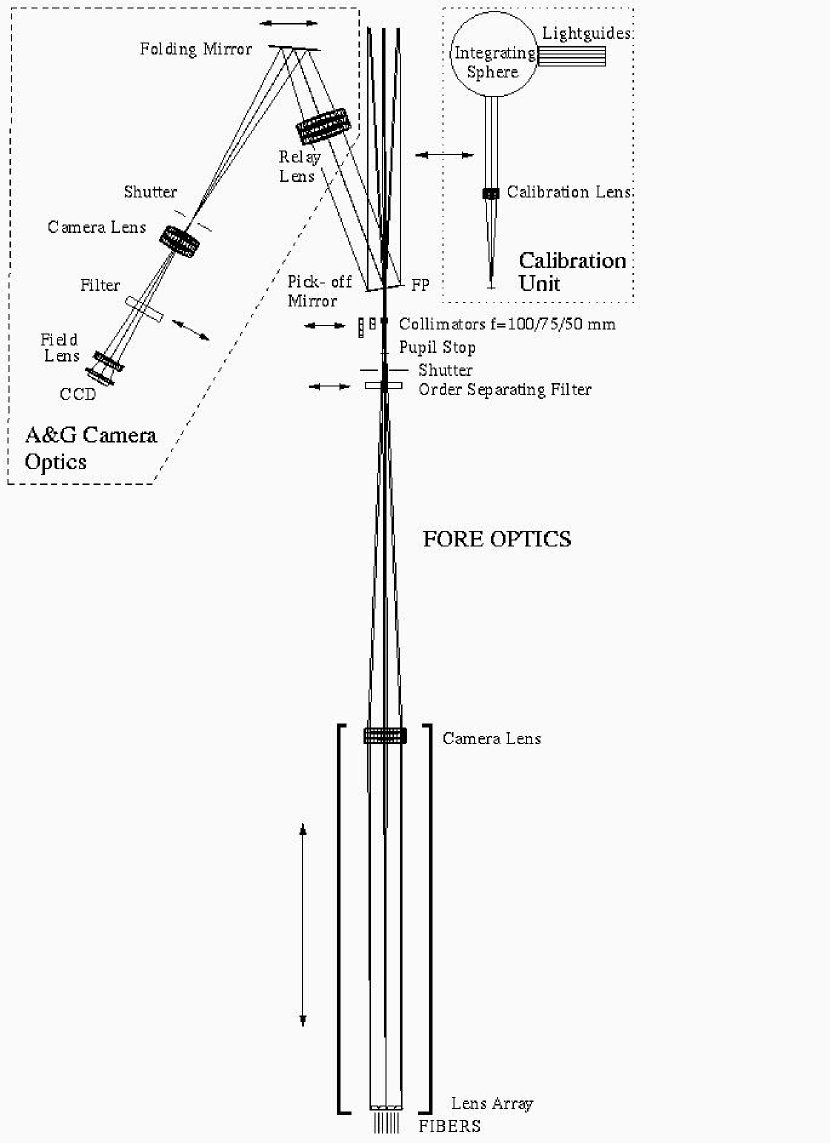
The calibration unit consists of an integrating sphere, whose exit port is imaged onto the intermediate pupil through the calibration lens and the fore optics collimator, imitating as closely as possible the telescope beam. The correct f-ratio is defined by the calibration lens, while the telescope pupil is mimicked with a stop at the output of the integrating sphere, including a central obscuration to simulate the M2 shadow. The calibration unit is mounted on a linear stage and is moved into the beam for calibration exposures.
The A&G camera subsystem is similar to a conventional slit-viewing system where the reflective frontside of a spectrograph slit is observed with a TV guiding camera. In the case of PMAS, the slit is replaced by the tilted pick-off mirror. The combination of a relay lens, a folding mirror, a camera lens, and a field lens projects the plane of the pick-off mirror onto a CCD, which is used for target acquisition and offset guiding. A filter stage mechanism accommodates up to four 50mm filters at a location roughly half-way between the camera and the field lens.
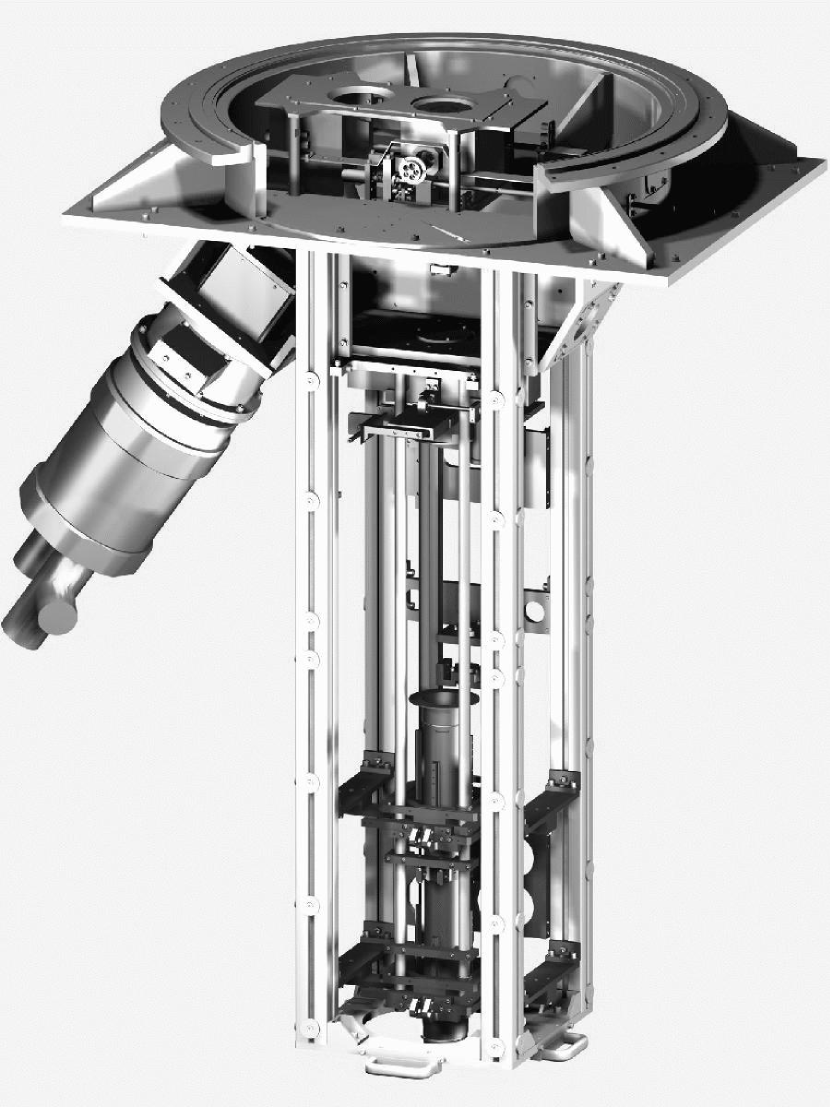
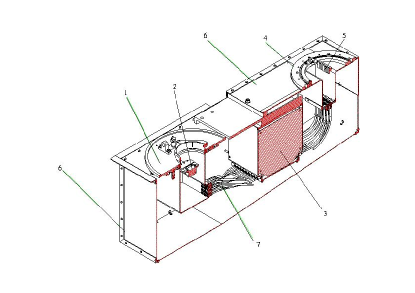
Mechanically, the telescope module consists of a rigid aluminum-cast housing with a flange to the telescope, forming also the base for the support frame, and a tower-like structure extending from the flange down to the fiber module (Fig. 4). The tower acts as a stable mechanical support for an optical bench which is carrying the entire fore optics system. It is essentially self-contained and can be dismounted for shipping as a whole subsystem. The optical bench consists out of LINOS Macro Bench elements and custom made components for the movable parts, namely the linear stages for the collimator lenses, order separating filters, and the camera–lens array tube.
The calibration unit on its linear stage is visible in Fig. 4 through the break-out of the flange. An input piece provides a port for six waveguides simultaneously to feed light from remote light sources (continuum and spectral line lamps) into the integrating sphere.
The A&G camera is seen on the left-hand side of Fig. 4 as the prominent LN2 dewar, attached to the telescope module housing at an angle. Its flange, together with another Macro Bench assembly, forms a modular subsystem which carries all opto-mechanical elements, and which can be easily removed from the housing for inspection and maintenance. The cap of the filter stage, which itself is yet another modular subsystem, is visible as a rectangular structure at the front part of the detector flange.
TABLE 3
f [mm] IP [mm] P [m] pitch [′′] Calar Alto RCC 3500/35000, f/10 50.0 700.0 5.00 42.6 0.50 75.0 466.7 7.50 63.8 0.75 100.0 350.0 10.00 85.1 1.00 VLT 8115/108825, f/13.4 50.0 2176.5 3.73 31.7 0.16 75.0 1451.0 5.59 47.6 0.24 100.0 1088.3 7.46 63.5 0.32 LBT 8408/123765, f/14.7 50.0 2475.3 3.40 28.9 0.14 75.0 1650.2 5.10 43.4 0.21 100.0 1237.6 6.79 57.8 0.28
Fore optics parameters. Columns 1 through 5: collimator focal length, intermediate pupil demagnification factor , diameter of intermediate pupil, nominal diameter of micropupil (fiber input), projected lens array pitch on the sky.
3.4 Integral Field Units
3.4.1 Lens Array IFU (LARR)
The main IFU of PMAS for the purpose of performing spatially resolved spectrophotometry is the lens array, mounted at the end of the fore optics optical train. The open modular design allows for the exchange with another device without necessarily having to modify other major subsystems. The current lens array is a monolithic 1616 elements, 1mm pitch square array with square lenslets, made from fused silica. It was manufactured by Advanced Microoptics Systems GmbH, Saarbrücken, Germany, as a custom-design element with aspherical lenslet front surfaces, and a common plane backside where the fiber bundle is attached (Roth et al. 2000a). The optimal surface quality derived from an interferometric acceptance test was measured to 50 nm r.m.s., excluding a strip of approx. 10m width at the four intersections of a surface with its four nearest neighbors. Owing to the aspherical surface, the lens is, in principle, free of spherical aberration. However, due to random surface defects and an edge effect at the borders of a lenslet, which cannot be made arbitrarily sharp, the overall real image quality is less than ideal (see § 4.3). The output F-number is 4.5. Details of the coupling of the lens array to the fiber bundle are described in § 3.5.
3.4.2 Bare Fiber Bundle IFU (PPak)
In addition to the standard IFU using the on-axis lens array, PMAS was equipped with a second IFU in 2004. This IFU consists of a bare fiber bundle (called PPak), which is placed approximately 6 arcminutes off-axis, as not to obstruct the field for the lens array nor the A&G camera. The main purpose of PPak is (1) to provide a wide field-of-view and (2) high light collecting power per spectra, rather than contiguous spatial sampling. A focal reducer lens is placed immediately in front of the fiber bundle, to reduce the telescope beam from F/10 to F/3 and to change the telescope plate scale from 5.9mm to 17.8mm. Altogether the PPak-bundle features 382 fibers, of which 331 are placed in a densest-packed hexagonal array that projects to on the sky. 36 Sky fibers are arranged within six surrounding mini-IFUs, located away from the central object fiber. Finally, 15 fibers are diverted from the IFU and can be illuminated by calibration lamps, to provide simultaneous calibration spectra within the science exposures.
The combination of individual fiber sizes of 2′′.7 with the high efficiency and wavelength coverage of the PMAS spectrograph, makes PPak a unique tool to study extended low-surface brightness objects, which require high light collecting power and a large FOV. A more detailed description is given paper II and Kelz et al. 2004.
3.5 Fiber Module
The purpose of the fiber module is to rearrange the 2-dimensional information, sampled by the IFU, onto a linear pseudo-slit. Additionally, the fibers decouple the IFU and fore optics from the spectrograph, with the benefits that any mechanical flexure within the telescope module is not transferred to the spectrograph, and seeing effects do not change the spectral resolution (i.e. the slit width).
PMAS is used for the spectroscopy of crowded fields and of faint, background-limited objects. For these targets poor flatfield calibration is a major limitation for the extraction of reliable spectrophotometry. PMAS features a novel design of exchangeable fiber arrays. Instead of a permanent bound, both ends of the PMAS fibers are mechanically aligned and optically matched to lenses in such a way, that fibers can be replaced. Firstly, this allows the exchange of any fibers that perform below average, until the overall efficiency is maximized and discrepancies between individual spectra are minimized. Secondly, it makes it possible to maintain the performance of the fiber unit during its lifetime, as any damaged or broken fibers can be replaced without the need of building a completely new IFU. While this adds certain complications to the manufacturing process, (small mechanical devices, potential damage of the fiber end-faces during assembly, imperfections of the index-matching, alignment) these can be addressed by a strict quality control. The aim of the PMAS fiber module is to achieve high efficiency while ensuring a photometric stable flatfield characteristic over time.
As PMAS was specified to be a medium-resolution spectrophotometer, it was decided to avoid a bench-mounted remote spectrograph with long fiber lengths, which would be subject to movement and create modal noise (Schmoll et al. 2003). Instead, PMAS features fiber lengths of approximately 2 meters. This ensures that the internal attenuation of the fibers is low (), while the input modes are still sufficiently scrambled.
The fiber module consists of three sub-units: the integral field section, the fiber loop box, and the fiber slit. There is no stiff mechanical connection between them, therefore no flexure can be transmitted from one end to the other. Both the individual units, and the overall assembly are fully enclosed by a cover for the purpose of mechanical protection and light-tightness (see Fig. 6).
The fibers chosen are FVP100120140 from Polymicro Inc., whose core size, FRD performance and spectral attenuation were found to best fit the PMAS requirements. These step-index silica fibers are OH enhanced, have a core diameter of , a clad/core ratio of 1.2, and a NA of 0.22. The fibers are inserted into a 3-layer PVC-kevlar tubing (from Northern Lights Cable, U.S.A.) for protection and fitted with end connectors for mounting purposes.
At the output end, the bare fibers are glued onto small blocks, called slitlets, that once assembled form the fiber slit. At the input end the fibers are held by thin metal sheets, called fieldlets, that once stacked on top of each other, form the two-dimensional integral field at the backside of the lens array.
The fiber module contains 256 fibers, arranged in groups of 16. The fiber arrays are self-contained elements that can be mounted and de-mounted from end to end within the fiber module for the purpose of repair or replacement. Additionally, it is also possible to remove the entire fiber module from the PMAS instrument and replace it by an updated or modified version. Both the lens array at the fiber input and the first spectrograph lens at the fiber output are optically matched to the fibers, using optical gel (code 0608 from Cargille Laboratory). The effect of index-matching the fiber ends is twofold. Firstly, reflection losses at glass to air interfaces are reduced and some imperfections of the fiber end surfaces are cured by the gel. Tests done by Schmoll et al. 2003 and by Kelz et al. 2003 demonstrate that fibers, if index-matched to a glass plate or a lens array, show an increase in flux transmission of approximately 10 % , and a reduced fiber-to-fiber variation.
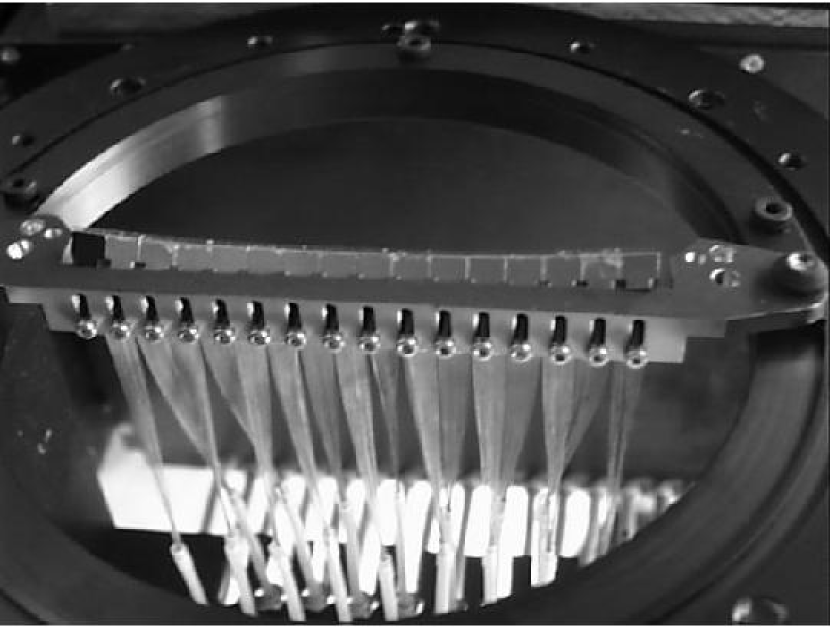
The current PMAS lens array of 16 16 elements forms 256 micropupils with diameters of 43 to 85 m (see Table 3) simultaneously, which need to be imaged onto 100 m fibers each. The common mount that holds the lens array and the fiber ends ensures, that all fibers are placed at the correct lateral and focal position with respect to the micropupils to within (see Fig. 7).
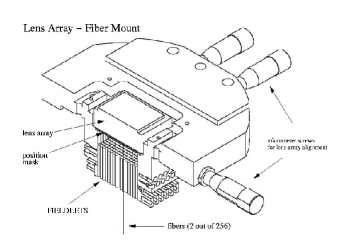
Instead of a permanent bound, the solution found for PMAS consists of a mount that both holds the lens array and the fiber arrays mechanically. A position mask is situated 0.2 mm behind the backside of the lens array. The position mask consists of 256 holes with an inner diameter of 150 m and a pitch of 1 mm. The mount provides a frame with grooves in a 1 mm spacing into which the fieldlets, carrying the fibers, can be inserted and secured. The fieldlets are manufactured in such a way that once they are inserted in the mount, the fiber ends are located at the micropupil plane (backside) of the lens array. While the fiber assemblies and the mask are fixed in position, it is possible to translate and rotate the lens array, using three micrometer screws, for the purpose of alignment.
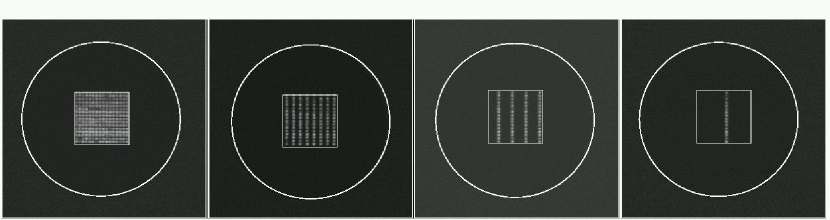
The lens array mount can be equipped with one out of four calibration masks, to cover vertical strips of the lens array (see Fig. 8). As a result, only every 2nd, 4th, or 16th fiber of the pseudo-slit is illuminated, allowing one to measure the faint extended wings of the spectral profiles in the cross-dispersion direction. The actual measurement of the profile is a method of accurately modeling the spectra for optimal extraction techniques, the correction of cross-talk, and to determine an instrumental stray light model (see § 3.8).
It is essential to mount fibers without induced stress, caused by pressure, pull or strong bending, which otherwise increases the focal ratio degradation (FRD) and effects the performance. To avoid any stress, the fibers are inserted in protective tubing ensuring only moderate bending radii. Additionally, the fiber module features a fiber-loop box, to avoid fiber breakage, and to provide a reservoir of extra fiber length which is needed during assembly and for adjustments of the fore optics focal length.
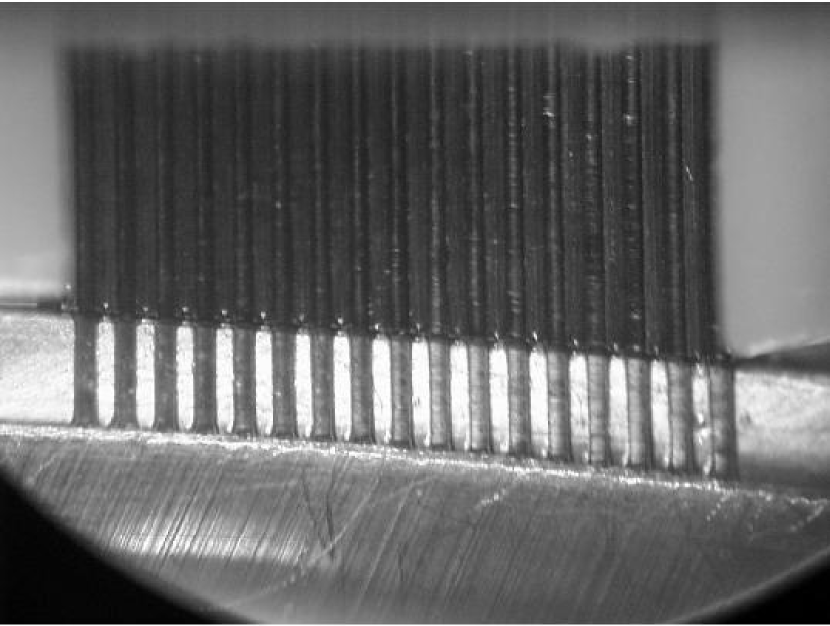
The output ends of the fibers are assembled onto 16 blocks (slitlets) and arranged side-by-side to form an array of length 96 mm, the fiber-slit (see Fig. 9). The spacing from fiber to fiber is 0.34 mm (=3.4 fiber core diameters), resulting in a spectra-to-spectra distance, which is sufficient to perform an interlacing nod-and-shuffle (beam-switching) mode (Roth et al. 2004d, see also paper III). The fiber-slit can accommodate double the number of fibers (512) with half the spacing (corresponding to 7 pixel at the detector). The spectrograph F/3 collimator accepts the whole fiber output cone without the need of additional beam-converting microlenses. The optical design of the spectrograph requires a curved fiber-slit, that directly couples to the surface of the first collimator lens, with optical gel matching the refractive indices.
3.6 The Detector Subsystems
PMAS is equipped with two cryogenic CCD systems: one for the spectrograph camera, and another one for the acquisition and guiding (A&G) camera. Except for some detector head and cable details, both subsystems share the same layout, based on ESO designs which were copied and adapted with permission. The CCD subsystems each consist of a commercial IR Lab model ND-8 cryostat, detector head with detector head electronics, cables, and a CCD controller. The spectrograph detector head was built according to the VLT design as described by Lizon (1997), whereas the A&G camera detector head was made on the basis of an earlier design for La Silla, which was also used for the MONICA instrument (Roth 1990). The CCD controllers are modified copies of ACE (ESO Array Control Electronics), which was originally developed by Reiss (1994) for the ESO VLT technical camera systems. ACE is based on a transputer–DSP architecture, employing the (now discontinued) INMOS T805/T225 transputer chips and a Motorola 56001 DSP. Both controllers are connected via transputer links to an on-board ULTRA SPARC station via SBUS interface cards. The SPARC is supervising the ACEs and handles CCD requests as well as the associated image data streams.
The CCD software is a client-server based application written by TF. The original INMOS server program was enhanced with an EPICS interface layer (see § 3.7), providing all necessary control functions such as initialization, wipe, dark/bias/real exposures, window readout, binning, etc. from Unix shell scripts. Shutter control is also performed from this environment. A most useful feature of the CCD software is that each relevant ACE hardware and software parameter is reflected (and updated) in the EPICS real-time database, providing seamless access from high-level software and advanced scripting without requiring any low-level software updates or modifications. The PMAS nod-shuffle mode (described in paper III) makes particular use of this scheme of low-level scripts and database parameters.
PMAS is currently equipped with 3 fully functional cryostat/detector head subsystems, and 5 ACE controllers (3 of which are spare units). There is one cryostat/detector head for the A&G camera system with a thinned 1KK SITe TK1024 chip, whose pixel size of 24m is matched to the optical system to yield a plate scale of 0.2 arcsec/pixel. The A&G camera field-of-view is 3.43.4 arcmin2. The two remaining cryostats have alternative CCD configurations with (1) a single SITe ST002A 2K4K chip, pixel size 15 m square, and (2) a mosaic of two such chips, covering the whole useful focal plane of the spectrograph camera of 4K4K 15 m pixels. Owing to the external focus of the spectrograph optics, interchanging CCD cameras (1) and (2) is a rather simple mechanical operation.
3.7 Instrument Control
3.7.1 Instrument Control Electronics
Except for the exchange of gratings and filters, PMAS is operated under remote control without direct human interaction at the instrument. The instrument control electronics was designed as a self-contained subsystem and built into a dual 19” electronics rack. It is mounted in a rigid custom-designed aluminum frame, which in turn is suspended in the main frame. It contains the following major components: a VMEbus computer as master hardware controller, a SPARC workstation for data acquisition and high-level instrument control software, DC and stepping motor controllers, motor power amplifiers, a shutter controller, a calibration unit with 6 shutter-controlled continuum and spectral line lamps, various power supplies, and miscellaneous support and auxiliary electronic units. The substantial amount of dissipated heat (typically 600 W) is removed through 8 front-panel mounted fans when the instrument is operated off-telescope, or by means of two liquid-cooled heat exchangers during observations at the telescope. The VME subsystem contains various boards for dedicated control functions: single board computer MVME167 (VME master), running under the real-time operating system VxWorks, PMAC motor controller for up to eight drives, accompanied by a 64-channel digital input/output board for general purpose I/O (sensing switches, controlling lamps and shutters), MAC4-STP stepper motor controller for four stepping motors, and a temperature monitor board for RTD sensors.
The following motorized functions are served by the electronics subsystem: focusing the spectrograph collimator and camera, grating rotator, focusing the A&G camera optical system, filter exchange stage of the A&G Camera, linear stage for the exchange of fore optics collimator lenses (changing the IFU scale/magnification), linear stage to adjust fore optics for the difference in focal length of different collimators, fore optics exchange mechanism for different order separating filters, linear stage to deploy/retract the calibration unit into/from the telescope beam, linear stage to insert the relay optics of the A&G camera. In addition to these motor-controlled functions, there are 6 individually controlled mechanical shutters for the lamp modules of the calibration unit, the fore optics shutter, and the spectrograph slit shutter which resides inside of the spectrograph collimator. The linear stage motors are protected against malfunction through a variety of redundant inner and outer limit switch pairs, as well as fail-safe interlock schemes for those drives which are subject to potential collision states. All motors are equipped with gears, precision linear or circular position encoders, and tacho encoders. The grating rotator, which yields a positioning accuracy of 5 arcsec, is equipped with a DC motor, coupled to a HarmonicDrive gear and followed by a precision rotator stage, both of which are designed to exhibit zero backlash.
The VMEbus computer, the SPARC workstation, and an associated terminal server are connected via Ethernet and a layer-3-switch to the local area network (LAN). The terminal server offers console access to each computer and the PMAC motor controller, which is allowing to startup the instrument and boot the computers from remote login, as well as providing direct access for diagnostics purposes.
3.7.2 Instrument Control Software
The PMAS instrument control software has a hierarchical structure (Fig. 10), which is implemented on two main computers (target/host) and a number of embedded controllers. The host system is a Unix workstation, running EPICS, the “Experimental and Industrial Control System” 333http://www.aps.anl.gov/epics. The target system is a VMEbus single board computer, running under the real-time operating system VxWorks. The Input/Output Controller part of EPICS is implemented on the target.
The low-level target software consists of a state program, the EPICS real-time database accompanied by hardware drivers and PLC and motion programs running on the PMAC motor controller. The EPICS database is a graphically designed software entity, which, once booted, runs permanently, similar to a common hardware device. Instrument control and logging functions are triggered periodically, or driven by events or interrupts. A useful feature of the EPICS real-time database is the availability of each instrumental parameter known to the the instrument control software. Host and Input/Output Controllers (IOC) communicate via LAN. EPICS offers a communication mechanism called Channel Access, providing transparent network access from host and IOCs to EPICS database process variables just by name.
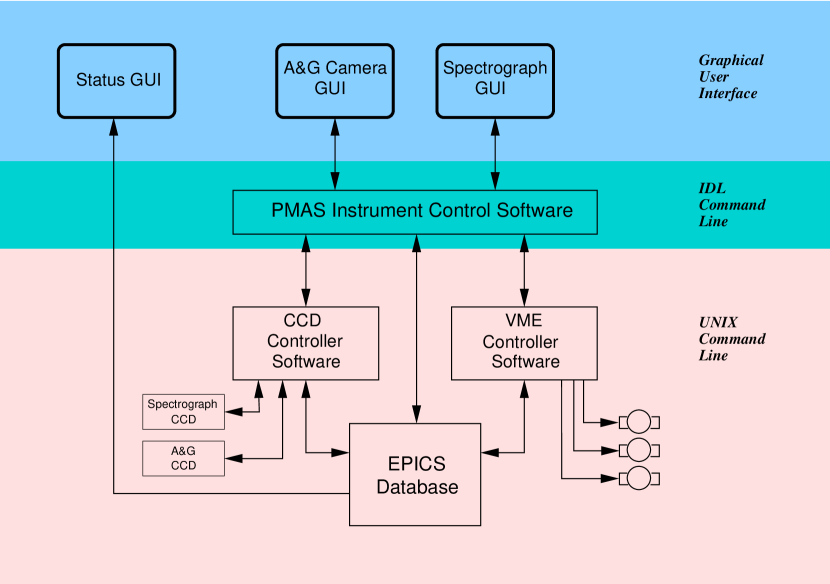
The low level software is broken down into CCD-related tasks (CCD Controller) and other hardware-related tasks (VME Controller), both of which are coordinated by and whose status are reflected in the EPICS database. From the user point-of-view, all low level tasks are accessible from a Unix command line interface with a variety of low level shell scripts. In addition, a generic EPICS graphical user interface provides status information about all major mechanical devices, lamps, and other parameters like temperatures, CCD cryostat evaporating N2 flow rates, etc. (PMAS Status Window).
A second level command line interface is provided through a collection of IDL scripts, interfacing to the low level software and EPICS database, and shielding the user from the detailed knowledge of device parameters. All basic instrument control functions like starting CCD exposures, switching lamps on/off, setting the grating, focus, and so forth are accessible through these comprehensive scripts, which also include basic help features, as well as logging and diagnostic functions. Elementary scripts can be easily combined to form more complex macros for complete measurement cycles including the evaluation and visualization of results.
On top of the PICS command line interface, two major GUIs (also written in IDL) are available for observing at the telescope: the spectrograph CCD control interface, and a corresponding tool for the A&G camera.
3.8 Data Reduction Software
Based on experience gained with the MPFS instrument at the 6m BTA in Selentchuk (Si’lchenko & Afanasiev 2000), a software package, developed by Becker (2002), is used for quick-look inspection of data quality at the telescope (P3d_online) or final data reduction (P3d). The code is written in IDL and comprises more than 1200 routines for processing the raw data and subsequent steps of data analysis, e.g. subtracting bias and dark frames, CCD pixel-to-pixel response variation, removal of cosmic rays, tracing, flexure compensation, swath extraction or profile-fitting extraction, straylight modeling, wavelength calibration, and wavelength-dependent fiber response calibration. There are various tools for the visualization of stacked spectra, maps, and individual (or coadded) spectra, for aperture spectrophotometry, datacube PSF-fitting routines, atmospheric dispersion compensation, and so forth (programs monolook, cube_viewer, and many others). Some elements of these tools were found to be useful prototypes for the development of the E3D visualization tool which is commonly available as open source code through the Euro3D consortium (Sánchez 2004, Sánchez et al. 2004). The P3d and P3d_online pipelines are accessible through GUIs, facilitating the access of science data and calibration files, and the setup or modification of parameters. It is also possible to operate the pipeline from the IDL command line, using scripts instead of the GUI. P3d has also been successfully applied to data other than from PMAS, e.g. for MPFS, SPIRAL, INTEGRAL, and the VIMOS-IFU. More recently, P3d_online was modified to accommodate and visualize data obtained with the new PMAS fiber bundle IFU (PPak_online, see paper II).
4 Instrumental Performance
4.1 Assembly, Integration, and Tests
During the development phase, the various sub-components of PMAS were tested in the laboratory facilities of the AIP. These include tests in the mechanical, optical and electronics labs, as well as system checks at the AIP telescope simulator. The spectrograph optics were tested at the facilities of Carl Zeiss Jena (Roth et al. 2000b), see § 4.2. The image quality of all 256 microlenses of the lens array was measured at the AIP, see § 4.3. The complete fore optics, including the internal calibration unit were pre-assembled and tested at the optical laboratory. Extensive fiber tests, including throughput, focal ratio degradation and stress behaviour were undertaken using a specialized fiber testbench (Schmoll 2001, Schmoll et al. 2003). The three CCD cameras (A&G, single chip spectrograph, mosaic spectrograph) were assembled in the detector and clean room facilities and optimized with respect to dark current, readout noise, bias, gain, etc. using the AIP photometric testbench (Fechner et al. 2000). A commercial interferometer was used to assess the optical quality of the folding mirrors, the backside of the lens array, and the dewar windows.
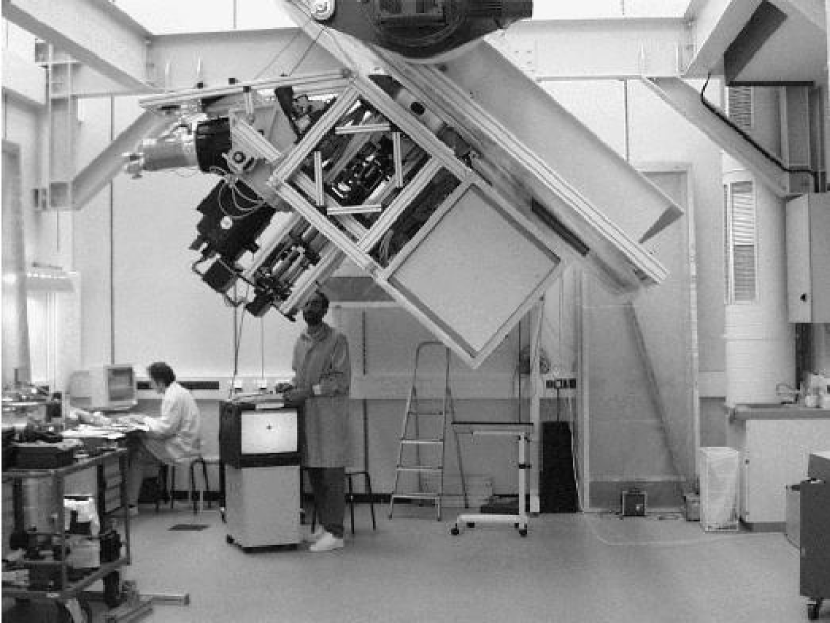
During the integration of the instrument, PMAS was mostly mounted to the telescope simulator at AIP (Fig. 11). This allowed good access to the instrument, helped in the alignment of the long fore optics tray, and, importantly, provided an option to tip-tilt the instrument. Measurements, often with high spatial magnification, were taken at various instrument inclinations, to evaluate the the mechanical and thermal stability (see § 4.8, 4.9), and § 4.10, respectively). Using a setup with pinholes and relay lenses, an artifical star was simulated and imaged onto the IFU and the A&G system. The actual spectrograph performance (i.e. PSF, dispersion, coverage, relative grating response, focus behaviour, etc.) was measured repeatedly. These measurements were also used to evaluate and optimize the fiber module, i.e. the mounting of the fiber slit, the quality of the index-matching, the alignment of the lens array, the fiber-to-fiber response, etc.
4.2 Spectrograph Optics
The spectrograph optical system, consisting of the collimator and camera subsystems, was delivered by the manufacturer with an end-to-end acceptance test, which was performed in collaboration with AIP. Details of this test were reported in Roth et al. 2000b, and here we shall only summarize some key features of the setup and the major results. In the absence of the PMAS spectrograph CCD camera, which was still under development at the time, a commercial cryogenic CCD camera (Photometrics AT200/CE200A), equipped with a blue-sensitive, backside-illuminated TK1024 CCD, was used to observe the image of an artificial star in the focal plane of the camera. The spot was enlarged with an 20 magnifying microscope objective, yielding a scale of 1.220.01 m/pixel. Collimator and camera were linearly aligned and illuminated so as to create a spot of controlled size at the collimator input, and uniform illumination at the nominal focal ratio of f/3 in the pupil plane. The results of the image quality tests are listed in Tab. 4.2 in terms of diameter of 80% encircled energy.
The overall transmission was not measured end-to-end, but estimated from the acceptance test records of the individual lens coatings, and from tabulated throughput data for the glasses and CaF2. The total transmission over the wavelength range 450–1000 nm is 80% and almost constant. Towards the blue, it drops nearly linearly to 70% and 55% at 400 nm and 350 nm, respectively.
A differential flexure test at the premises of Zeiss, which was performed by tilting the collimator-camera system with detector on a rigid platform in steps of 15∘ from 0 to 90∘, yielded an image shift of 7.51m over the whole tilt range, which was reproducible and gave no visible indication of PSF-variation. Note that during this test, the linear stages of the focusing lenses (both collimator and camera) were clamped on both sides, thus eliminating additional degrees of freedom. It was discovered later during the PMAS assembly, integration, and test phase that a lack of stability of those mechanisms is responsible for the noticeable flexure of the integrated instrument (see § 4.9).
Table 4
| [nm] | D80 design | D80+pinhole | D80 measured |
|---|---|---|---|
| 0∘ | |||
| 365 | 18.5 | 24.5 | 22.5 |
| 436 | 11.2 | 17.2 | 17.5 |
| 546 | 8.5 | 14.5 | 17.5 |
| 852 | 12.0 | 18.5 | 27.0 |
| 3.5∘ | |||
| 365 | 9.7 | 15.7 | 43 |
| 436 | 5.5 | 11.5 | 27 |
| 546 | 8.5 | 14.5 | 24 |
| 852 | 6.3 | 12.3 | - |
| 4.9∘ | |||
| 365 | 12.5 | 18.5 | 33 |
| 436 | 22.9 | 28.9 | 25 |
| 546 | 11.1 | 16.1 | 22 |
| 852 | 10.5 | 16.5 | - |
| 6.0∘ | |||
| 365 | 19.0 | 25.0 | 32 |
| 436 | 31.1 | 37.1 | 27 |
| 546 | 20.3 | 26.3 | 26 |
| 852 | 19.0 | 25.0 | - |
Encircled energy as function of field angle and wavelength. Column 1: wavelength in nm, col. 2: predicted D80 according to optical design, col. 3: predicted D80, convolved with 10m pinhole, col. 4: measured D80. (D80: diameter of 80% energy concentration [m])
4.3 Lens Array
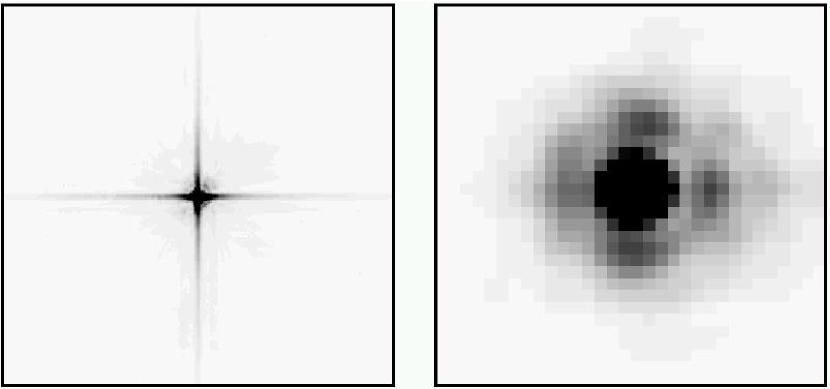
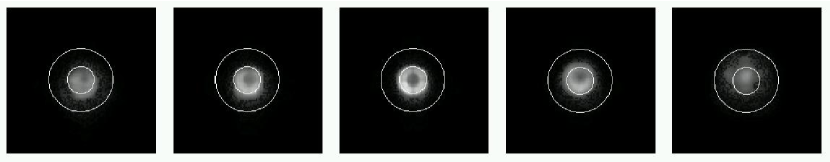
The lens array image quality was assessed in lab tests using the same cryogenic camera as described in § 4.2. A 10m pinhole was projected to infinity with a f=160mm achromatic lens, illuminating the lens array element under study. In its focal plane a 21-fold demagnified image of the pinhole was observed with the 20 microscope objective and the CCD camera. Due to the demagnification, the diameter of the pinhole image is negligible with respect to the Airy pattern of the spot such that the observed figure can be interpreted directly as the PSF of the lenslet. The left frame in Fig. 12 shows the superposition of 101 individual exposures of a single spot, which exhibits a very good S/N-ratio even at large radii from the centroid of the spot. The PSF core has a FWHM of 4.8m. The first Airy diffraction minimum occurs at a radius of 4.9 m. There are significant contributions of diffraction, aberration, and stray light to the extended wings of the PSF at low intensity levels.
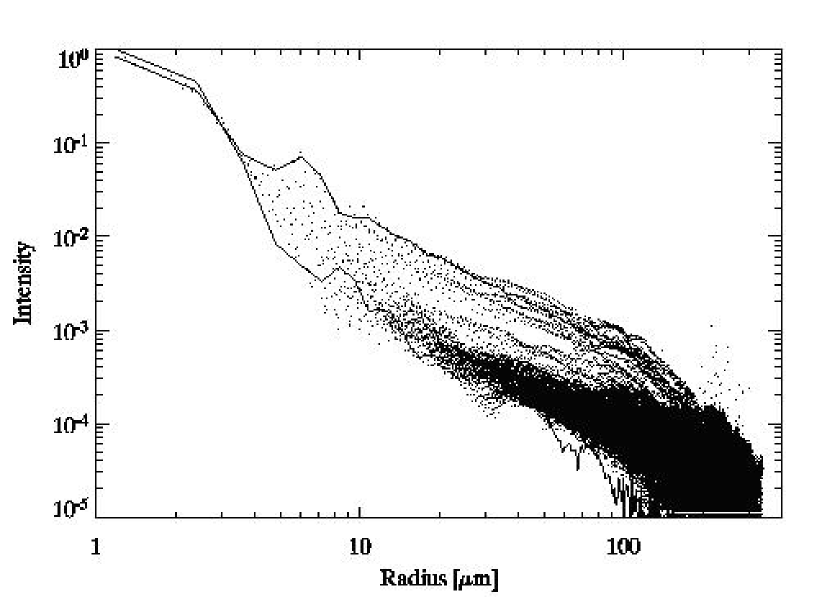
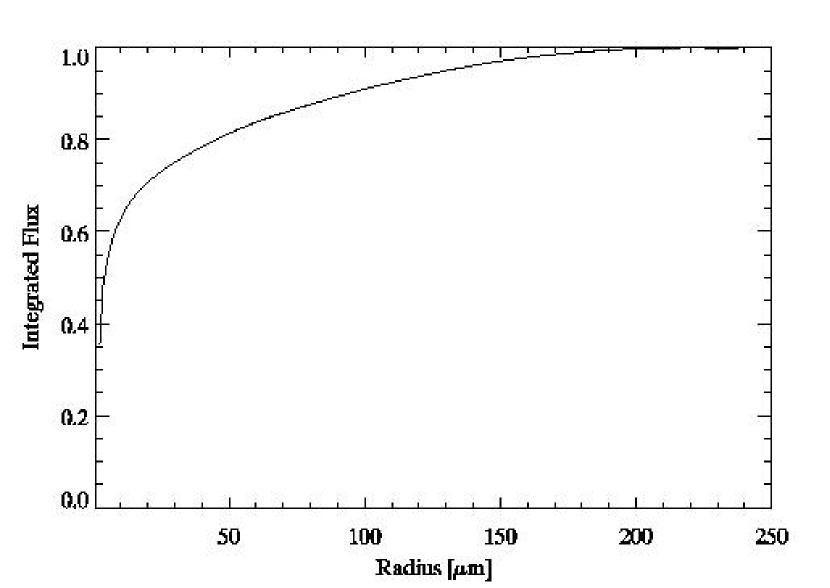
Fig. 13 shows a radial intensity plot of the spot. The dispersion over different azimuthal positions is due to the difference between the enhanced intensity along the pronounced diffraction spikes and the lower intensity in between. Fig. 14 shows a normalized curve-of-growth for the spot, plotting the encircled flux versus radius. The extended parts of the PSF, i.e. diffraction spikes and stray light, make a significant contribution to the total flux. 80% energy concentration is reached at a radius of 45m. By convolving the nominal 43m micropupil (0.5 arcsec/spaxel magnification) with this PSF and measuring the flux within the 100 m aperture of an ideally centered fiber, we find a typical light loss of 25-30 %. We have measured 80% energy concentration values for all lenslets of the first delivered array, as well as for random selections of lenslets of two 1616 element arrays, and of one 3232 element array from a second batch. We determined the following spot concentration statistics for these four devices, respectively: (40–55–65), (30–49–72), (30–57–70), (30–51–62), given as 10% – median – 90% percentiles for radii of 80% encircled energy [m]. We conclude that the performance is comparable to the “epoxy on glass” type of lens array in the study of Lee et al. 2001, but a factor of two better than the “crossed cylindrical lens” type made from fused silica, for which a device was tested which has similar parameters as the PMAS lens array (1mm pitch, f/5.5). Note that our results represent upper limits since the raw frames were not corrected for a possible additional stray light contribution from the microscope objective as advised by Lee et al. 2001.
4.4 Instrumental Throughput
The instrumental throughput was measured by observing spectrophotometric standard stars and correcting for the atmospheric transmission and reflection losses of the telescope. The observation of flux standards as routinely performed during most observing runs has shown that the atmospheric conditions at Calar Alto are often quite variable, making it difficult to establish a reliable extinction (see also Hopp&Fernandez 2002). On August 1, 2003, however, the flux standard BD+33d2642 (V=10.83, Oke 1990) was observed repeatedly under photometric conditions over the airmass range of 1.0 to 1.95, resulting in an accurate determination of the extinction curve for this night (Fig. 15).
The ratio of observed to expected photons defines the overall efficiency , which includes the instrument, the atmosphere and the telescope:
| (1) |
The atmospheric extinction coefficients for each wavelength were calculated in the standard way, using the repeated observations of the star at different airmasses (see Fig 15), which yielded =0.3 mag in V and =0.76.
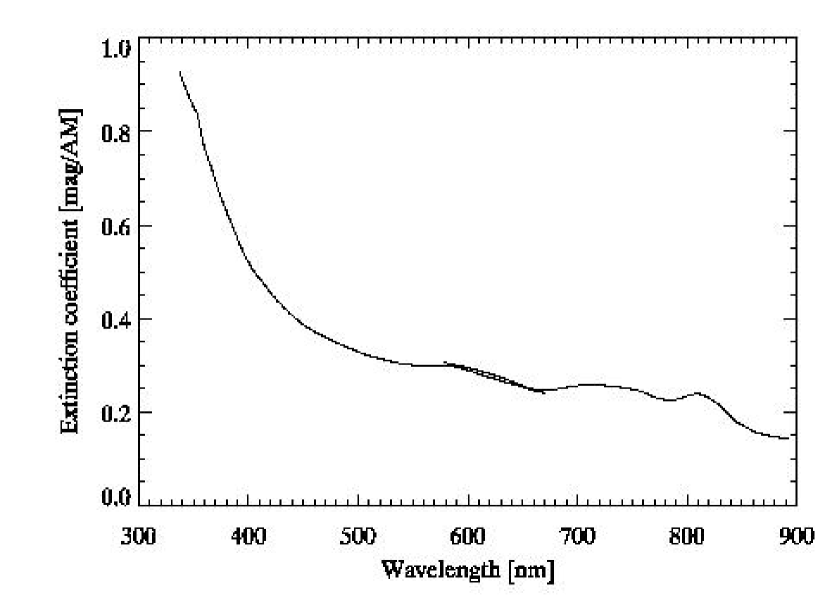
The reflectivity of the primary mirror is measured routinely at Calar Alto. Assuming a similar value for the secondary reflectivity, the telescope efficiency was estimated to be =0.54 in V at the time of observation. This allowed the determination of the PMAS instrumental response for the setup using the lens array IFU with FOV and the V300 grating. Instrumental throughput values for other configurations were obtained by bootstrapping from this measurement to the relative flux responses of domeflat exposures, using other gratings that are available for PMAS.
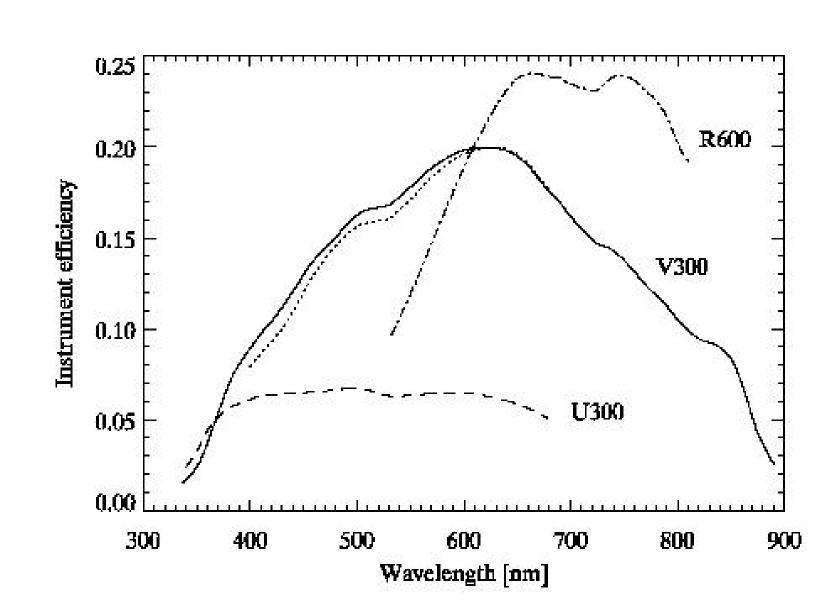
Figure 16 plots the pure PMAS instrumental efficiency , i.e. the throughput from the telescope focal plane to the detector. The maximum efficiency is found to be near 20% at 600 nm for gratings blazed at V. Redwards of 600 nm, gratings blazed at R show a peak efficiency of 24%. Gratings blazed at U are superior only at wavelengths below 360 nm. While the throughput depends on the blaze function of the gratings, it is almost independent of the groove density (e.g. 300, 600 or 1200 l/mm).
4.5 Fiber-to-Fiber Throughput Variations
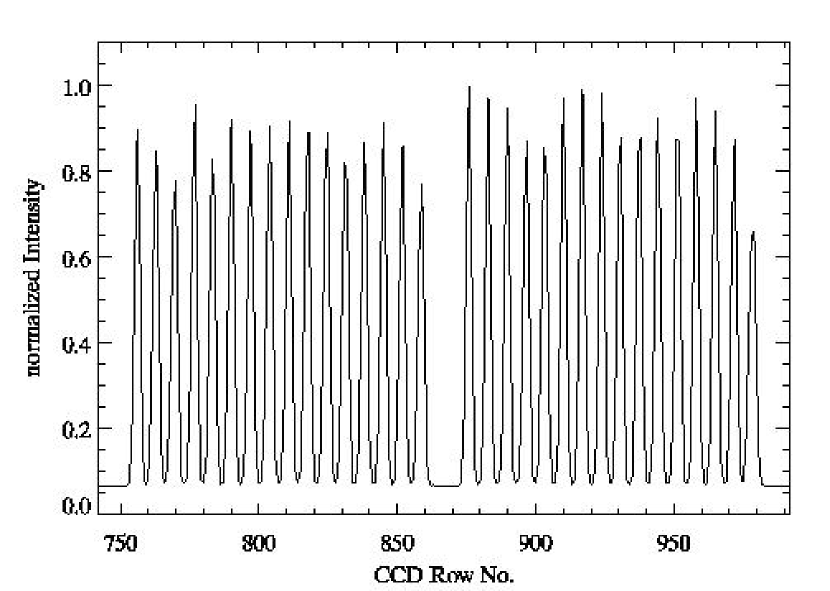
Due to the combined effect of less than perfect image quality for individual lens array lenslets, and alignment, coupling, and the transmission details of individual fibers, there are non-negligible throughput variations from spectrum to spectrum. Fig. 17 gives an impression for two groups of 16 spectra, corresponding to slitlets no. 7 and 8 near the center of the FOV.
Formally, the throughput variation measured from the flux obtained from extracted flatfield spectra amounts to 12% r.m.s. for all 256 spectra, or to 6% r.m.s. if three outlier groups are excluded. This method of characterization, however, is not a fair measure since the statistical distribution of fiber transmission values is non-normal, and the systematic effect of vignetting in FSPEC is not taken into account. We rather note that 77% of all spectra are performing with 80% throughput (T) in terms of peak transmission, 17% with 70%T80%, and 6% outliers with T70%.
4.6 Spectrophotometric Accuracy
The instrumental accuracy of spectrophotometric measurements is strongly dependent on the reliability of flux calibrations, i.e. the stability between measurements of a science target, and of the corresponding flux standard(s). Owing to variable atmospheric conditions at the site, an end-to-end validation seemed to be a less than trivial undertaking. Instead, internal spectrophotometric stability tests were taken in daytime or during nights with poor weather conditions, allowing the telescope to track on an imaginary target for many hours, and taking internal continuum and spectral line lamp exposures with the V300 grating over regular time intervals. Fig. 18 illustrates the result from a series of 24 such measurements at a declination of 37∘ 13m over an hour angle range of -2+2 hours.
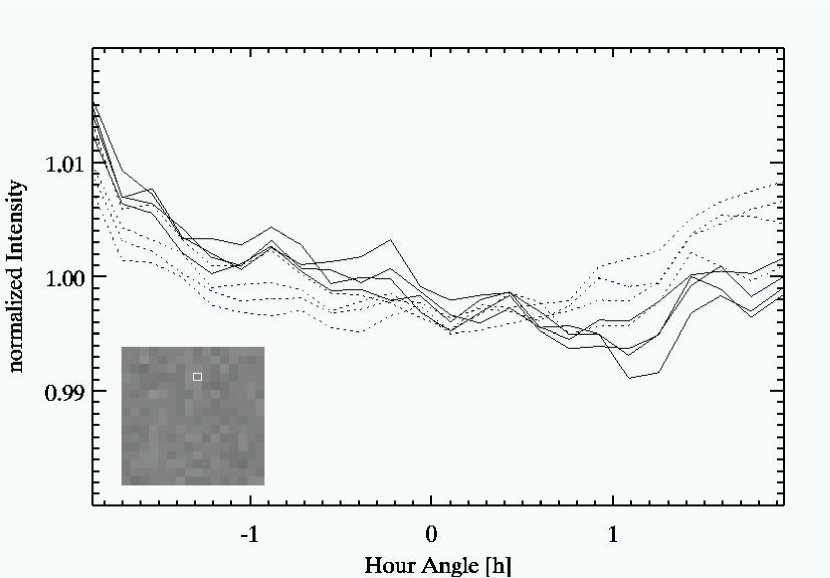
The continuum flatfield frames were bias-subtracted, traced, extracted, and wavelength-calibrated in the usual way (§ 3.8). The inspection of maps at selected wavelengths (or coadded over wavelength intervals), normalized to the frame taken at HA=0, yields varying patterns which are different from unity, indicating that the flatfielding process was less than perfect. As an example, Fig. 18 shows a plot of this variation vs. hour angle for the (arbitrarily chosen) fiber no. 200. The eight curves were obtained by averaging over 100 spectral pixels each, in increments of 100 pixels from a starting wavelength of 360nm. The blue bins are plotted as full lines, while the red bins are plotted as dotted lines for clarity. The reddening trend towards larger hour angles is seen for all fibers, indicating perhaps a color temperature change of the lamp and not an intrinsic feature of the IFU + fiber bundle. Nonetheless, a systematic variation in any wavelength bin, typically on the order of 1%, is observed over the 4 h duration of this test. We interpret this variation as the typical accuracy limit for long-term flux calibrations (albeit a caveat regarding the unkown stability of the calibration lamp). As the most likely cause for this behaviour, we adopt the hypothesis of a subtle lever effect on the fiber fieldlets (Fig. 7) under a varying gravity vector, leading to small micropupil–fiber displacements and a subsequent change of the lens array–fiber coupling efficiency. This hypothesis is supported also from a known sensitivity during the (difficult) lens array–fiber alignment process.
4.7 Mechanical stability of the A&G unit
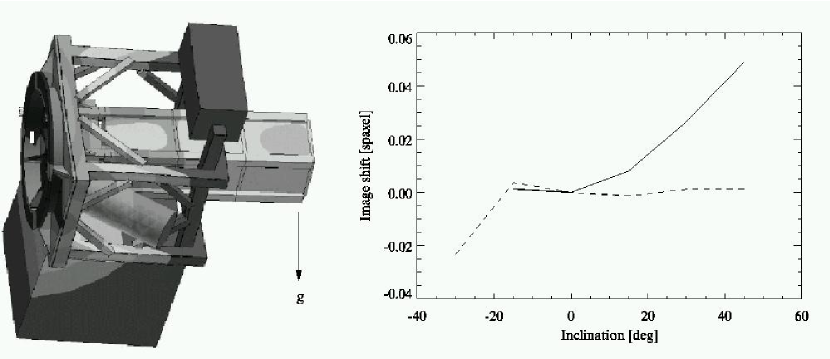
To evaluate possible flexure effects within the acquisition and guiding (A&G) system, which consists of folding mirrors and focusing lenses (§ 3.3), the image motion of an artificial star in the focal plane of the A&G camera was observed as a function of orientation. During tests at AIP, the telescope simulator was moved to a variety of inclinations ranging from -30 to +45 degrees. During commissioning at the CAHA 3.5 m Telescope, flexure measurements with zenith distances ranging from 0 to 63 degrees were performed. In both cases the average image shift was found to be 0.1 pixel (= 0.03 arcsec) and 0.3 pixel (=0.06 arcsec) in the x and y direction, respectively. This means that residual image shifts due to flexure are an order of magnitude smaller than the seeing disk and thus negligible for accurate guiding and offset applications.
4.8 Mechanical stability of the telescope module
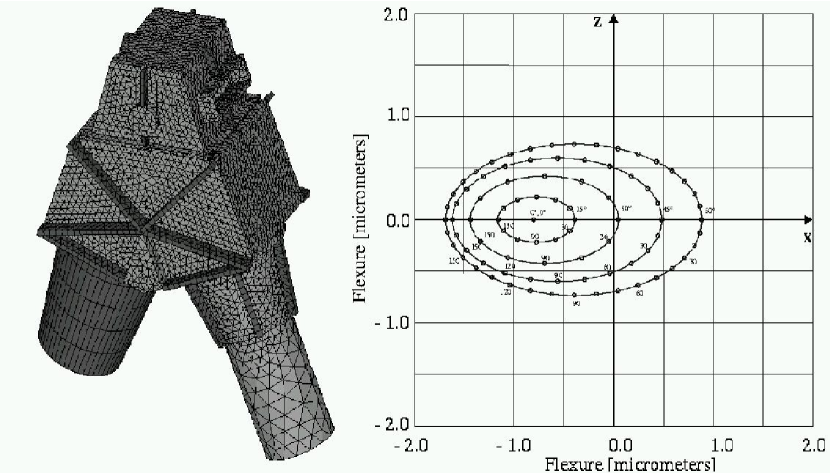
The telescope module contains a bench of 2m length which carries the fore optics and the lens array IFU. To estimate the flexure of the relative long optical bench, a finite element analysis (FEA) was performed. In the resulting optimized design, the telescope module tower is mounted only at its top end to the flange, but is not connected to the main frame. The bench structure together with cover plates was estimated to exhibit flexure less than 0.1 mm at 90∘ inclination of the instrument (Fig. 19).
During flexure tests the AIP, using a star simulator with a variety of pinholes, the image of an artificial star was projected onto the lens array. Spectrograph CCD exposures were taken for various inclinations of the telescope simulator, ranging between and . The image of the star at the IFU was reconstructed the centroid determined. The image shift on the IFU was found to be within 0.1 mm or of a spatial element (spaxel), which is in good agreement with the FE-model. Depending on the fore optics magnification this corresponds to an image motion of to , i.e. well below the seeing FWHM.
An analysis of real exposures of point sources observed for half an hour at the telescope, revealed no elongation of the images or asymmetries of the PSF, which might have been caused by flexure of the fore optics.
4.9 Mechanical stability of the spectrograph
The mechanical design of the spectrograph mechanical structure was optimized also with the help of ANSYS FEA (Dionies 1998). The final design predicts an image motion of less than 3 m at any telescope inclination (Fig. 20). Flexure tests undertaken at the AIP telescope simulator revealed considerably larger image shifts than expected, which were found to be caused by the rather instable focus mechanism of the spectrograph collimator and camera lenses, respectively. Since the focus stages are integral parts of the optical subsystems, it was not easily possible and considered a risk to replace the poorly performing devices at the time of commissioning. After some improvement by stiffening the external mechanical interface to the focus stages, the remaining flexure had to be tolerated for the time being.
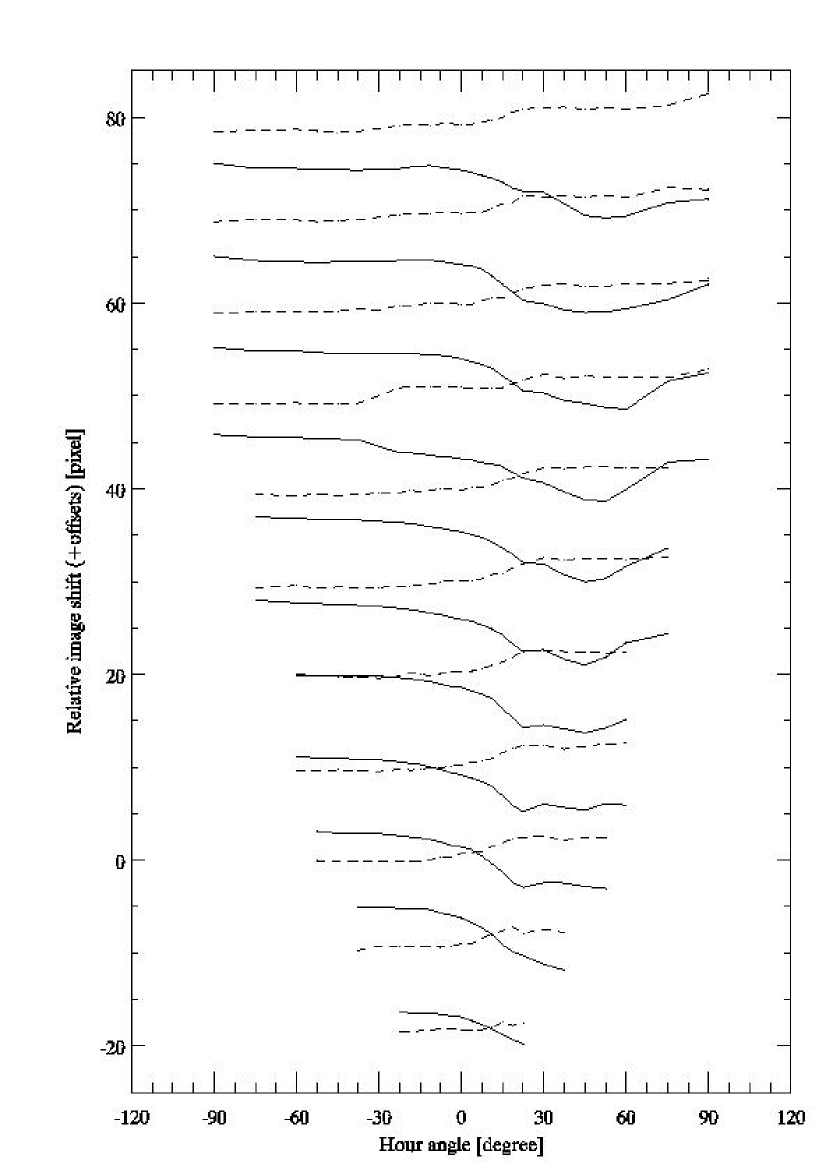
During some bad weather nights, flexure tests at the telescope were performed. The telescope was pointed to various (up to 256) positions in hour angle (H.A.) and declination (Dec.). At each pointing a short arc lamp exposure was taken with the spectrograph CCD, a 11 binned window around an isolated emission spot was read out, and the resulting image shift computed. Fig. 21 plots the relative shift of the centroid with respect to its position at zenith (H.A.=0:00 hr and =+37.1 deg).
The image shifts in the spectral and the spatial direction differ. Note that the shifts are relatively small for negative hour angles (east of the meridian; rising objects). A significant shift seems to occur during the transit period and for certain positive hour angles (west of the meridian; setting objects). In order to minimize the effects of flexure, resulting in a degradation of spectral resolution and in an increase of cross-talk between adjacent spectra, the critical positions near transit must be avoided during long exposures, or the exposure time must be segmented accordingly.
4.10 Thermal Stability
The variation of spectrograph best focus as a function of temperature was investigated at the telescope when an extended period of observing nights with identical setup parameters during the nights November 10 — 21, 2004, presented us with the opportunity to evaluate focus series measurements taken under similar conditions, but at different temperatures. The spot size was measured from the provided by Gaussian fits to the emission line spots in spectral line lamp exposures in the dispersion (X) and spatial (Y) directions, respectively. From previous experience with gratings in 1st order it was known that the two linear stages mounted in the collimator and camera lens barrels show a typical sensitivity of 150 m travel from which on a significant departure from best focus sets in (10 % increase of FWHM). The focusing lens positions on their linear stages are motor-controlled with a resolution of 1.45 m per encoder step. The setup for our test was a factor of 3 more sensitive to displacement with respect to FWHM in the dispersion direction since the J1200 grating in 2nd order was used for medium spectral resolution observations, which benefits from anamorphic demagnification. From the four nights of November 16–19, we were able to compare focus series measurements over a temperature range of -2.6, +0.2, +2.4, +4.0 ∘ C, respectively. The temperature value was taken from the data file FITS header entry for the dome temperature. A typical focus series is evaluated by plotting families of FWHM in X and Y vs. camera focus position, labeled by collimator focus position. Depending on a criterion (minimal FWHM in X, in Y, or optimal encircled energy for both directions), the curve presenting the absolute minimum over all pairs of collimator and camera positions is selected, and the minimum parameters are chosen for further use during observations. As a rule of thumb, the camera focus is roughly a factor of 3 more sensitive to displacement as collimator. For the analysis of thermal variation of best focus, we inspected the focus series plots for shifts of the minima as a function of temperature. As a result, we find a linear trend at temperatures 0…4 ∘ C, and a steeper gradient towards negative temperatures. Linear regression yields a camera focus shift of +19.90.7 m/∘ at positive temperatures. Below 0 ∘ C, we estimate a rate roughly 3 larger than this value (however, based only on a single data point). We did no recognize a significant temperature dependence of collimator focus over the observed temperature range, particularly.
4.11 CCD performance
The 1K1K TK1024 of the A%G CCD system has no major cosmetic flaws and is operated with a conversion factor of k=1.4 /ADU and a read noise of 4.6. The quantum efficiency of the chip as specified by the manufacturer is 65% at 400nm, 80% at 650nm, and 40% at 900nm.
The single chip spectrograph CCD system (1) with its standard gain setting has a read noise of 4.3 e- and a conversion factor of 1.4 e-/ADU. This CCD is read out over one functional amplifier. It has an approximately circular unresponsive spot at pixel coordinates (274,1642), 45 pixels in diameter, and bad columns beginning at (1624,2622), (1362,1232), and (546,1468). This type of SITe CCD is known to generate spurious charge and exhibit poor CTE performance with too fast parallel readout, which is why the chip must be clocked rather slowly. As a compromise, our ST002A is operated with a parallel clock cycle of 800sec/phase, which still generates a spurious charge pattern at a rate of 3 e-/row. The effect is seen e.g. in bias frames as a vertical ramp with an amplitude of 12 e-/pixel, adding a noise pedestal of 3 e- in the uppermost rows (and intermediate values below). The chip exhibits another disturbing feature which was initially seen in bias frames as a bright vertical bar of width 1100 columns and with an amplitude of 9 e-/pixel. This defect, however, disappeared when optimizing the clock pattern during wipe cycles such as to direct charge transfer away from the serial register rather than conventionally into it (reverse clocking). The quantum efficiency of the spectrograph camera (1) CCD was measured to be 46%, 65%, and 28%, at the wavelengths of 400nm, 650nm, and 900nm, respectively (albeit with the caveat of not having double-checked our laboratory flux standard against an independent secondary calibrator).
The mosaic spectrograph camera (2) is combining a science grade ST002A (ron=3.8 e-, k=1.36 e-/ADU) with an engineering grade chip (ron=9.7 e-, k=1.60 e-/ADU). The former chip has developed a most unfortunate luminescence effect as described by Janesick (2001), which has prevented us from combining it with the functional CCD of camera (1), see Roth et al. 2004c for details. Further efforts in optimizing the clock voltages (held in inversion during exposures) have been successful in so far as the luminescence effect has vanished. A residual hot column pattern, whose charge level is extremely sensitive to temperature changes, has rendered the mosaic camera unsuited for faint object spectroscopy, however still an option for bright targets where wavelength coverage is an issue.
4.12 A&G CCD photometry and astrometry
Although the A&G CCD camera was not designed to provide precision photometry in the first place, it is nonetheless considered a potentially useful calibrator for differential spectrophotometry, i.e. correcting for non-photometric conditions due to thin clouds as put forward e.g. by Barwig et al. 1987 (for a first application with PMAS, see Christensen et al. 2003). With observations of a stellar sequence in field F1038-8 from Stobie et al. 1985, we calibrated the A&G CCD camera with a series of 4 exposures of 30 s each, obtained on August 28, 2002, at an airmass of 1.17. We measured Star 1 (V=12.99), Star 2 (V=14.28), Star 4 (V=17.94), Star 5 (V=18.25), and Star 9 (V=20.25), which are simultaneously visible in the FOV. The exposures were taken through the PMAS V band filter, which is built according to the recipe by Bessell et al. 1990. Excluding Star 9 whose photometry is background-limited and thus less suitable for calibration, we fitted the count rates CTS [ADU/s] from aperture photometry of the 4 frames and obtained mag = -2.5 log (CTS) + ZP, with a zero point ZP = -24.225 0.02. The 2% error reflects the slightly non-photometric conditions of the night.
In order to check the optical system of the A&G Camera system for obvious distortions, archival data from an observing run in September 2002 were analyzed, using full-frame acquisition frames from 3 different fields. The observations were acquired in the PMAS V and R filters, yielding identical results. The astrometry was performed using the Starlink GAIA tool, comparing star detections against DSS plates and the USNO catalog. For each frame, 14-17 stars were found and their astrometric solution determined by the programme. As a result, the pixel scale was determined to 0.19660.0004 arcsec/pixel. The result is in very good agreement with the design value of 2.0 arcsec/pixel. The orientation, whose precise value depends on the position of the Cassegrain flange rotator after instrument changes, was determined to 90.8310.042 degrees. In practical terms, N appears to the left, E to the bottom, when using conventional display tools with CCD pixel (0,0) at the lower left.
4.13 Operation at the CAHA 3.5m Telescope
From the Spring Semester 2001 to Fall 2004, PMAS was scheduled for 33 observing runs over a total of 145 nights, and an additional number of 27 Service A buffer nights for several high-ranked programmes. Throughout these observing runs, PMAS worked reliably without any major failure, and not a single night was lost due to technical problems. Some selected science results from these first years of operation include the following: complete characterization of PSF as sampled by IFU, yielding a centroiding accuracy at a level of 10-3 arcsec, application to accurate spectrophotometry of faint, background-limited Planetary Nebulae in the bulge of M31 (Roth et al. 2004b), PSF-fitting analysis of multiply lensed QSOs (Wisotzki et al. 2003, 2004), first 3D spectrophotometry of a supernova type Ia (Christensen et al. 2003), 3D spectroscopy of Ly- emitters associated with the DLA system Q2233+131 (Christensen et al. 2004), abundances and kinematics of a candidate sub-damped Lyα galaxy toward PHL 1226 (Christensen et al. 2005), the ultra-luminous Xray source X-1 in Holmberg II (Lehmann et al. 2004), crowded field 3D spectroscopy on LBV candidate and circumstellar nebula in M33 (Becker et al. 2004), and others 444seehttp://www.aip.de/groups/opti/pmas/OptI_pmas.html. PMAS has been offered as a common user instrument under contract with MPIA Heidelberg from the F2002 semester for a period of 3 years and possible future extensions. During this period of operation, PMAS has enjoyed considerable interest from observers to the extent that it performed as the 2nd most demanded instrument at the 3.5m Telescope over the past two years.
5 Summary
PMAS is the first dedicated 3D Spectrophotometer with low to medium spectral resolution, showing a peak instrumental transmission of 24% and good performance over the whole optical window 0.35—1 m, especially near the atmospheric cutoff in the blue. The internal accuracy for flux calibrations over several hours is limited to 1%. The concept of a fiber-coupled lens array type of IFU has proven to be capable of accurately recording the PSF with a centroiding accuracy at the milli-arcsec level. PMAS has been used successfully for a variety of astrophysical problems, yielding a number of original publications which have indeed benefitted from high spatial resolution, 3D spectrophotometry, and the additional information one can retrieve from PSF fitting techniques. The instrument has been reliably working over 3 years without any major failure. Newly installed features include PPak, the currently largest FOV IFU world-wide, a nod-shuffle mode of operation for accurate sky-subtraction, and the PYTHEAS mode for an increased spectral resolution over a wide free spectral range. Two underperforming properties viz. (1) flexure, introduced by the unstable focusing stages of the FSPEC optical systems, and (2) rather modest QE and overall quality of both the single CCD and the mosaic CCD cameras, are planned to be fixed in a future overhaul and detector upgrade, respectively. The successful exploration of PSF-fitting techniques and crowded-field 3D spectroscopy has important implications for a new generation of advanced 3D spectrographs such as MUSE for the ESO-VTL (Bacon et al. 2004).
ACKNOWLEDGMENTS
Part of this work was supported by the German Deutsche Forschungsgemeinschaft, DFG under grant HA1850/10-3 , and by the German Verbundforschung des BMBF, grants 053PA414/1, 05AL9BA1/9, and 05AE2BAA/4. MMR, TB, PB, and AK acknowledge DFG travel grants for several observing runs at Calar Alto. MMR, TB and JS are grateful to Victor Afanasiev and Serguei Dodonov, Special Astrophysical Observatory in Selentchuk, Russia, for hospitality during observing runs at the 6m BTA, and for fruitful discussions and insight into 3D spectroscopy. The authors wish to thank ESO ODT and former team leader Jim Beletic for permission to copy the ESO design CCD detector head and the ACE CCD controller, as well as advice from Roland Reiss, Sebastian Deiries, and generous support throughout. The support of Calar Alto staff during the PMAS commissioning phase and in operation is gratefully acknowledged. Thanks are due to Sebastian Sanchez for help with grating efficiency measurements, and for designing the PMAS archive database. The PMAS Team is especially indebted to Nicolas Cardiel for excellent support during normal and service mode observations.
References
- Allington-Smith et al. (2002) Allington-Smith et al. 2002, PASP114, 892
- Arribas et al. (1998) Arribas, S., Mediavilla, E., Garcia-Lorenzo, B., del Burgo, C., Fuensalida, J.J. 1998a, A&AS136, 189
- Bacon et al. (2004) Bacon, R., et al. 2004, Proc. SPIE, 5492, 1145
- Barwigetal (1987) Barwig, H., Schoembs, R., Buckenmayer, C. 1987, A&A175, 327
- Becker (2002) Becker, T. 2002, Thesis, University of Potsdam
- Becker et al. (2004) Becker, T., Fabrika, S., & Roth, M. M. 2004, AN, 325, 155
- Bershady et al (2004) Bershady, M. A. Andersen, D. R., Harker, J., Ramsey, L. W., Verheijen, M. A. W. 2004, PASP116, 565
- Bessell (1990) Bessell, M. S. 1990, PASP, 102, 1181
- Christensen et al. (2003) Christensen, L., Becker, T., Jahnke, K., Kelz, A., Roth, M. M., S nchez, S. F., Wisotzki, L. 2003, A&A401, 479
- Christensen et al. (2004) Christensen, L., Sanchez, S. F., Jahnke, K., Becker, T., Wisotzki, L., Kelz, A., Popovic, L., Roth, M.M. 2004, A&A417, 487
- Christensen et al. (2005) Christensen, L., Schulte-Ladbeck, R. E., Sánchez, S. F., Becker, T., Jahnke, K., Kelz, A., Roth, M. M., & Wisotzki, L. 2005, A&A, 429, 477
- de Zeeuw et al. (2002) de Zeeuw, P. T., Bureau, M., Emsellem, E., Bacon, R., Carollo, C. M., Copin, Y., Davies, R. L., Kuntschner, H., Miller, B. W., Monnet, G., Peletier, R. F., Verolme, E. K., 2002, MNRAS, 329, 513
- Dionies (1998) Dionies, F. 1998, Thesis, Fachhochschule Brandenburg, Germany
- Eisenhauer et al. (2003) Eisenhauer, F., et al. 2003, Proc. SPIE, 4841, 1548
- Elias et al. (1998) Elias et al. 1998, Proc. SPIE, 3354, 555
- Fechner et al (2000) Fechner, T., Wolter, D.. Roth, M. M. 2000, Proc. Optical Detectors for Astronomy II, 45
- Hawarden et al. (2003) Hawarden, T.G., Dravins, D., Gilmore, G.F., Gilmozzi, R., Hainaut, O., Kuijken, K., Leibundgut, B., Merrifield, M.R., Queloz, D., Wyse, R.F.G. 2003, Proc. SPIE 4840, 299
-
Hopp&Fernandez (2001)
Hopp, U., Fernandez, M. 2002,
Calar Alto Newsletter No.4,
http://www.caha.es/newsletter/news02a/boletin4.html - Kelz et al. (2003a) Kelz, A., Roth, M. M., & Becker, T. 2003a, Proc. SPIE, 4841, 1057
- Kelz et al. (2003b) Kelz, A., Roth, M. M., Becker, T., & Bauer, S. 2003b, Proc. SPIE, 4842, 195
- Kelz et al. (2004) Kelz, A., Verheijen, M., Roth, M. M., Laux, U., & Bauer, S. 2004, Proc. SPIE, 5492, 719
- Janesick (2001) Janesick, J.R. 2001, “Scientific charge-coupled devices”, SPIE, Bellingham USA, 668
- LeCoarer (1995) Le Coarer, E., Bensammar, S., Compte, G., Gach, J.L., Georgelin, Y. 1995, A&AS111, 359
- Lee_et_al_(2001) Lee, D., Haynes, R., Ren,D., Allington-Smith, J. 2001, PASP113, 1406
- LeFevre et a (2003) LeFevre et al. 2003, Proc. SPIE4841, 1670
- Laux (1999) Laux, U. 1999, Astrooptik: Optiksysteme für die Astronomie, Verlag Sterne und Weltraum, Heidelberg
- Lehmann et al. (2004) Lehmann, I., Becker, T., Fabrika, S., Roth, M.M., Miyaji, T., Afanasiev, V., Sholukhova, O., Sanchez, S.F., Greiner, J., Hasinger, G., Costantini, E., Surkov, A., Burenkov, A. 2004, A&A, accepted (astro-ph/0410458)
- Lizon (1997) Lizon, J.-L. 1997, The Messenger 88, 6
- Najita & Strom (2002) Najita, J. & Strom, S. E. 2002, Proc. SPIE, 4835, 1
- Oke (1990) Oke, J. B. 1990, AJ, 99, 1621
- Pasquini et al. (2000) Pasquini, L., et al. 2000, Proc. SPIE, 4008, 129
- (32) Reiss, R. 1994, Proc. SPIE, 2198, 895
- Roth (1990) Roth, M.M. 1990, in ASP Conf. Ser. 8, CCDs in Astronomy, ed. G.H. Jacoby (San Francisco: ASP), 380
- Roth, Seydack, Bauer, & Laux (1997) Roth, M. M., Seydack, M., Bauer, S., & Laux, U. 1997, Proc. SPIE, 2871, 1235
- Roth,Laux (1998) Roth, M.M., Laux, U. 1998, in ASP Conf. Ser. 152, Fiber Optics in Astronomy III, ed. S. Arribas, E. Mediavilla, F. Watson (San Francisco: ASP), 168
- Roth et al. (2000a) Roth, M. M. et al. 2000a, Proc. SPIE, 4008, 277
- Roth et al. (2000b) Roth, M. M. . Laux, U., Heilemann, W. 2000b, Proc. SPIE, 4008, 485
- Roth, Becker, & Schmoll (2000c) Roth, M. M., Becker, T., & Schmoll, J. 2000c, ASP Conf. Ser. 195: Imaging the Universe in Three Dimensions, ed. W. van Breugel & J. Bland-Hawthron (San Francisco: ASP), 122
- (39) Roth, M.M., Becker, T., Böhm, P., Kelz, A. 2002a, Proc. Scientific Drivers for ESO Future VLT/VLTI Instrumentation, eds. J. Bergeron, G. Monnet, Springer, 136
- Roth, Becker, & Kelz (2002) Roth, M. M., Becker, T., & Kelz, A. 2002b, ASP Conf. Ser. 282, Galaxies: the third Dimension, ed. M. Rosado, L. Binette, L. Arias (San Francisco: ASP), 403
- Roth, Becker, Böhm, & Kelz (2002) Roth, M. M., Becker, T., Böhm, P., & Kelz, A. 2002c, ASP Conf. Ser. 282, Galaxies: the third Dimension, ed. M. Rosado, L. Binette, L. Arias (San Francisco: ASP), 411
- Roth et al. (2002d) Roth, M. M., Fechner, T., Wolter, D., Kelz, A., & Becker, T. 2002d, Experimental Astronomy, 14, 99
- Roth et al. (2003) Roth, M. M., Laux, U., Kelz, A., & Dionies, F. 2003, Proc. SPIE, 4842, 183
- (44) Roth, M. M., Becker, T., Boehm, P., Kelz, A. 2004a, AN 2, 147
- (45) Roth, M. M., Becker, T., Kelz, A., Schmoll, J. 2004b, ApJ603, 531
- Roth et al. (2004c) Roth, M. M., Fechner, T., Becker, T., & Kelz, A. 2004c, Proc. SPIE, 5499, 387
- Roth et al. (2004d) Roth, M. M., Fechner, T., Wolter, D., Kelz, A., & Becker, T. 2004d, Scientific Detectors for Astronomy, The Beginning of a New Era; eds. Amico, P.; Beletic, J. W.; Beletic, J. E., Dordrecht: Kluwer, 371
- Sanchez (2004) Sánchez, S.F. 2004, AN 325 (2), 167
- Sanchezetal (2004) Sánchez, S.F., Becker, T., Kelz, A. 2004, AN 325 (2), 171
- Schmoll (2001) Schmoll, J. 2001, Thesis, University of Potsdam
- (51) Schmoll, J., Roth, M.M., Laux, U. 2003, PASP115, 854
- Schweizer (1979) Schweizer, F. 1979, PASP, 91, 149
- Si’lchenko&Afanasiev (2000) Si’lchenko, O., Afanasiev, V. 2000, A&A364, 479
- Stobie (1985) Stobie, R.S., Sagar, R., Gilmore, G. 1985, A&AS60, 503
- Verheijen (2004) Verheijen, M.A.W., Bershadey, M.A., Andersen, D.R., Swaters, R.A., Westfall, K., Kelz, A., Roth, M.M. 2004, AN 325 (2), 151
- (56) Wisotzki, L., Becker, T., Christensen, L., Helms, A., Jahnke, K., Kelz, A., Roth, M.M., Sanchez, S.F. 2003, astro-ph/0307147
- Wisotzki et al. (2004) Wisotzki, L., Schechter, P. L., Chen, H.-W., Richstone, D., Jahnke, K., Sánchez, S. F., & Reimers, D. 2004, A&A, 419, L31