Observational evidence for the presence of PAHs in distant
Luminous Infrared Galaxies using ISO and Spitzer
We present ISOCAM 15 m and MIPS 24 m photometry of a sample of 16 distant Luminous Infrared Galaxies (LIRGs) characterized by a median luminosity L 21011 L⊙ and redshift (distributed from to 1.2). While some sources display 24/15 m flux ratios also consistent with a featureless continuum dominating their mid-infrared (MIR) spectral energy distributions (SEDs), the presence of prominent emission features such as the Polycyclic Aromatic Hydrocarbons is clearly required to explain the observed colors for more than half of the sample. As a result, a general good agreement is observed between the data and predictions from the local starburst-dominated SEDs that have been used so far to constrain IR galaxy evolution. This is consistent with the star-forming nature of LIRGs derived from previous works, even though our approach cannot rule out the dominance of an AGN in some cases. Our study also supports the possibility of tracing the total IR luminosity of distant galaxies (up to 1) from their MIR emission.
Key Words.:
Galaxies: evolution – Infrared: galaxies – Galaxies: starburst1 Introduction
The excess of faint sources in the deep extragalactic surveys performed in the MIR to sub-millimeter with their associated redshift distributions when available, together with the shape and intensity of the cosmic IR background (CIRB, Puget et al. 1996), which measures the extragalactic IR light radiated above 3 m and is at least equal to the UV to near-IR extragalactic background light (Gispert et al. 2000; Hauser & Dwek 2001), suggest that a large fraction of the UV radiation of young stars was reprocessed by dust in the mid to far IR range over the Hubble time. The cosmic star formation history- the star formation rate (SFR) per unit comoving volume as a function of redshift- would be dominated by intense star formation phases, during which the bulk of the UV light is reprocessed by dust in the IR with a rapid decline of the SFR density since 1 and a flat or possibly slow increase from 5 to 1 (Chary & Elbaz 2001, Lagache et al. 2004 and references therein). These models called “backward evolution models” because they evolve the local luminosity function in the MIR as a function of redshift, assume that the shapes of distant SEDs in the MIR remain similar to the ones observed in local galaxies and are directly related to the total IR luminosity.
The goal of the present study is to check the validity of this assumption up to 1 by combining data from ISOCAM (Cesarsky et al. 1996a), the MIR camera onboard the Infrared Space Observatory (ISO, Kessler et al. 1996), and MIPS, the Multiband Imaging Photometer for Spitzer (Rieke et al. 2004) onboard the Spitzer Space Telescope (Werner et al. 2004). Studying the MIR shape of distant galaxies is particularly relevant since direct FIR observations are rapidly confusion limited and strongly affected by moderate sensitivity limits. On the other side of the peak of the IR SED, sub-millimeter observations are presently limited to the detection of ultra-luminous IR galaxies (ULIRGs) above 2 (Chapman et al. 2003). In the near future, before the launch of Herschel and the advent of ALMA, the best constraints on the evolution of luminous IR galaxies (LIRGs), i.e. galaxies with L 1011 L⊙, as a function of redshift and on their role in the global evolution of galaxies will exclusively come from the MIR. Around 0.7, LIRGs are too faint to be measured through direct spectroscopy in the MIR with the infrared spectrograph (IRS, Houck et al. 2004a) onboard Spitzer. The only remaining technique to contrain the MIR shape of distant LIRGs is therefore to combine MIR measurements for LIRGs located at different redshifts, hence spanning a larger range of rest-frame wavelengths. In the present study, a redshift range of 0.1-1.2 allowed us to study the 5 to 25 m rest-frame part of the MIR SEDs. In this wavelength range (see Genzel & Cesarsky 2000), the SED is dominated by the combination of broad emission lines, generally interpreted as due to polycyclic aromatic hydrocarbons (PAHs), and of the continuum emission of stochastically heated “very small grains” of dust transiently heated to temperatures of the order of 200 K. The thermal emission of “big grains” of dust heated to 40 K also contributes partly to the MIR emission but peaks in the FIR (between 80 and 100 m typically) and contains the bulk of the luminosity radiated by galaxies above 3 m. Finally, hot dust emission due to dust heated by an active galaxy nucleus (AGN) can also contribute to and sometimes even dominate the MIR spectrum of a galaxy. Before deriving the IR luminosity for a galaxy that will be used to compute its SFR, one must start by making sure that its MIR SED is not polluted by the AGN emission. The presence of PAHs as well as a rapid decline of the continuum emission below 5 m strongly suggests a star formation origin for the emission (Genzel & Cesarsky 2000, and references therein). Local LIRGs are rarely affected by an AGN, contrary to ULIRGs above 1012.3 L⊙. Using a combination of template SEDs and deep X-ray surveys with XMM-Newton and Chandra, Fadda et al. (2002) derived an upper limit to the contribution of an AGN to the MIR light radiated by ISOCAM selected LIRGs up to 1 of 20 %.
The MIR emission of local star forming galaxies- at 6.75, 12 and 15 m- was proven to correlate, with some scatter, with the total IR one, i.e. from 8 to 1000 m, which is largely dominated by the FIR component (Chary & Elbaz 2001, Elbaz et al. 2002). However, the validity of these correlations in the more distant universe has not yet been established. Galaxies were less metal rich in the past. Their shape and compacity evolving with time might also affect their SEDs. Local galaxies SEDs do present some variations in the MIR as a function of metallicity. The metal-deficient (Z=Z⊙/41) blue compact dwarf galaxy SBS 0335-052, for example, is bright in the MIR range but still does not show any sign of the presence of the PAH features which the authors interpret as an effect of the destruction of their carriers by the very high UV energy density (Thuan, Sauvage & Madden 1999, Houck et al. 2004b).
Throughout this paper, we will assume Ho= 70 km s-1 Mpc-1, = 0.3 and .


2 Sample selection and data reduction
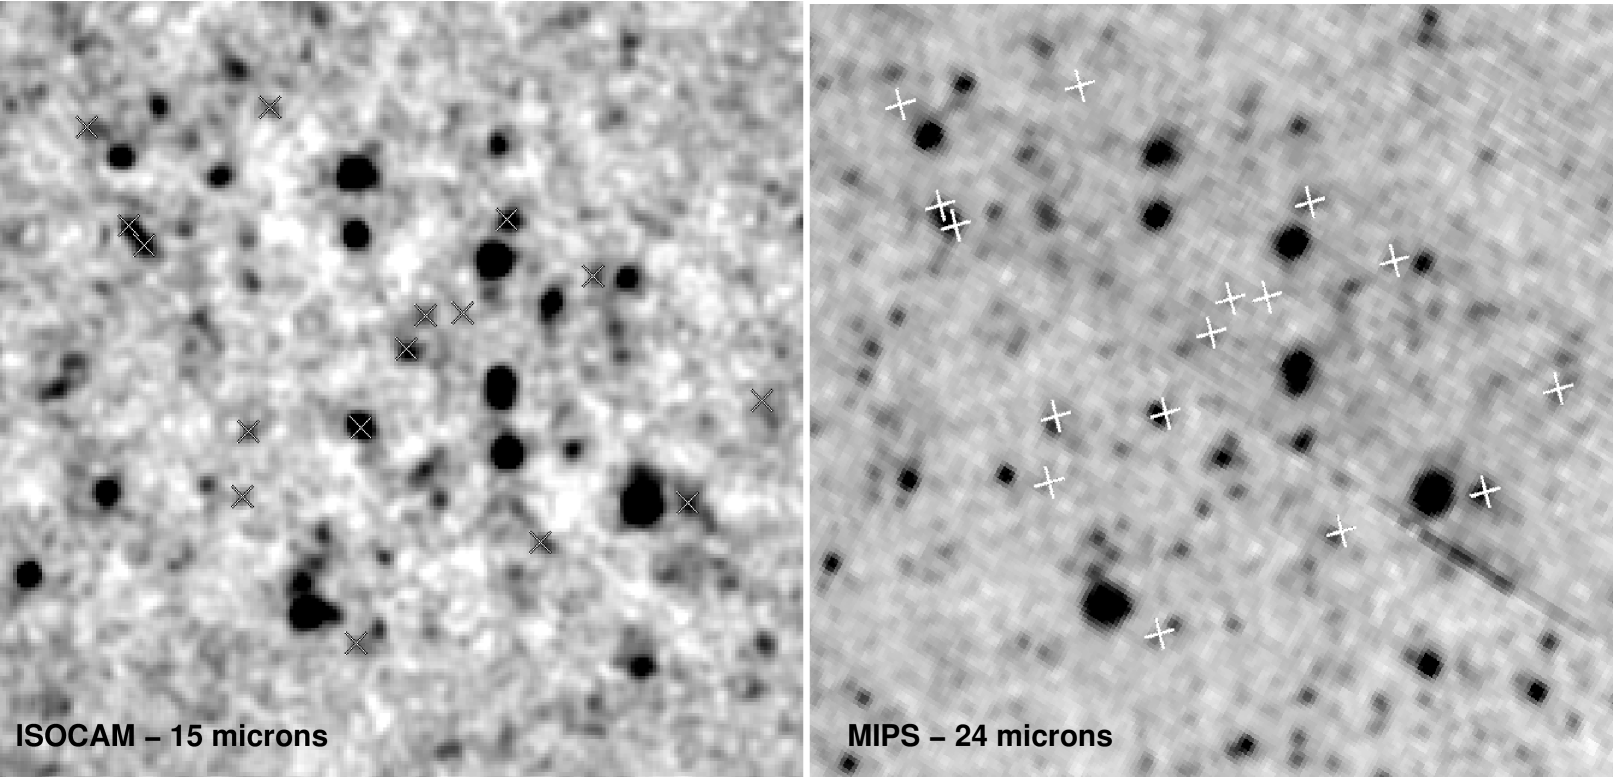
A 30’30’ field was imaged by ISOCAM at 15 m in the Marano FIRBACK region centered on (3h13m10s,-55o03’39”), about two thirds of which is covered by a larger MIPS-24 m image of 1.4 with a 80 % completeness limit of 170 Jy. The central part of this field (7’7’, UDSF for “ultra-deep survey firback”) was covered down to an 80 % completeness limit of 140 Jy at 15 m with ISOCAM, a depth similar to the MIPS one (see Fig. 1). The ISOCAM-15 m UDSF belongs to the ISOCAM Guaranteed Time Extragalactic Surveys (IGTES, Elbaz et al. 1999). Six overlapping mosaics were performed in the micro-scanning mode of ISOCAM for a total of 2.7 hours of integration per sky pixel and leading to a final projected map with 2 pixels. The data were reduced using PRETI (Starck et al. 1996) and the transient correction as well as the assessment of the completeness limit were computed by Monte Carlo simulations with fake sources of known flux densities in the real images.
The 24 m observations were performed during the MIPS commissioning phase (IOC/SV) in November 2003. The scan map AOT was used, with an half-array overlap to cover about 1300 Sq. Arcmin with high redundancy (20) and to get an integration time per sky pixel of about 230s (Papovich et al. 2004). The data were reduced using the Spitzer Science Center Pipeline and the BCD products (Basic Calibrated Data, Pipeline version S10.0.3) were downloaded from the Spitzer archive111http://archive.spitzer.caltech.edu, PID: 718. PSF-fitting photometry was performed using DAOPHOT (Stetson 1987) with IRAF222IRAF is distributed by the National Optical Astronomy Observatories, which are operated by the Association of Universities for Research in Astronomy, Inc., under the cooperative agreement with the National Science Foundation.
For the present study, we used a sample of 16 galaxies detected with both ISOCAM and MIPS at 15 and 24 m respectively and identified with crosses in Fig. 1. This set of galaxies was extracted from a larger sample of ISOCAM selected galaxies for which medium resolution (R=1200) VLT-FORS2 spectra were obtained (Liang et al. 2004) in the “Marano FIRBACK” field. Oxygen abundances were obtained for half of them with values of 12+log(O/H) ranging from 8.4 to 9. With a median stellar mass of 51010 M⊙ and redshift of 0.7, they are among the most massive galaxies in this redshift range but exhibit metallicities about twice smaller than their nearby counterparts suggesting that they will produce about half of their metals from 1 to 0 (Liang et al. 2004). Finally, it must be noted that even though no direct FIR measurement exists for this sample of galaxies at present, there is indirect evidence that the MIR-FIR correlations remain valid up to 1. Indeed, MIR and radio measurements provide consistent predictions for the FIR luminosity of distant galaxies up to 1 (Elbaz et al. 2002, Appleton et al. 2004).
3 Discussion
Fig. 2 presents the 15 and 24 m luminosities of the 16 galaxies detected with ISOCAM and MIPS in the UDSF fitted by a library of template SEDs from Chary & Elbaz (2001). This library of 100 template SEDs, from log(LIR/L⊙)= 8.5 to 13.5, was generated between 0.1 and 1000 m to reproduce the trend observed for local galaxies between MIR and FIR luminosities. The MIR (420 m) part was produced by interpolating between the ISOCAM CVF spectra of four prototypical galaxies (Arp220, NGC6090, M82 and M51), hence all SEDs contain PAH features. Because the 6.75, 12 and 15 m luminosities of a local galaxy correlate with its total IR luminosity, , it is possible to use a single MIR measurement to derive , and therefore a SFR, for nearby galaxies. In “backward evolution models”, such as Chary & Elbaz (2001), the 15 m luminosity function is evolved as a function of redshift to reproduce the observe galaxy counts and the CIRB, assuming that a template SED is uniquely determined by a given 15 m luminosity. To fill the gaps between the observed 6.75, 12 and 15 m correlations, the templates interpolated for all total IR luminosities were used. We used the same technique to derive from (measured with ISOCAM), from (measured with MIPS) and from the combination of and . First, the 100 template SEDs were redshifted at the redshift of a given galaxy among the 16 and a flux density was determined at 15 m using the filter response of ISOCAM. Second, the SED which 15 m flux density was the closest to the observed one was selected and normalized to reach the observed 15 m flux density. The total IR luminosity of this galaxy is . Using the same strategy, we computed . Lastly, we selected the SED which minimized the of the observed 15 and 24 m flux densities with their associated error bars and derived a third luminosity, . The MIR luminosities in the rest-frame of the galaxies (crosses proportional to the filter width and error bar on the flux density) are compared to the SEDs used to compute in Fig. 2 and their associated MIR luminosities (filled circles).
The values of derived by the three techniques are equal with a 1- dispersion of only 20 %, which confirms the robustness of this technique. Hence on average, the combination of both instruments will affect the predicted values with a 20 % dispersion only with respect to the use of only one of the two instruments. Hence the global shape of the template SEDs is such that it can be used to predict with this accuracy the other MIR value, suggesting that the SEDs did not vary very much since 1. In the “starburst” regime, i.e. below L⊙, the template SEDs do not provide a good fit to the galaxy “#1” ( 0.4656, log[/L⊙]=10.7), which behaves very similarly to NGC 7714 (Brandl et al. 2004) as shown in dashed line in Fig. 2. The dispersion observed even among local galaxies, for example in the MIR-FIR correlations already suggested that an ideal library of template SEDs would have to include a variation of shapes for each bin.
The bold SED in the middle of Fig. 2 presents a strong evidence for the presence of the 7.7 m PAH feature, band or complex. The rest-frame 9 m luminosity of this 1011.1 L⊙ galaxy ( 0.7) is 1.8 times larger than the 14 m one, which is natural when PAHs are present but rules out a hot dust continuum emission as the one locally observed in individual HII regions (such as M17, Cesarsky et al. 1996b), dwarf galaxies (Thuan, Sauvage & Madden 1999) or even Compton-thick Seyfert 2’s (such as NGC 1068, bold dashed line in the Fig. 2; Le Floc’h et al. 2001). The SEDs were sorted as a function of increasing redshift in the Fig. 2 in order to illustrate the effect of the k-correction which acts as a low resolution spectrograph by shifting the broadband ISOCAM and MIPS filters to lower wavelengths with increasing redshift. The good quality of the fit was obtained without allowing the luminosity of the template SEDs to vary which illustrates the very good agreement with observations at 5-25 m rest-frame.
The templates from Chary & Elbaz (2001) are therefore consistent with the observed 24/15 m colors of distant sources considered as a whole. However it is worth mentioning that they do not provide a unique solution for every galaxy of the sample, since some of them can also be fitted by a feature-less continuum (e.g., ID #25 in Fig. 2). This issue is explored with more details in Fig. 3 (similar to Fig.1 of Charmandaris et al. 2004) where we compare the colors derived from our sources with what would be observed as a function of redshift for different object types such as the Seyfert 2 prototype NGC 1068, two enshrouded IR-luminous systems with deep silicate absorption (Arp 220: Elbaz et al. 2002; NGC 4418: Spoon et al. 2001), M82 and three template SEDs (as in Fig.2). The comparison shows that galaxies with can indeed be explained by power-law spectra with no significant contribution from PAHs. This fitting degeneracy results in an additional uncertainty in the extrapolation to the total IR luminosity (typically a factor of 2), and it also indicates that our approach is not sufficient in itself to discreminate between starbursts and AGNs. Nonetheless, a non negligible fraction of sources at 0.2-0.8 ( 40-50%) exhibit colors larger than 1. The latter can not be reproduced by SEDs without strong emission features redshited in the ISOCAM band and boosting the flux at 15 m. As predicted by the starburst-dominated templates, these colors are therefore the telltale signature for the presence of PAHs in the distant Universe.
4 Conclusion
We have shown that by combining ISO and Spitzer in the photometric mode, it was possible to constrain the MIR SED of distant galaxies too faint to be subject to direct spectroscopy in the MIR. Deep images with both instruments and at similar depths (140 and 170 Jy at 15 and 24 m) do detect the same objects which illustrates the robustness of both instruments. The combination of 15 and 24 m flux densities measured with ISOCAM and MIPS was used to constrain the rest-frame 5-25 m part of the SED of a sample of 16 LIRGs with 0.1-1.2, taking advantage of the k-correction. Similar studies with larger statistics will become feasible soon by combining MIPS 24 m with IRS 16 m peak-up imaging. Even though some sources were found to be either consistent with a starburst or an AGN-dominated SED, a significant fraction of our sample shows clear evidence for the presence of the broad bump associated to the 7.7 m PAH feature in emission and for the silicate feature in absorption centered at 9.7 m. Local template SEDs fitting the correlations between MIR and FIR luminosities provide an overall good fit to the distant LIRGs supporting the possibility to use them in models fitting galaxy counts and deriving a cosmic star formation history using a “backward evolution” of the MIR luminosity function.
Acknowledgements.
We are particularly grateful to B.Brandl and H.Spoon for providing us with material used in this work. ELF thanks the MIPS project which is supported by NASA through the Jet Propulsion Laboratory, subcontract #960785. DE thanks the support from the CNES.References
- (1) Appleton, P.N., Fadda, D., Marleau, F.R., et al. 2004, ApJS, 154, 147
- (2) Brandl, B.R., Devost, D., Higdon, S.J.U., et al. 2004, ApJS, 154, 188
- (3) Cesarsky, C., Abergel, A., Agnèse, P., et al. 1996a, A&A, 315, L32
- (4) Cesarsky, D., Lequeux, J., Abergel, A., et al. 1996b, A&A, 315, L309
- (5) Chapman, S., Blain, A., Ivison, R., Smail, I. 2003, Nature, 422, 695
- (6) Charmandaris, V., Uchida, K.I., Weedman, D., et al. ApJS, 154, 142
- (7) Chary, R.R., Elbaz, D. 2001, ApJ, 556, 562
- (8) Elbaz, D., Cesarsky, C.J., Fadda, D., et al. 1999, A&A, 351, L37
- (9) Elbaz, D., Cesarsky, C.J., Chanial, P., et al. 2002, A&A, 384, 848
- (10) Fadda, D., Flores, H., Hasinger, G., et al. 2002, A&A 383, 838
- (11) Genzel, R., & Cesarsky, C. 2000, ARAA, 38, 761
- (12) Gispert, R., Lagache, G., Puget, J-L. 2000, A&A, 360, 1
- (13) Hauser, M.,& Dwek, E. 2001, ARAA, 37, 249
- (14) Houck, J., Roellig, T., van Cleve, J., et al. 2004a, ApJS 154, 18
- (15) Houck, J., Charmandaris, V., Brandl, B., et al. 2004b, ApJS 154, 211
- (16) Kessler, M., Steinz, J., Anderegg, M., et al. 1996, A&A, 315, L27
- (17) Lagache, G., Dole, H., Puget, J-L., et al. 2004, ApJS, 154, 112
- (18) Le Floc’h, E., Mirabel, I. F., Laurent, O., et al. 2001, A&A, 367, 487
- (19) Liang, Y., Hammer, F., Flores, H., et al. 2004, A&A, 423, 867
- (20) Papovich, C., Dole, H., Egami, E., et al. 2004, ApJS, 154, 70
- (21) Puget, J-L., Abergel, A., Bernard, J-P., et al. 1996, A&A, 308, L5
- (22) Rieke, G.H., et al. 2004, ApJS, 154, 25
- (23) Spoon, H., et al. 2001, A&A, 365, L353
- (24) Starck J.-L., Aussel H., Elbaz D., et al. 1999, A&AS 138, 365
- (25) Stetson, P. B. 1987, PASP, 99, 191
- (26) Thuan, T.X., Sauvage, M., Madden, S. 1999, ApJ, 516, 783
- (27) Werner, M.W., Roellig, T.L., Low, F.J., et al. 2004, ApJS, 154, 1