An HST Search for Supernovae Accompanying X-ray Flashes
Abstract
We present the results from an Hubble Space Telescope/ACS search for supernovae associated with X-ray flashes 020903, 040701, 040812 and 040916. We find strong evidence that XRF 020903 () was associated with a SN 1998bw-like supernova and confirm this using optical spectroscopy at days. We find no evidence, however, for SN 1998bw-like supernovae associated with the other three events. In the case of XRF 040701 (), we rule out even a faint supernova similar to SN 2002ap, using template light-curves for several local Type Ic supernovae. For the two cases in which the redshift is not known, XRFs 040812 and 040916, we derive robust redshift limits assuming they were accompanied by supernovae similar to SN 1998bw and compare these limits with photometric redshift constraints provided by their host galaxies. We supplement this analysis with results for three additional events (XRFs 011030, 020427 and 030723) and discuss the observed diversity of supernovae associated with X-ray flashes and gamma-ray bursts. We conclude that XRF-SNe exist, but can be significantly fainter than SN 1998bw, possibly consistent with the observed spread in local Type Ibc supernovae.
Subject headings:
gamma rays: bursts - radiation mechanisms: nonthermal - supernova: individual1. Introduction
Observational evidence for a connection between gamma-ray bursts (GRBs) and supernovae (SNe) was first established with the discovery of the highly luminous type Ic SN 1998bw in spatial and temporal coincidence with GRB 980425 (Pian et al. 2000; Galama et al. 1998a). In the seven years since this extraordinary event, several possible GRB-SN associations have been reported based on red “bumps” observed in optical afterglow light-curves (e.g. Bloom et al. 1999). Moreover, in two cases (GRBs 030329 and 031203) there is unambiguous spectroscopic evidence of high velocity SN features (Hjorth et al. 2003; Stanek et al. 2003; Matheson et al. 2003; Malesani et al. 2004). These observations provide conclusive evidence that at least some gamma-ray bursts are produced in the explosions of massive stars.
In recent years, a new class of high energy transients has been identified, characterized by an emission spectrum peaking in the X-ray band, an order of magnitude softer than the peak energies observed for GRBs (Heise et al. 2001). These so-called X-ray flashes (XRFs) are thought to be related to GRBs since the two classes share several observational properties, including prompt emission profiles (Sakamoto et al. 2004, and references therein), broadband afterglows (Butler et al. 2004; Soderberg et al. 2004; Fynbo et al. 2004) and star-forming host galaxies at cosmological distances (Bloom et al. 2003; Levan et al. 2002, 2004).
Several hypotheses on the physical connection between XRFs and GRBs have been proposed. One popular model posits that XRFs are simply GRBs viewed away from the jet collimation axis (Yamazaki, Ioka & Nakamura 2003; Zhang, Woosley & Heger 2004; Granot, Ramirez-Ruiz & Perna 2005). In this scenario, the observed prompt emission is dominated by the mildly relativistic material in the “wings” of the jet, rather than the highly relativistic () ejecta beamed away from the line-of-sight. Another popular model suggests that XRFs are produced in a “dirty fireball”, where the ejecta carry a more substantial baryonic load (and hence less relativistic material) than typical GRBs (Zhang, Woosley & Heger 2004). In both scenarios XRFs are expected to be associated with SNe, whose properties and detectability should not be affected by the viewing angle or baryonic load.
The discovery of a SN in association with an XRF would therefore conclusively associate XRFs with the death of massive stars and hence GRBs. Motivated thus, we undertook a systematic search for SNe associated with XRFs using the Hubble Space Telescope (HST). As part of our XRF-SN analysis, we synthesized supernova light-curves at various redshifts utilizing as templates the well-sampled optical light-curves of several local SNe (§2). Comparison of the synthesized SNe with our HST observations enabled us to study the diversity of XRF associated SNe. Details on the individual HST targets and observations follow in §3. By including results from other XRF-SN searches, we compile an extended sample of seven events (XRFs 011030, 020427, 020903, 030723, 040701, 040812 and 040916), and present a global summary of XRF-SN detection limits in §4. A discussion on the observed spread in the peak optical luminosities of GRB- and XRF-associated SNe follows as §5.
2. Supernova Light-Curve Synthesis
In modeling the XRF-associated SNe, we adopted optical data for the local SNe 1994I, 1998bw and 2002ap as templates. These three SNe were selected based on their well-sampled optical light-curves which represent an overall spread in the observed properties of Type Ibc supernovae. To produce synthesized light-curves for each of these template SNe, we compiled optical observations from the literature and smoothed the extinction-corrected (foreground plus host galaxy) light-curves. We then redshifted the light-curves by interpolating over the photometric spectrum and stretching the arrival time of the photons by a factor of . Since observed spectra of local ( Mpc) Type Ibc SNe show a steep drop-off in flux blue-ward of Å due to heavy line-blanketing and since good-quality UV data are currently not available below Å we do not attempt to extrapolate the rest-frame spectra blue-ward of the rest-frame -band observations. This limits the synthesized light-curves to and for the observed - and -bands, respectively. Below we discuss the compiled optical datasets for each of the template SNe.
2.1. SN 1998bw
The well-sampled light-curves for SN 1998bw were taken from Galama et al. (1998a) and McKenzie & Schaefer (1999) and corrected for Galactic extinction (; Schlegel, Finkbeiner & Davis 1998). We assume negligible host galaxy extinction, consistent with the spectroscopic analysis Patat et al. (2001). The broadband optical dataset spans a timescale from to 417 days. Here, the explosion time is set by the Beppo-SAX detection of GRB 980425 on 1998 April 25.91 UT (Pian et al. 2000). In calculating optical luminosities for SN 1998bw, we assume a distance, Mpc (, , ), based on the observed redshift to the host galaxy, ESO 184-G82 (Galama et al. 1998b).
2.2. SN 1994I
Richmond et al. (1996) provide a large compilation of multi-color light-curves for SN 1994I. We adopt a large host galaxy extinction of and negligible Galactic extinction as derived through the spectroscopic analysis (Richmond et al. 1996). Using an explosion date of 1994 March 30 UT from radio light-curve modeling (Stockdale et al. 2005), the data span from to 130 days, while the -band data extend only as far as days. In an effort to extend the -band light-curve, we scale the late-time linear decay of the -band light-curve to match the last epoch of -band observations and assume the color is constant thereafter. We note that this scaling introduces a source of uncertainty in our late-time [] high synthesized light-curves of SN 1994I. In calculating optical luminosities, we adopt a distance of Mpc for host galaxy, M51, as given by Richmond et al. (1996).
2.3. SN 2002ap
light-curves were taken from Foley et al. (2003) and scaled to an explosion date of 2002 January 28.9 UT (Mazzali et al. 2002). We adopt the spectroscopic derived total extinction (foreground plus host galaxy) of (Foley et al. 2003). Data span to 317.3 days after the explosion in filters while the -band data extend only to days. In a manner similar to that for SN 1994I, we extend the -band light-curve by scaling the late-time -band data and note that this introduces uncertainty in the synthesized light-curves at high. We assume the distance to the host galaxy, M74, is Mpc (Sharina, Karachentsev & Tikhonov 1996; Sohn & Davidge 1996).
We emphasize the striking differences between the three SN light-curves when the extinction-corrected rest-frame -band light-curves are compared. With regard to the luminosity at peak time, SN 1998bw is a factor of more luminous than SN 1994I and times more luminous than SN 2002ap. Moreover, the time of -band peak vary by a factor of two: while SN 1998bw peaks at days, SN 1994I and SN 2002ap both peak at just days. Such early peak times present a challenge for GRB-SN searches, since the optical afterglow typically dominates on these timescales.
3. Hubble Space Telescope XRF-SN Search
Since the activation of our Cycle-13 HST program to study the supernovae associated with X-ray flashes and gamma-ray bursts (GO-10135; PI: Kulkarni), three XRFs have been discovered and localized by their afterglow emission: XRFs 040701, 040812 and 040916. In an effort to study the SNe possibly associated with these XRFs, we observed each of these objects with HST at late-time, when an associated supernova is most likely to dominate the optical emission. To supplement our sample of XRF observations, we investigated archival HST images of XRF 020903 (GO-9405; PI: Fruchter). We describe our data analysis techniques below.
Using the Wide-Field Camera (WFC) of the Advanced Camera for Surveys (ACS) on-board HST, we imaged the fields of XRFs 040701, 040812 and 040916. For each target we undertook observations at two epochs, and days, in order to search for optical emission associated with an underlying supernova. Each epoch consisted of two orbits during which we imaged the field in two filters, F625W and F775W, corresponding to SDSS - and - bands, respectively.
We retrieved archival images of XRF 020903 from the HST archive111http://archive.stsci.edu/hst/search.php. Similar to the other bursts in our sample, the XRF 020903 data were obtained with HST/ACS using WFC. We analyze the images from two epochs at and days to search for the signature of an associated supernova. These data were taken in the broad -band filter, F606W.
The HST data were processed using the multidrizzle routine within the stsdas package of IRAF (Fruchter & Hook 2002). Images were drizzled using pixfrac=0.8 and pixscale=1.0 resulting in a final pixel scale of 0.05 arcsec/pixel. Drizzled images were then registered to the first epoch using the xregister package within IRAF.
To search for source variability, we used the ISIS subtraction routine by Alard (2000) which accounts for temporal variations in the stellar PSF. Residual images (Epoch 1 Epoch 2) were examined for positive sources positionally coincident with the afterglow error circle. To test our efficiency at recovering transient sources, false stars with a range of magnitudes were inserted into the first epoch images using IRAF task mkobject. An examination of the false stellar residuals provided an estimate of the magnitude limit () to which we could reliably recover transients.
Photometry was performed on the residual sources within a 0.5 arcsec aperture. We converted the photometric measurements to infinite aperture and calculated the corresponding AB magnitudes within the native HST filters using the aperture corrections and zero-points provided by Sirianni et al. (2005). For comparison with ground-based data, we also converted the photometric measurements to Johnson - and -band (Vega) magnitudes using the transformation coefficients derived by Sirianni et al. (2005) and assuming a flat source spectrum.
In the following sections we summarize the afterglow properties for each of the targets and the photometry derived from our HST SN search. A log of the HST observations for the four XRFs follows in Table 1.
3.1. XRF 020903
3.1.1 Prompt Emission and Afterglow Properties
XRF 020903 was detected by the Wide-Field X-ray Monitor (WXM) on-board the High Energy Transient Explorer (HETE-2) satellite on 2002 September 3.421 UT. With a spectral energy distribution peaking below 5 keV, XRF 020903 is the softest burst detected during the lifetime of the instrument (Sakamoto et al. 2004). Despite the large arcmin localization region, an optical afterglow was discovered (Soderberg et al. 2004) at , (J2000). At days, the afterglow had mag and continued to fade as until days when the decay flattened to a plateau. Optical spectroscopy showed the transient source to be associated with a galaxy complex at (Soderberg et al. 2002).
3.1.2 HST Observations
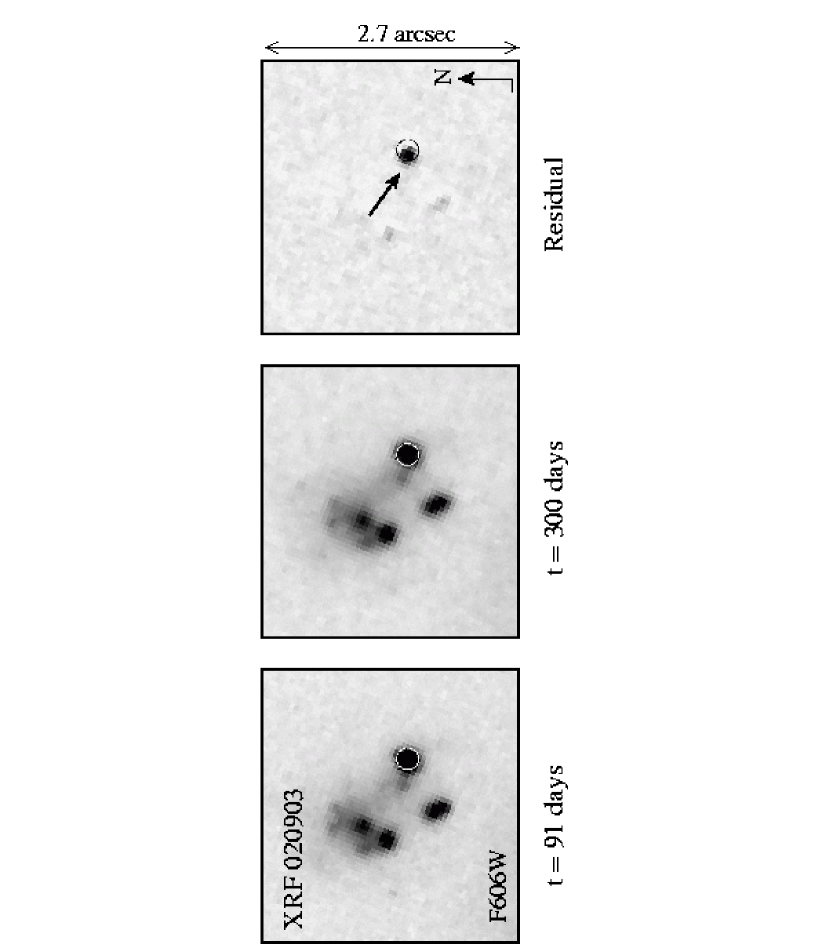
XRF 020903 was observed using HST/ACS on 2002 December 3.79 and 2003 June 30.65 UT, corresponding to and 300 days after the burst. Imaging was carried out in the broad F606W filter for total exposure times of 1840 sec (Epoch 1) and 1920 sec (Epoch 2). Relative astrometry was performed using an early-time ( day) image from the Palomar 200-inch telescope (Soderberg et al. 2004). Using 42 unsaturated, unconfused stars in common between the two images, we registered the HST data with a systematic uncertainty of 0.12 arcsec ().
The HST images reveal that the afterglow localization circle coincides with the southwest knot of the host galaxy complex (Figure 1). Through image subtraction, we find a positive residual coincident with the optical afterglow position at , (J2000). Photometry of the residual source gives F606W mag ( mag). Correcting for Galactic extinction (; Schlegel, Finkbeiner & Davis 1998), the true magnitude of the source is mag. To estimate our photometric uncertainty, we placed random apertures near other galaxy residuals and calculated the standard deviation of the resulting values.
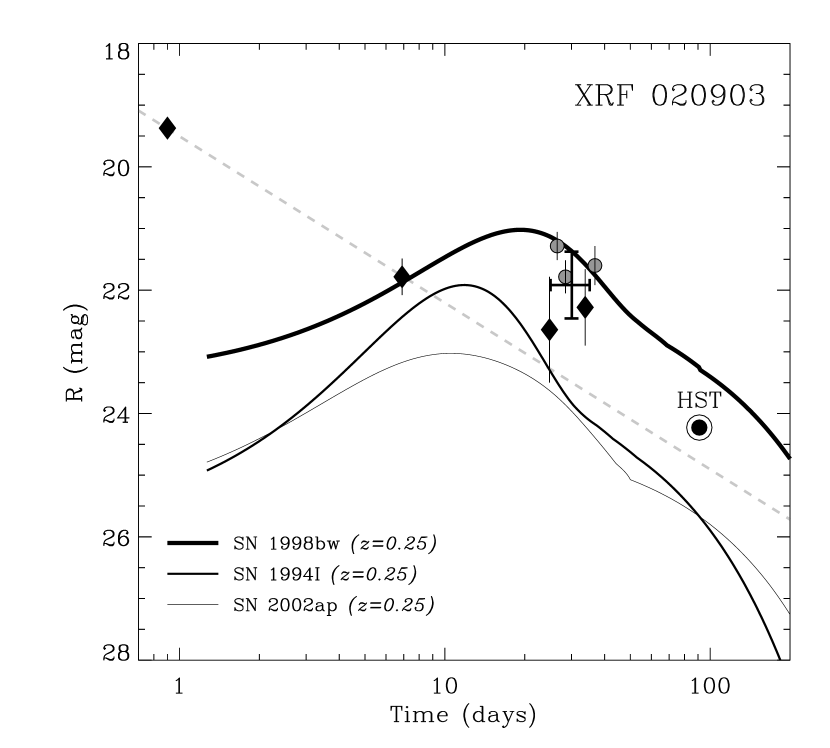
Figure 2 shows the extinction-corrected HST photometry along with ground-based -band data for the optical afterglow associated with XRF 020903. Ground-based data have been compiled from the GCNs (Covino et al. 2002; Gorosabel et al. 2002) as well as from Table 1 of Soderberg et al. (2004). We have numerically subtracted the host galaxy contribution from the ground-based data, assuming an extinction-corrected host galaxy brightness of mag based on late-time observations (Gorosabel et al. 2002; Levan et al. 2002). From the compiled -band afterglow light-curve, it is evident that the temporal decay flattens significantly around days and subsequently steepens toward the HST measurement at days. This flattening (or plateau phase) occurs on the same timescale that a SN 1998bw-like supernova at would reach maximum light (see also Bersier et al. 2004).
3.1.3 Associated Supernova
Over-plotted in Figure 2 are the synthesized light-curves of SNe 1998bw, 1994I and 2002ap at a redshift of . It is clear that an associated SN 1998bw-like supernova would be magnitude brighter than the HST observation at days, while SN 1994I and SN 2002ap-like light-curves are each fainter by 1.4 magnitudes. By taking the weighted average of the ground-based data between days, we predict that the supernova was magnitudes fainter than SN 1998bw at maximum light. We note that this uncertainty is dominated by “aperture effects” (see Price et al. 2003) which cause variable contribution from the host galaxy complex in different epochs.
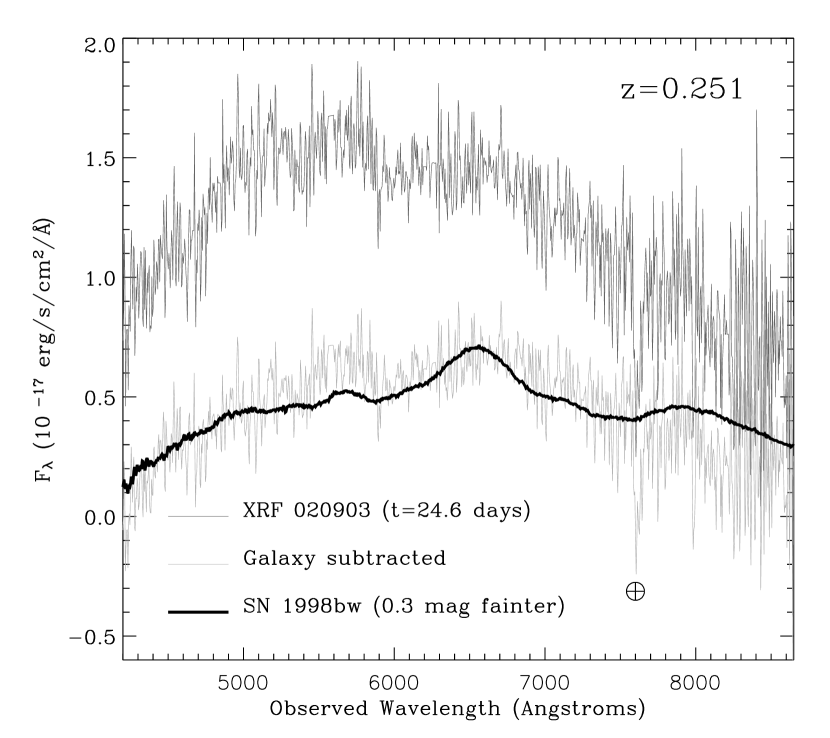
We obtained optical spectroscopy of the transient source using the Magellan 6.5-meter telescope equipped with the Low Dispersion Survey Spectrograph (LDSS2) on 2002 September 28.06 UT ( days), during the observed plateau phase. The data were reduced and calibrated using standard techniques. The spectrum is characterized by a faint continuum dominated by narrow, bright emission lines typical of star-forming galaxies (Figure 3; Soderberg et al. 2002; Chornock & Filippenko 2002).
To search for high velocity SN features within the observed spectrum, we utilized the supernova classification techniques of Howell et al. (2005), designed for identification of SNe in the presence of host galaxy contamination. Host galaxy light must be subtracted from the observed spectrum to reveal the SN flux. We fit a range of starburst host galaxy templates from Kinney et al. (1993), consistent with the continuum shape and narrow lines in the observed spectrum. After sigma-clipping the narrow emission lines and subtracting the best-fit galaxy template (model SB1), the residual spectrum shows broad features resembling those of SN 1998bw near maximum light. Figure 3 presents a comparison of our galaxy subtracted spectrum with SN 1998bw at days (rest-frame; Patat et al. 2001), redshifted to and dimmed by magnitudes. The resemblance is striking.
Taken together, the spectroscopic and photometric data strongly suggest that XRF 020903 was associated with a supernova that is magnitudes fainter than SN 1998bw at maximum light. Moreover, the SN light-curve fades faster than SN 1998bw, falling mag below the synthesized SN 1998bw light-curve at late-time. A dimmer, faster fading supernova was also interpreted for SN 2003dh/GRB 030329 (Lipkin et al. 2004; Deng et al. 2005; c.f. Matheson et al. 2003) and is consistent with the luminosity-stretch relation for GRB-SNe (Bloom et al. 2002; Stanek et al. 2005).
3.2. XRF 040701
3.2.1 Prompt Emission and Afterglow Properties
XRF 040701 was localized on 2004 July 1.542 UT by the HETE-2 WXM to an 8 arcmin radius error circle centered at , (J2000; Barraud et al. 2004).
We observed the error circle with the Chandra X-ray Observatory (CXO) using the AXAF CCD Imaging Spectrometer (ACIS) for 22.3 ksec beginning at 2004 July 9.32 UT ( days) and 20.4 ksec on 2004 July 18.05 ( days). Comparison of the two epochs revealed the most variable source to be at position , (J2000), with an uncertainty of arcsec in each coordinate (; Fox 2004) which we interpret as the X-ray afterglow. Assuming Galactic absorption, the X-ray flux of the source was and ( keV), in the first and second epochs, respectively. This implies a temporal decay, with , between the two observations, comparable to the typical observed values of GRB X-ray afterglows, (Berger, Kulkarni & Frail 2003, and references therein).
Inspection of Digital Sky Survey (DSS) images revealed that the X-ray afterglow is associated with a resolved galaxy complex whose redshift we determined to be (Kelson et al. 2004). At this relatively low redshift, the X-ray afterglow is sensitive to absorption within the host galaxy. We fit an absorbed power-law model to the afterglow spectrum where the column density, , was a combination of foreground and host galaxy extinction. We find that the column density within the host galaxy must be (90 confidence) in order to reproduce the observed low energy ( keV) X-ray photons. Utilizing the to conversion of Predehl & Schmitt (1995), this limit corresponds to a rest-frame host galaxy extinction of mag.
Despite deep searches, no optical afterglow candidate was discovered through ground-based monitoring of the Chandra error circle (de Ugarte Postigo et al. 2004; Berger et al. 2004; Pian et al. 2004). This non-detection could be the result of the large host-galaxy extinction, consistent with the observed X-ray afterglow absorption.
3.2.2 HST observations
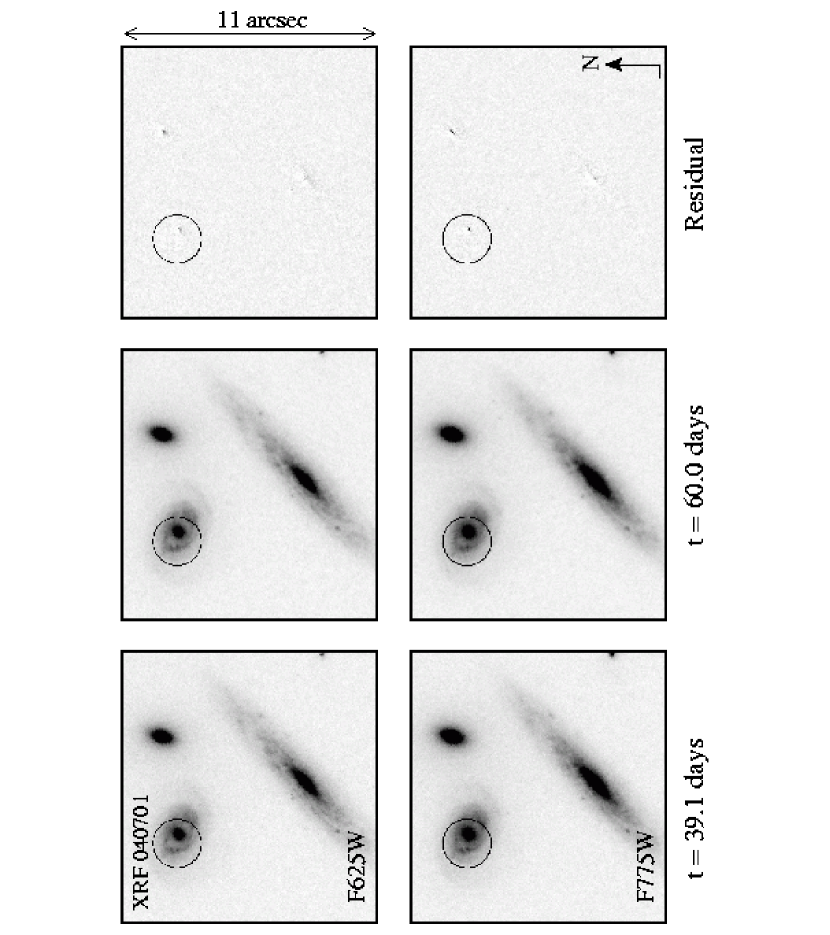
HST/ACS imaging was carried out on 2004 August 9.66 and 30.52 UT ( and 60.0 days after the burst). Each epoch had a total exposure time of 1840 and 1920 sec in the F625W and F775W filters, respectively. We astrometrically tied the HST and Chandra images by first registering the X-ray source list to our -band images from the Las Campanas Observatory (LCO) 40-inch telescope (Berger et al. 2004) using three sources in common. We then tied the LCO images to those from HST resulting in a final positional uncertainty of 1.06 arcsec ().
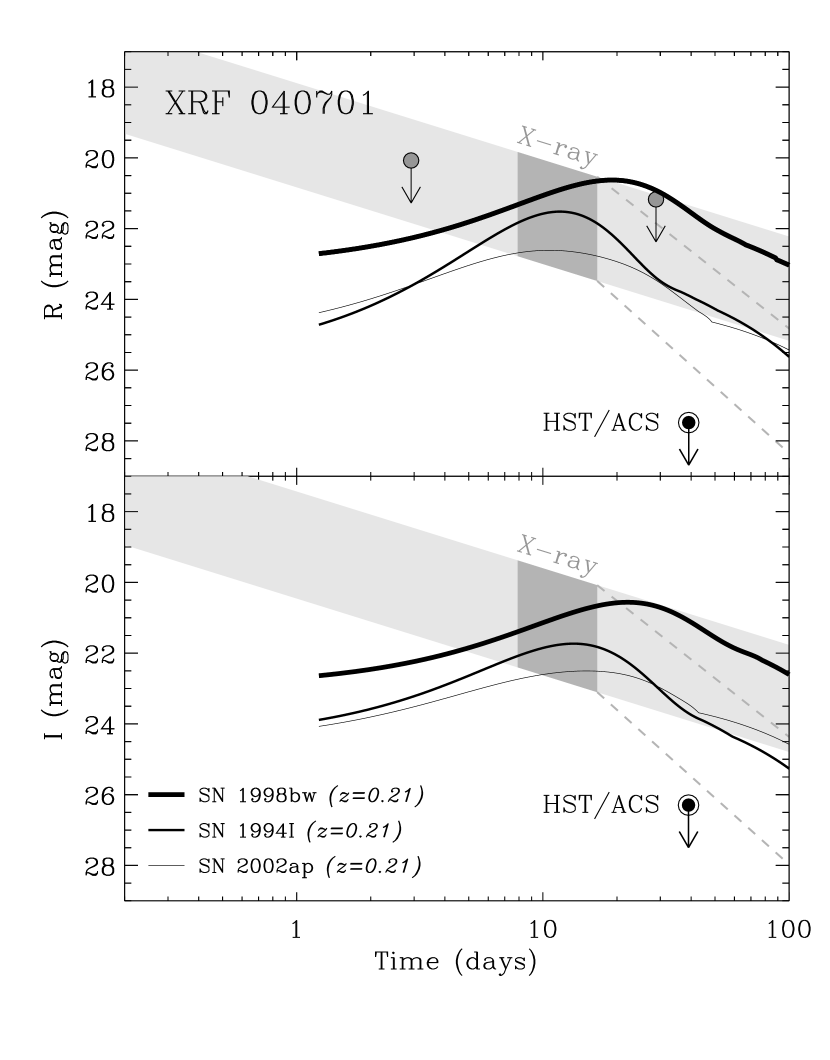
Our HST observations reveal that the afterglow error circle coincides with the northeast galaxy of the host complex. Inspection of the images reveals that there are no transient sources within this localization region. Figure 4 shows the images from both epochs in addition to the residual images produced from the subtraction routine. We found that the false stellar residuals recovered at our detection threshold correspond to limits of F625W and F775W mag ( and mag). Correcting for Galactic extinction (; Schlegel, Finkbeiner & Davis 1998), the actual limits are and mag. We note that the slightly elevated flux of the bipolar galaxy residual are consistent with these limits.
Figure 5 shows the HST limits along with early-time data compiled from the GCNs (de Ugarte Postigo et al. 2004; Pian et al. 2004), corrected for Galactic extinction. To estimate the flux of the optical afterglow, we extrapolated the observed Chandra data to the - and -bands. Following Sari, Piran & Narayan (1998) for the case of a constant denisty medium, the observed X-ray afterglow decay () implies that the electron energy index () is in the case where the synchrotron cooling frequency, , is above the X-ray band, and , if it is below. We therefore extrapolate the observed X-ray flux by adopting a spectral index () with in the case of and for . These two scenarios bracket the whole range of optical flux values implied by the possible location of the at the time of the CXO observations.
By extrapolating the predicted optical decay to the first HST epoch, we conclude that the afterglow should have been magnitudes brighter than our HST detection limit. Even in the most extreme scenario, a jet break occurred coincident with the second Chandra epoch, forcing the temporal decay to steepen to (Sari, Piran & Halpern 1999). Still, the afterglow would have been magnitudes brighter than the HST limit. Under the assumption that the observed X-ray flux was dominated by synchrotron emission, these limits imply that there is significant extinction from the host galaxy. However, in a scenario where the X-ray emission is dominated by other processes (e.g. inverse Compton), this extrapolation over-predicts the brightness of the optical afterglow, thereby reducing the implied host galaxy extinction.
3.2.3 Supernova Limits
Over-plotted in Figure 5 are synthesized light-curves for SNe 1998bw, 1994I and 2002ap at . From the figure, it is clear that a SN 1998bw-like supernova would have been magnitudes brighter than our HST limits. A faint supernova similar to SN 2002ap would still be magnitudes above our detection threshold. Our constraints on the column density imply that host galaxy extinction cannot account for this difference; even in an extreme scenario, given by mag, our limits are still magnitudes fainter than SN 1998bw. We conclude that an XRF 040701-associated supernova must be mag fainter than SN 1998bw, making it significantly fainter than all GRB-SNe known to date.
3.3. XRF 040812
3.3.1 Prompt Emission and Afterglow Properties
XRF 040812 was discovered on 2004 August 12.251 UT by the Imager on Board the Integral Satellite (IBIS). Preliminary analysis indicated a spectrum that was X-ray rich. The event was localized to a 2-arcmin radius circle centered at , (J2000; Gotz et al. 2004).
Patel et al. (2004a) observed the field of XRF 040812 with Chandra/ACIS beginning on 2004 August 17.30 UT ( days) and on 2004 August 22.41 UT ( days) for 10 ksec each. Comparison of the two epochs revealed a variable source at position , (J2000) which faded as between the observations (Patel et al. 2004b). The unabsorbed flux in the first and second epochs was and (0.5–10 keV), respectively (Campana & Moretti 2004a, b).
Due to high Galactic extinction in the direction of the burst ( mag; Schlegel, Finkbeiner & Davis 1998) and the presence of an extremely bright star arcsec from the CXO position, optical/IR campaigns could neither observe the optical afterglow nor obtain spectroscopy of the host galaxy (Berger 2004; Berger et al. 2004a; Cobb & Bailyn 2004; D’Avanzo et al. 2004). As a result, a spectroscopic redshift is not available for XRF 040812.
3.3.2 HST Observations
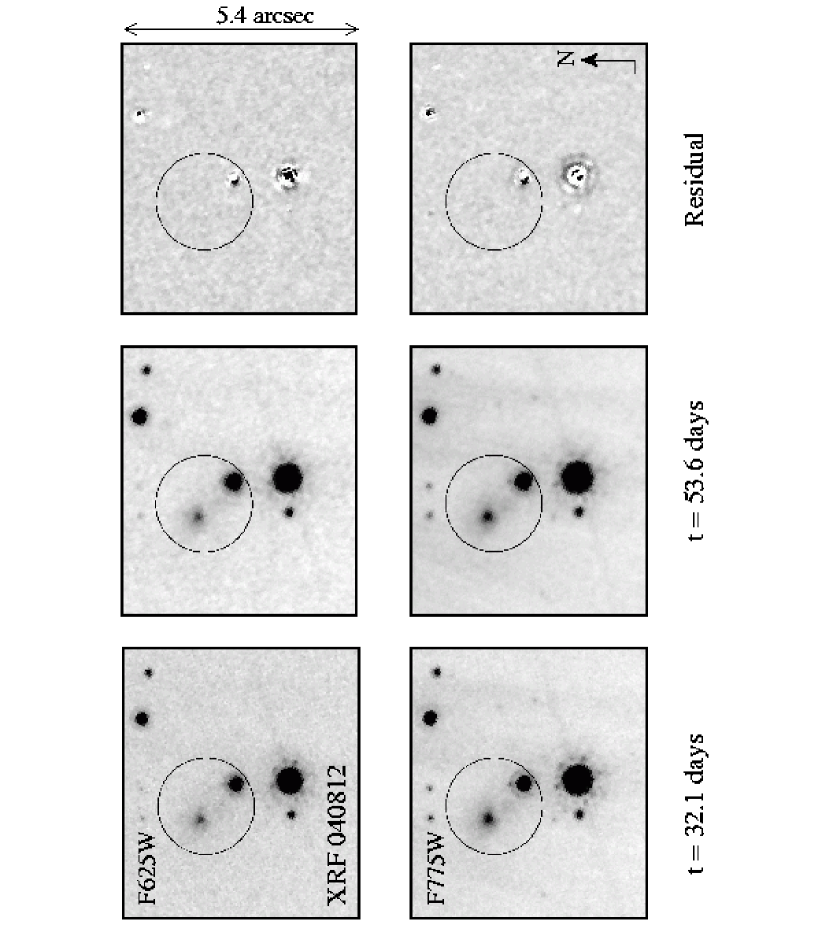
HST/ACS imaging for XRF 040812 was carried out on 2004 September 13.4 and October 4.8 UT ( and 53.6 days after the burst). Each epoch had a total exposure time of 2000 and 2120 sec in the F625W and F775W filters, respectively. Observations were taken with orientation angles chosen to minimize contamination from diffraction spikes and saturated columns resulting from the bright foreground star. Using the Chandra source list provided by Patel et al. (2004a), we identified five unconfused, unsaturated sources in common between the Chandra observations and our -band Las Campanas Observatory (LCO) 40-inch observations (Berger et al. 2004a) and used these to tie the X-ray afterglow position to ground-based images. The LCO and HST images were then registered, resulting in a final positional uncertainty of arcsec ().
Through examination of the HST images, we find an extended source arcsec () from the nominal CXO position and interpret it as the host galaxy of XRF 040812. We find the galaxy to be relatively bright, F625W mag, corresponding to mag after correcting for the large foreground extinction. Comparison with the set of GRB host galaxy magnitudes compiled by Berger et al. (2005a) suggests that XRF 040812 is at a relatively low redshift, . At this redshift, the host galaxy extinction is constrained to be , (90% confidence) based on our independent analysis of the lowest energy X-ray afterglow emission.
Image subtraction reveals no transient sources that could be attributed to an optical afterglow or associated supernova within the CXO localization circle (Figure 6). We find detection limits on the residual image of F625W and F775W mag ( and mag). Due to the large Galactic extinction, however, the true limits are significantly shallower, and mag.
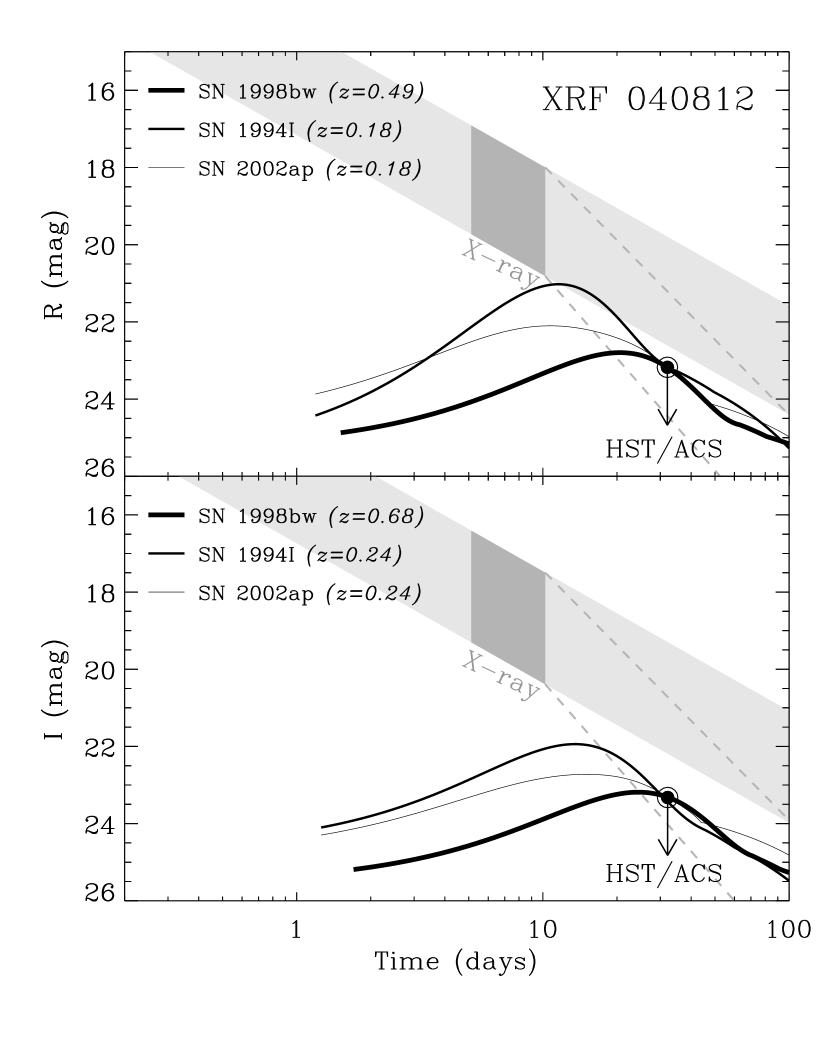
Figure 7 displays the Galactic extinction-corrected HST limits along with the predicted optical afterglow extrapolated from the X-ray flux in a manner similar to that for XRF 040701 (§3.2.2). Given the observed X-ray decay, we extrapolate with for and for . As evident from the figure, the HST -band limit is 1.9 magnitudes fainter than the predicted optical afterglow, assuming the flux continued evolving as to the HST epoch. If, instead, a jet break occurred at the second Chandra epoch, the predicted optical afterglow could be consistent with the HST non-detection.
3.3.3 Supernova Limits
Since the redshift of XRF 040812 is not known, we over-plot synthesized light-curves for SNe 1998bw, 1994I and 2002ap at the appropriate redshift such that the SN curves match the residual image HST detection limit. Supernovae placed above these redshift limits would not be detected. Due to the heavy foreground extinction toward XRF 040812, the -band limits provide deeper constraints on an associated supernova. As shown in Figure 7, a SN 1998bw-like supernova is ruled out for while SN 1994I- and SN 2002ap-like SNe are ruled out for and , respectively. To be consistent with the estimated low- inferred from the host galaxy brightness, an associated SN must be significantly fainter than SN 1998bw or suppressed due to host galaxy extinction.
3.4. XRF 040916
3.4.1 Prompt Emission and Afterglow Properties
On 2004 September 16.002 UT the HETE-2 satellite discovered XRF 040916. Preliminary spectral analysis revealed a dearth of photons at keV suggestive that the event was an X-ray flash (Yamazaki et al. 2004a). The initial localization error region was 18 arcmin in radius centered at , (J2000). A refined error box with half the original size (545 square arcmin) was released later (Yamazaki et al. 2004b). Using SuprimeCam mounted on the Suburu 8.2m telescope, Kosugi et al. (2004) discovered a faint optical afterglow at , (J2000) with a magnitude of at days . The afterglow subsequently decayed as . In comparison to GRB optical afterglows compiled by Fox et al. (2003) and Berger et al. (2005b), XRF 040916 is the faintest optical afterglow ever detected on this timescale. We note that no spectroscopic redshift has been reported for this event.
3.4.2 HST Observations
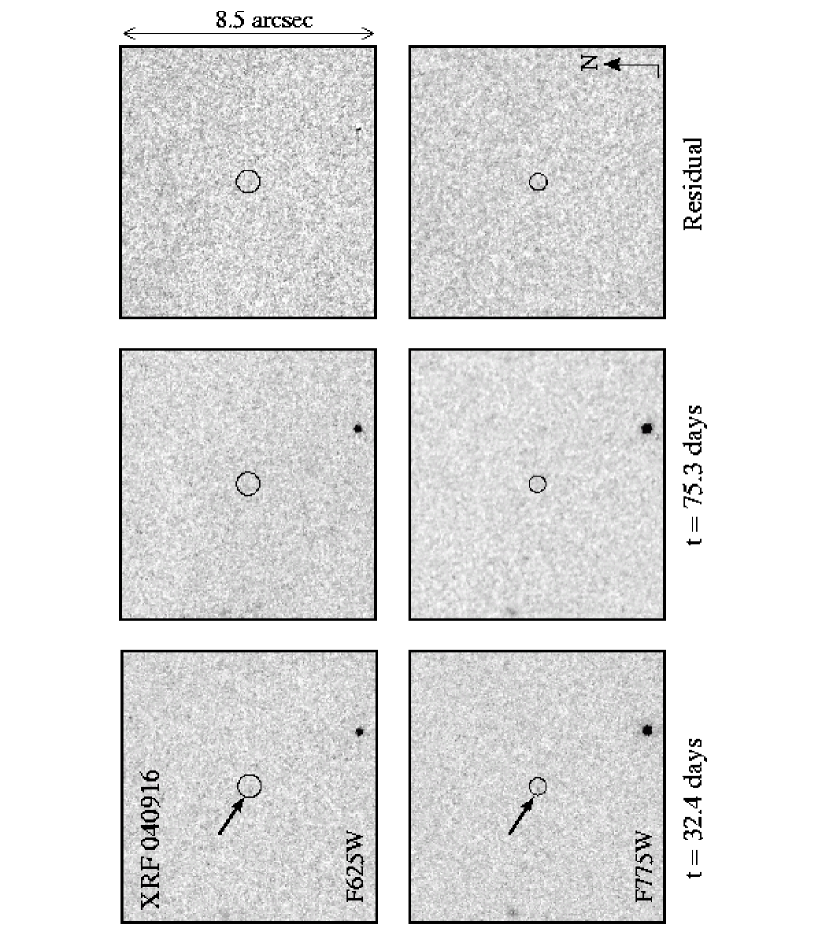
XRF 040916 was imaged with HST/ACS on 2004 October 18.38 and November 30.30 UT ( and 75.3 days after the burst) for a total exposure time of 1930 (2058) sec in Epoch 1 and 1928 (2056) sec in Epoch 2 in the F625W (F775W) filter. For astrometry, we used early-time ( day) - and -band data from the Palomar Robotic 60-inch telescope (P60; Cenko et al., in prep) in which the optical afterglow is clearly detected. Twelve stars in common between the Palomar and HST images provided an astrometric uncertainty of arcsec ().
Within the afterglow position error circle, we find a faint source near the detection limit of our first epoch F625W and F775W images at , (J2000). Figure 8 shows the source is too faint to be recovered in the residual images, implying it is just below our 3 detection threshold of F625 mag and F775W mag ( and mag). Correcting for Galactic extinction (; Schlegel, Finkbeiner & Davis 1998), the true limits are and mag.
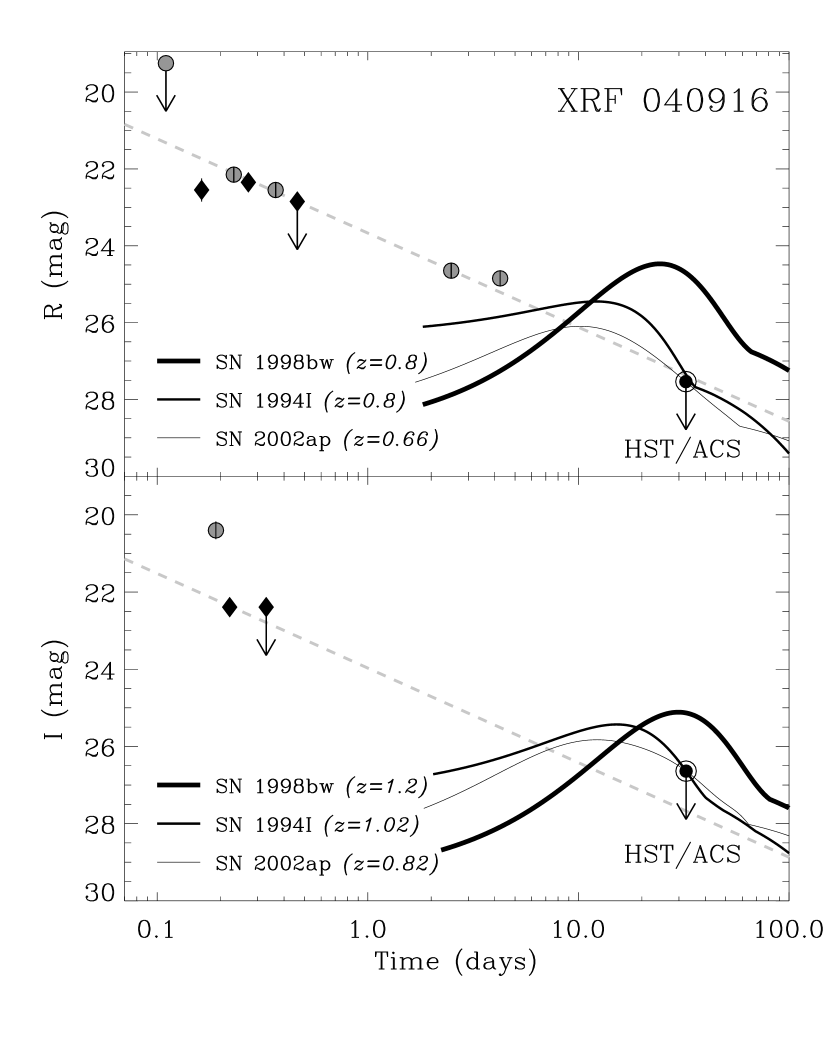
In Figure 9 we show the HST limits along with early-time data from P60 and from the GCNs (Kosugi et al. 2004; Klotz et al. 2004; Henden 2004), all corrected for Galactic extinction. The early data are well fit with a decay. We note that the early detection by Henden (2004) is inconsistent with our -band data. The HST limits are consistent with the extrapolated optical afterglow, assuming the flux decayed without steepening until the epoch of HST observations.
3.4.3 Supernova Limits
Since the redshift of XRF 040916 is not known, we over-plot synthesized light-curves for SNe 1994I and 2002ap each at the appropriate redshift such that the SN curves match the residual image HST detection limit. Supernovae with light-curves similar to SNe 1994I and 2002ap would not be detected above and , respectively. Synthesized light-curves for SN 1998bw at and represent the limits to which we can confidently extrapolate the rest-frame SN spectrum. These light-curves are and magnitudes brighter than the observed HST limits in the - and - bands, and therefore suggest that either XRF 040916 is at higher redshift (e.g. ) or it is associated with a lower luminosity SN.
We note that XRF 040916 is the only event within our HST survey for which we do not detect the host galaxy. Given our HST detection limit and the small foreground extinction, this implies the host galaxy is fainter than mag. We compare this limit with faint GRB host galaxies; all of the GRB hosts with mag are at redshift (Berger et al. 2005a). Assuming the GRB host galaxy luminosity function also applies to XRFs, this implies that XRF 040916 is at a similarly high redshift, far beyond the redshift limit out to which we can detect an associated SN.
4. A Summary of XRF-SN Searches
We now present a global summary of all SN searches in XRFs to date, including HST campaigns for XRFs 011030, 020427, 020903, 040701, 040812, 040916 and a deep ground-based effort for XRF 030723. In compiling these results, we also discuss the available constraints on host galaxy extinction, which could suppress any emission from an associated SN.
The only XRF for which we find evidence suggestive of an accompanying supernova is XRF 020903 (). Based on the observed flattening of the optical light-curves at days, and the identification of broad features in the optical spectrum, we propose that XRF 020903 was associated with a supernova up to magnitude fainter than SN 1998bw at maximum light.
In the case of XRF 040701, our foreground extinction-corrected HST detection limit is mag fainter than SN 1998bw at this redshift. Our analysis of the X-ray afterglow spectra reveals that the rest-frame host galaxy extinction is constrained to , implying a conservative upper limit on the brightness of the associated SN to be mag fainter than SN 1998bw and fainter than all of the GRB-SN studied to date. Taken together, XRFs 020903 and 040701 (the only two XRFs with redshifts in our sample) imply that at least some of the XRF-associated SNe are considerably fainter than SN 1998bw.
Due to the heavy foreground extinction toward XRF 040812, our ability to detect a SN 1998bw-like event would only be possible for . In this case, analysis of the X-ray afterglow does not provide a strong constraint on the host galaxy extinction, since the lowest energy photons are absorbed by the Galaxy. Our limits are more constraining for the case of XRF 040916, where we would be sensitive to a SN 1998bw-like supernova beyond . The lack of a SN detection, however, is consistent with a high redshift as possibly suggested by the faintness of the host galaxy and optical afterglow.
Deeper constraints have previously been reported based on HST/STIS data for two additional XRFs without known redshifts, XRFs 011030 and 020427 (Levan et al. 2004). Thanks to the broad throughput of the STIS Clear filter, the sensitivity extends red-ward of -band, thereby enabling SN detection to before UV blanketing suppresses the observed emission. Levan et al. (2004) showed that a SN 1998bw-like supernova would be detectable to for both XRFs 011030 and 020427. Using the X-ray afterglow data for these two bursts, Levan et al. (2004) estimated their host galaxy extinction to be and , respectively, assuming a moderate redshift of . At lower redshift, the host galaxy extinction required to suppress a SN 1998bw-like supernova is inconsistent with the X-ray limits, suggesting that these two bursts are either located at higher redshift or associated with low luminosity SNe. We note that a firm redshift limit of has been reported for XRF 020427 based on the lack of Ly absorption down to 3800 Å within the optical spectrum (van Dokkum & Bloom 2003).
While there were no HST observations taken for XRF 030723, we utilize the deep ground-based afterglow observations reported by Fynbo et al. (2004) to constrain the emission from an underlying supernova. Despite claims that the optical rebrightening at days is due to an associated supernova (Tominaga et al. 2004; Fynbo et al. 2004), we conclude that the observed optical/NIR variability is dominated by afterglow emission since neither the color nor the optical to X-ray spectral index vary on this timescale (Fox et al., in prep.; Butler et al. 2004). We therefore adopt the -band afterglow light-curve as an effective upper limit on the flux of an accompanying SN. We derive the most robust constraint from an observation at days with . This limit is sufficiently deep to rule out a SN 1998bw-like supernova at . We note that while the redshift of XRF 030723 is not known, the lack of Ly absorption in optical spectra limits the redshift to (Fynbo et al. 2004).
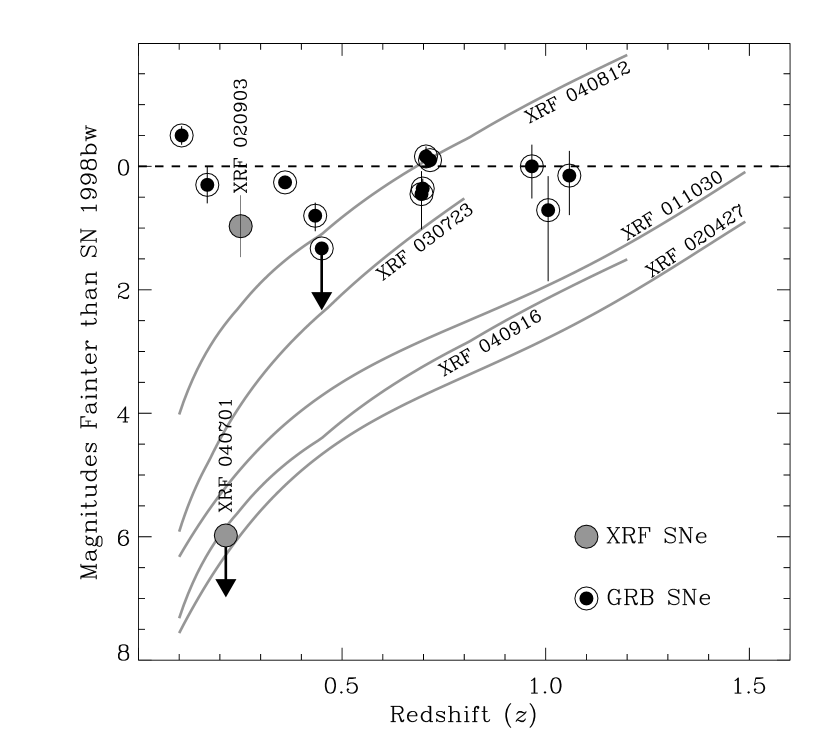
We summarize the limits on XRF-associated supernovae for these seven XRFs in Figure 10. Also shown are the peak SN magnitudes (relative to SN 1998bw) for limits (GRB 010921, Price et al. 2003) and secure detections of GRB-associated supernovae compiled from the literature (GRBs 970228, 980703, 990712, 991208, 000911, 011121, 020405, 021211 Zeh, Klose & Hartmann 2004; GRB 030329, Lipkin et al. 2004; Deng et al. 2005; GRB 031203, Malesani et al. 2004; GRB 041006, Stanek et al. 2005). This figure highlights the spread of luminosities implied for the supernovae associated with high energy cosmic explosions. The GRB-SNe clearly show a spread in their peak brightness. Based on XRFs 020903 and 040701, XRF-SNe appear to show a similar spread. Assuming a modest redshift of for the other five XRF-SNe implies an even larger spread and might suggest than XRFs are associated with systematically fainter SNe.
5. Discussion
We presented results from our HST/ACS search for the supernovae associated with the XRFs 020903, 040701, 040812, 040916 and extended this sample by including published results for SN searches in XRFs 011030, 020427 and 030723. We find strong evidence (photometric and spectroscopic) for a SN 1998bw-like supernova (dimmed by mag) in association with XRF 020903 (). This finding conclusively associates XRFs with the death of massive stars for the first time. In the case of XRF 040701 (), our HST limit is magnitudes fainter than SN 1998bw which cannot be accounted for by host galaxy extinction. Based on these two events (XRFs 020903 and 040701), we conclude that at least some XRF-associated SNe exist but can be significantly fainter than SN 1998bw.
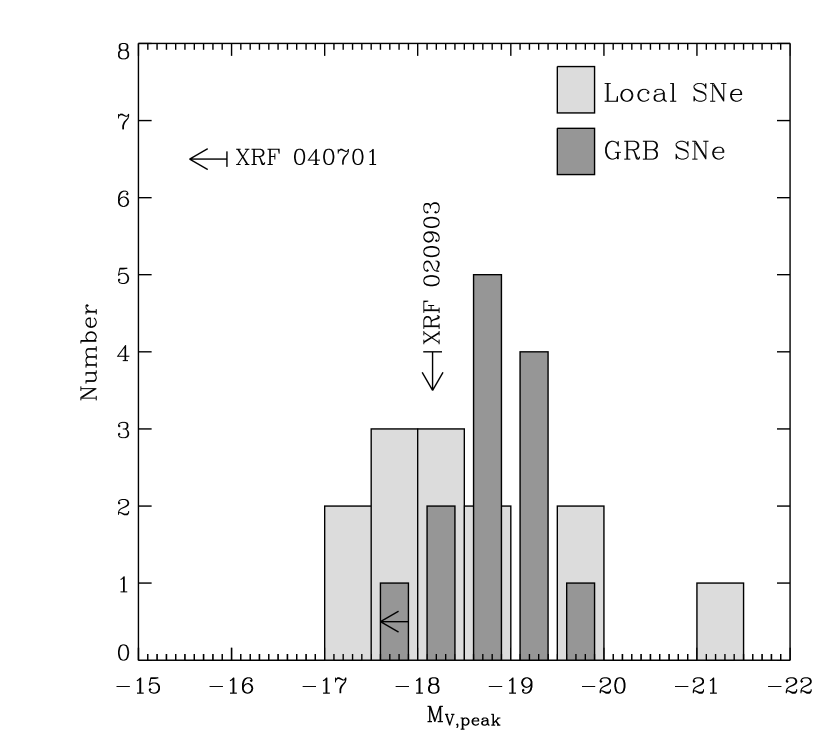
In Figure 11 we compile peak magnitudes for local Type Ibc supernovae and GRB-associated SNe. While the GRB-SN population tend to lie at the bright end of the local SN luminosity distribution there is a pronounced magnitude spread in their observed peak brightness which produces significant overlap with the local SNe. We emphasize that the SN associated with XRF 020903 is consistent with this observed spread, however, a supernova associated with XRF 040701 would be considered faint even in the context of the local SN population.
Since peak luminosity correlates roughly with the mass of 56Ni synthesized in the explosion, these observations imply a significant spread in the Nickel yield from GRB and XRF explosions. Most importantly, as revealed from low luminosity GRB/XRF SNe, engine-driven relativistic explosions do not necessarily produce more 56Ni than local SNe Ibc, which are not associated with relativistic ejecta (Berger et al. 2003). This result is bracketed by two extremes: events with a large Nickel output can be associated with weak engine-driven explosions harboring only a small amount of relativistic ejecta (e.g. SN 1998bw/GRB 980425), and those with a low Nickel yield can be produced in strong engine-driven explosions characterized by copious amounts of energy coupled to highly relativistic jetted material. In conclusion, we find evidence that Nickel production and engine activity represent independent parameters of the GRB/XRF explosion mechanism, each of which can be individually tuned.
References
- Alard (2000) Alard, C. 2000, A&AS, 144, 363.
- Barraud et al. (2004) Barraud, C., Ricker, G., Atteia, J.-L., Kawai, N., Lamb, D., and Woosley, S. 2004, GRB Circular Network, 2620.
- Benetti et al. (2002) Benetti, S., Branch, D., Turatto, M., Cappellaro, E., Baron, E., Zampieri, L., Della Valle, M., and Pastorello, A. 2002, MNRAS, 336, 91.
- Berger (2004) Berger, E. 2004, GRB Circular Network, 2650.
- Berger et al. (2004a) Berger, E., Fox, D. B., Kulkarni, S. R., Krzeminski, W., and Hamuy, M. 2004a, GRB Circular Network, 2644.
- Berger et al. (2005b) Berger, E. et al. 2005b, ArXiv Astrophysics e-prints. astro-ph/0502468.
- Berger et al. (2004) Berger, E., Gal-Yam, A., Fox, D. B., Thompson, I., Schmidt, B., McNaught, R., and Peterson, B. 2004b, GRB Circular Network, 2631.
- Berger, Kulkarni & Frail (2003) Berger, E., Kulkarni, S. R., and Frail, D. A. 2003, ApJ, 590, 379.
- Berger et al. (2005a) Berger, E. et al. 2005a, in prep.
- Berger et al. (2003) Berger, E., Kulkarni, S. R., Frail, D. A., and Soderberg, A. M. 2003, ApJ, 599, 408.
- Bersier et al. (2004) Bersier, D. et al. 2004, American Astronomical Society Meeting Abstracts, 205, .
- Bloom et al. (2003) Bloom, J. S., Fox, D., van Dokkum, P. G., Kulkarni, S. R., Berger, E., Djorgovski, S. G., and Frail, D. A. 2003, ApJ, 599, 957.
- Bloom et al. (2002) Bloom, J. S. et al. 2002, ApJ, 572, L45.
- Bloom et al. (1999) Bloom, J. S. et al. 1999, Nature, 401, 453.
- Butler et al. (2004) Butler, N. R. et al. 2004, ArXiv Astrophysics e-prints. astro-ph/0408453.
- Campana & Moretti (2004a) Campana, S. and Moretti, A. 2004a, GRB Circular Network, 2649.
- Campana & Moretti (2004b) Campana, S. and Moretti, A. 2004b, GRB Circular Network, 2656.
- Chornock & Filippenko (2002) Chornock, R. and Filippenko, A. V. 2002, GRB Circular Network, 1609.
- Clocchiatti et al. (2000) Clocchiatti, A. et al. 2000, ApJ, 529, 661.
- Clocchiatti et al. (2001) Clocchiatti, A. et al. 2001, ApJ, 553, 886.
- Clocchiatti et al. (1996) Clocchiatti, A., Wheeler, J. C., Benetti, S., and Frueh, M. 1996, ApJ, 459, 547.
- Clocchiatti et al. (1997) Clocchiatti, A. et al. 1997, ApJ, 483, 675.
- Cobb & Bailyn (2004) Cobb, B. E. and Bailyn, C. D. 2004, GRB Circular Network, 2642.
- Covino et al. (2002) Covino, S. et al. 2002, GRB Circular Network, 1563.
- D’Avanzo et al. (2004) D’Avanzo, P., Cucchiara, A., Tagliaferri, G., Malesani, D., Fugazza, D., Covino, S., and Campana, S. 2004, GRB Circular Network, 2651.
- de Ugarte Postigo et al. (2004) de Ugarte Postigo, A., Tristram, P., Sasaka, Gorosabel, J., Yock, P., and Castro-Tirado, A. J. 2004, GRB Circular Network, 2621.
- Deng et al. (2005) Deng, J., Tominaga, N., Mazzali, P. A., Maeda, K., and Nomoto, K. 2005, ArXiv Astrophysics e-prints. astro-ph/0501670.
- Filippenko, Porter & Sargent (1990) Filippenko, A. V., Porter, A. C., and Sargent, W. L. W. 1990, AJ, 100, 1575.
- Foley et al. (2003) Foley, R. J. et al. 2003, PASP, 115, 1220.
- Fox (2004) Fox, D. B. 2004, GRB Circular Network, 2630.
- Fox et al. (2003) Fox, D. W. et al. 2003, ApJ, 586, L5.
- Fruchter & Hook (2002) Fruchter, A. S. and Hook, R. N. 2002, PASP, 114, 144.
- Fynbo et al. (2004) Fynbo, J. P. U. et al. 2004, ApJ, 609, 962.
- Galama et al. (1998b) Galama, T. J. et al. 1998a, IAU Circ., 6895, 1.
- Galama et al. (1998a) Galama, T. J. et al. 1998b, Nature, 395, 670.
- Gorosabel et al. (2002) Gorosabel, J., Hjorth, J., Pedersen, H., Jensen, B. L., Fynbo, J. P. U., Andersen, M., Castro Cer n, J. M., and Castro-Tirado, A. J. 2002, GRB Circular Network, 1631.
- Gotz et al. (2004) Gotz, M., Mereghetti, S., Mowlavi, N., Beck, M., and Borkowsk, J. 2004, GRB Circular Network, 2640.
- Granot, Ramirez-Ruiz & Perna (2005) Granot, J., Ramirez-Ruiz, E., and Perna, R. 2005, ArXiv Astrophysics e-prints. astro-ph/0502300.
- Hatano et al. (2001) Hatano, K., Branch, D., Nomoto, K., Deng, J. S., Maeda, K., Nugent, P., and Aldering, G. 2001, Bulletin of the American Astronomical Society, 33, 838.
- Heise et al. (2001) Heise, J., in’t Zand, J., Kippen, R. M., and Woods, P. M. 2001, in Gamma-ray Bursts in the Afterglow Era, 16.
- Henden (2004) Henden, A. 2004, GRB Circular Network, 2727.
- Hjorth et al. (2003) Hjorth, J. et al. 2003, Nature, 423, 847.
- Howell et al. (2005) Howell, D. A. et al. 2005, ApJ. submitted.
- Iwamoto et al. (2000) Iwamoto, K. et al. 2000, ApJ, 534, 660.
- Kelson et al. (2004) Kelson, D. D., Koviak, K., Berger, E., and Fox, D. B. 2004, GRB Circular Network, 2627.
- Kinney et al. (1993) Kinney, A. L., Bohlin, R. C., Calzetti, D., Panagia, N., and Wyse, R. F. G. 1993, ApJS, 86, 5.
- Klotz et al. (2004) Klotz, A., Atteia, J. L., Sratta, G., and Bohr, M. 2004, GRB Circular Network, 2729.
- Kosugi et al. (2004) Kosugi, G., Kawai, N., Tajitsu, A., and Furusawa, H. 2004, GRB Circular Network, 2726.
- Levan et al. (2002) Levan, A., Fruchter, A., Strolger, L., Burud, I., and Rhodes, J. 2002, GRB Circular Network, 1761.
- Levan et al. (2004) Levan, A. et al. 2004, ArXiv Astrophysics e-prints. astro-ph/0410560.
- Lipkin et al. (2004) Lipkin, Y. M. et al. 2004, ApJ, 606, 381.
- Malesani et al. (2004) Malesani, D. et al. 2004, ApJ, 609, L5.
- Matheson et al. (2003) Matheson, T. et al. 2003, ApJ, 599, 394.
- Mazzali et al. (2002) Mazzali, P. A. et al. 2002, ApJ, 572, L61.
- McKenzie & Schaefer (1999) McKenzie, E. H. and Schaefer, B. E. 1999, PASP, 111, 964.
- Patat et al. (2001) Patat, F. et al. 2001, ApJ, 555, 900.
- Patel et al. (2004b) Patel, S. et al. 2004b, GRB Circular Network, 2655.
- Patel et al. (2004a) Patel, S. et al. 2004a, GRB Circular Network, 2648.
- Pian et al. (2000) Pian, E. et al. 2000, ApJ, 536, 778.
- Pian et al. (2004) Pian, E. et al. 2004, GRB Circular Network, 2638.
- Predehl & Schmitt (1995) Predehl, P. and Schmitt, J. H. M. M. 1995, A&A, 293, 889.
- Price et al. (2003) Price, P. A. et al. 2003, ApJ, 584, 931.
- Richmond et al. (1996) Richmond, M. W. et al. 1996, AJ, 111, 327.
- Sakamoto et al. (2004) Sakamoto, T. et al. 2004a, ArXiv Astrophysics e-prints. astro-ph/0409128.
- Sakamoto et al. (2004) Sakamoto, T. et al. 2004b, ApJ, 602, 875.
- Sari, Piran & Halpern (1999) Sari, R., Piran, T., and Halpern, J. P. 1999, ApJ, 519, L17.
- Sari, Piran & Narayan (1998) Sari, R., Piran, T., and Narayan, R. 1998, ApJ, 497, L17+.
- Schlegel, Finkbeiner & Davis (1998) Schlegel, D. J., Finkbeiner, D. P., and Davis, M. 1998, ApJ, 500, 525.
- Sharina, Karachentsev & Tikhonov (1996) Sharina, M. E., Karachentsev, I. D., and Tikhonov, N. A. 1996, A&AS, 119, 499.
- Sirianni et al. (2005) Sirianni, M. et al. 2005, PASP. submitted.
- Soderberg et al. (2004) Soderberg, A. M. et al. 2004, ApJ, 606, 994.
- Soderberg et al. (2002) Soderberg, A. M. et al. 2002, GRB Circular Network, 1554.
- Sohn & Davidge (1996) Sohn, Y. and Davidge, T. J. 1996, AJ, 111, 2280.
- Stanek et al. (2005) Stanek, K. Z., Garnavich, P. M., Nutzman, P. A., Hartman, J. D., and Garg, A. 2005, ArXiv Astrophysics e-prints. astro-ph/0502319.
- Stanek et al. (2003) Stanek, K. Z. et al. 2003, ApJ, 591, L17.
- Stockdale et al. (2005) Stockdale, C. J., Sramek, R. A., Weiler, K. W., Van Dyk, S. D., Panagia, N., Montes, M. J., and Rupen, M. P. 2005, in Cosmic Explosions: On the 10th Anniversary of SN1993J (IAU Colloquium 192.
- Stritzinger et al. (2002) Stritzinger, M. et al. 2002, AJ, 124, 2100.
- Tominaga et al. (2004) Tominaga, N., Deng, J., Mazzali, P. A., Maeda, K., Nomoto, K., Pian, E., Hjorth, J., and Fynbo, J. P. U. 2004, ApJ, 612, L105.
- Tsvetkov (1987) Tsvetkov, D. Y. 1987, Soviet Astronomy Letters, 13, 376.
- van Dokkum & Bloom (2003) van Dokkum, P. G. and Bloom, J. S. 2003, GRB Circular Network, 2380.
- Yamazaki, Ioka & Nakamura (2003) Yamazaki, R., Ioka, K., and Nakamura, T. 2003, ApJ, 593, 941.
- Yamazaki et al. (2004a) Yamazaki, T., Ricker, G., Atteia, J.-L., Kawai, N., Lamb, D., and Woosley, S. 2004a, GRB Circular Network, 2712.
- Yamazaki et al. (2004b) Yamazaki, T., Ricker, G., Atteia, J.-L., Kawai, N., Lamb, D., and Woosley, S. 2004b, GRB Circular Network, 2713.
- Zeh, Klose & Hartmann (2004) Zeh, A., Klose, S., and Hartmann, D. H. 2004, ApJ, 609, 952.
- Zhang, Woosley & Heger (2004) Zhang, W., Woosley, S. E., and Heger, A. 2004, ApJ, 608, 365.
| Target | Date Obs | Exp. Time | Filter | HST magaaFrom residual image. Observed magnitude, not corrected for foreground extinction. | ExtinctionbbGalactic extinction from Schlegel, Finkbeiner & Davis (1998). | Johnson magccFrom residual image. Corrected for foreground extinction using given in column 7. | |
|---|---|---|---|---|---|---|---|
| (UT) | (days) | (sec) | (AB) | (Vega) | |||
| XRF 020903 | 2002 December 3.8 | 91.4 | 1840 | F606W | |||
| — | 2003 June 30.6 | 300.2 | 1920 | F606W | — | — | — |
| XRF 040701 | 2004 August 9.6 | 39.1 | 1820 | F625W | |||
| — | 2004 August 30.5 | 60.0 | 1820 | F625W | — | — | — |
| — | 2004 August 9.7 | 39.1 | 1940 | F775W | |||
| — | 2004 August 30.5 | 60.0 | 1940 | F775W | — | — | — |
| XRF 040812 | 2004 September 13.3 | 32.0 | 2000 | F625W | |||
| — | 2004 October 4.8 | 53.5 | 2000 | F625W | — | — | — |
| — | 2004 September 13.4 | 32.1 | 2120 | F775W | |||
| — | 2004 October 4.8 | 53.5 | 2120 | F775W | — | — | — |
| XRF 040916 | 2004 October 18.4 | 32.4 | 1930 | F625W | |||
| — | 2004 November 30.3 | 75.3 | 1928 | F625W | — | — | — |
| — | 2004 October 18.4 | 32.4 | 2058 | F775W | |||
| — | 2004 November 30.4 | 75.4 | 2056 | F775W | — | — | — |