A Systematic Search for Gravitationally-Lensed Arcs in the Hubble Space Telescope WFPC2 Archive
Abstract
We present the results of a systematic search for gravitationally-lensed arcs in clusters of galaxies located in the Hubble Space Telescope Wide Field and Planetary Camera 2 data archive. By carefully examining the images of 128 clusters we have located 12 candidate radial arcs and 104 tangential arcs, each of whose length to width ratio exceeds 7. In addition, 24 other radial arc candidates were identified with a length to width ratio less than 7. Keck spectroscopy of 17 candidate radial arcs suggests that contamination of the radial arc sample from non-lensed objects is 30-50%. With our catalog, we explore the practicality of using the number ratio of radial to tangential arcs as a statistical measure of the slope of the dark matter distribution in cluster cores (where at small radii). Despite the heterogeneous nature of the cluster sample, we demonstrate that this abundance ratio is fairly constant across various cluster subsamples partitioned according to X-ray luminosity and optical survey depth. We develop the necessary formalism to interpret this ratio in the context of two-component mass models for cluster cores. Although the arc statistics in our survey are consistent with a range of density profiles – 1.6 depending on various assumptions, we show that one of the prime limiting factors is the distribution of stellar masses for the brightest cluster galaxies. We discuss the prospects for improving the observational constraints and thereby providing a reliable statistical constraint on cluster dark matter profiles on 100 kpc scales.
1 Introduction
The imaging cameras on Hubble Space Telescope () provide a valuable resource for studies of gravitational lensing. For example, the improved image quality compared to ground-based telescopes has enabled the morphological recognition of tangential arcs (e.g. Smail et al 1996; Kneib et al 1996; Gioia et al. 1998). The analysis of such arcs has led to detailed mass models of great utility both in determining dark and baryonic mass distributions (e.g. Kneib et al 2003; Gavazzi et al. 2003; Smith et al. 2005) and in the study of highly magnified distant galaxies (e.g. Franx et al. 1997; Seitz et al. 1998; Pettini et al. 2000; Smith et al. 2002; Swinbank et al. 2003; Ellis et al 2001; Santos et al 2004; Kneib et al 2004).
HST images have also been invaluable in studying radial gravitationally-lensed arcs (e.g. Gioia et al. 1998; Smith et al. 2001; Sand, Treu & Ellis 2002; Sand et al. 2004). These arcs are often embedded in the envelope of the central luminous cluster galaxy and thus a high angular resolution is essential to uncover their presence. Radial arcs straddle the inner critical line whose location has long been known to provide a valuable constraint on the form of the mass profile on 100 kpc scales (e.g. Fort et al 1992; Miralda-Escudé 1993; Miralda-Escudé 1995; Bartelmann 1996; Williams et al. 1999; Meneghetti et al. 2001).
A long-standing field of inquiry has been the comparison of theoretical predictions and ground-based observations of the abundance of arcs for example as a constraint on cosmology. Bartelmann et al. (1998) originally found that the number of strongly-lensed arcs greatly exceeds that expected from CDM simulations, preferring instead an open CDM cosmology. Various systematic effects have been proposed to explain the apparent excess including cluster substructure (e.g. Flores, Maller, & Primack 2000; Torri et al. 2004), the influence of the brightest cluster galaxy (BCG; Meneghetti, Bartelmann, & Moscardini 2003), and uncertainties in the background redshift distribution of lensed sources (Dalal, Holder, & Hennawi 2004; Wambsganss, Bode, & Ostriker 2004). Many of these effects can be calibrated through high resolution simulations of galaxy clusters and accurate background redshift distributions based on photometric redshift surveys. Indeed, several recent articles reconcile the expected number of gravitational arcs in a CDM universe with observations (Dalal et al. 2004; Wambsganass et al. 2003; Oguri et al. 2003) and attention is now focusing on how to use such observations to constrain dark energy models (e.g. Meneghetti et al. 2004; Dalal, Hennawi & Bode 2004).
It is also possible to use arc statistics to constrain the central density profiles of clusters (e.g. Wyithe, Turner, & Spergel 2001), thereby testing the prediction that CDM halos have profiles steeper than (e.g. Navarro, Frenk, & White 1997; Moore et al. 1998; Power et al. 2003; Fukushige, Kawaii, & Makino 2004; Tasitsiomi et al. 2004; Diemand et al. 2004). These analyses are subject to uncertainties and systematics similar to those discussed above.
To date, several ground-based optical surveys have been used for statistical studies of gravitational arcs (e.g. Le Fevre et al. 1994; Luppino et al. 1999; Zaritsky & Gonzalez 2003; Gladders et al. 2003). Despite different cluster selection and redshift criteria, these surveys have measured roughly comparable giant tangential gravitational arc incidences which have guided theoretical understanding of the processes responsible for strong lensing on the galaxy cluster scale. Given typical ground based seeing, however, these are of marginal utility in searches for radially-elongated thin, faint arcs buried in the halos of bright cluster galaxies.
The primary goal of this paper is to compile a list of the gravitationally lensed arcs found in the HST/WFPC2 archive and to explore the feasibility of using the number ratio of radial to tangential arcs as a means of constraining the inner density profiles in cluster cores. Molikawa & Hattori (2001) have shown that the abundance ratio of radial to tangential arcs is sensitive to the mean density profile of the cluster sample. Oguri, Taruya, & Suto (2001) studied the predicted ratio of radial to tangential arcs as a function of not only the inner dark matter density slope, but the concentration parameter, , of the halos as well. Oguri (2002; hereafter O02; see also Keeton 2001) has suggested that the various systematics which effect the cross section for lensing are significantly reduced when considering the number ratio of radial to tangential arcs rather than their absolute number. To constrain the dark matter density profile, we adopt the methodology presented by O02, extending their technique to include a second mass component arising from the central cluster galaxy. Our analysis is intended to complement studies of the DM density profile in clusters performed on individual systems (e.g. Kneib et al. 2003; Smith et al. 2001; Gavazzi et al. 2003; Sand et al. 2002; Sand et al. 2004; Buote et al. 2004; Lokas & Mamon 2003; Kelson et al. 2002) and through other statistical techniques (e.g. van der Marel 2000; Dahle et al. 2003; Mahdavi & Geller 2004).
A plan of the paper follows. In §2 we discuss the archival sample of clusters, how representative sub-samples can be defined for later analyses and describe our reduction procedure. In §3 we describe the procedures we adopted for identifying lensed arcs and how they are characterized by their length-to-width ratio. We also present new follow-up spectroscopy for several candidate radial arcs as a means of estimating the likely contamination by other sources (e.g. foreground galaxies). In §4 we present our methodology for calculating the expected radial to tangential arc number ratio and discuss the various assumptions and their limitations. In §5 we derive constraints on the inner DM density slope and discuss our results. In §6 we summarize and discuss future prospects for improving the constraints. An Appendix describes and presents the cluster catalog, arc catalog and finding charts for the newly-located radial arcs.
Throughout this paper, we adopt as the radial coordinate in 3-D space and as the radial coordinate in 2-D projected space. We assume H0=65 km s-1Mpc-1, and =0.7.
2 Cluster Selection
The Hubble Space Telescope data archive is now sufficiently extensive to provide the basis for a search for gravitational arcs in galaxy clusters. In this work, we restricted our search to images taken with the Wide Field Planetary Camera 2 (WFPC2). Exploitation of the archival set of images taken with the more recently-installed and superior Advanced Camera for Surveys (ACS) is left for a future study.
As the overarching goal is to identify all tangentially and radially-elongated gravitational arcs, regardless of any preordained intrinsic property of the galaxy cluster, fairly liberal criteria were used for selecting observations from the archive. Only clusters of known redshift with were considered. We stipulated that images of the cluster had to be available in one or more of the following broad band filters: F450W, F555W, F606W, F675W, F702W and F814W. Procedurally, an abstract search was done on the HST archive and proposals containing the words “galaxy” and “cluster” or “group” were flagged. This initial list of abstracts was pared by inspection, so that only data for those proposals directed at galaxy clusters or groups were requested. All of the data from this edited abstract list was requested if they satisfied the camera, filter and redshift requirements. This search technique ensures only programs deliberately targetting clusters are examined.
The resulting cluster catalog is listed in Table 3, in the Appendix. The total sample includes 128 galaxy clusters and a histogram of the redshift distribution is shown in Figure A Systematic Search for Gravitationally-Lensed Arcs in the Hubble Space Telescope WFPC2 Archive.
2.1 Uniform Cluster Subsamples
The resulting cluster sample is heterogenous with factors such as exposure time, redshift, richness/mass/X-ray luminosity and filter choice all affecting the sensitivity to gravitational arcs. Although this may not seriously affect our goal of measuring the abundance ratio of radial to tangential arcs and constraining the inner slope of the DM density profile (see O02; the arc ratio is relatively robust with respect to cluster mass and observational selection effects), it is helpful to consider the possibility of partitioning the large sample into more complete subsets for later use. Membership of each cluster in the various sub-samples introduced below is indicated in Table 3.
X-ray selected sub-samples will be beneficial given the correlation between cluster mass and X-ray luminosity. We define two in particular that have been discussed in the literature and which link directly to specific HST programs.
1.Smith sample: This sample follows the work of Smith et al. (2001,2002a,2002b,2003,2005) and includes 10 clusters. Clusters in this sample are X-ray luminous ( ergs ; 0.1-2.4 keV; Ebeling et al. 1996) and lie in the redshift range .
2.EMSS sample: Another X-ray sub-sample can be drawn from the EMSS cluster survey (0.3-3.5 keV; limiting sensitivity of ergs ; Henry et al. 1992). Of the 93 clusters identified by Henry et al. twelve have been imaged with HST/WFPC2. Two previous gravitational arc searches were conducted with a subsample of this kind using ground-based images (Le Fevre et al 1994; Luppino et al. 1999).
3. Edge sample: This refers to a sample of clusters whose imaging was conducted to a uniform depth (although the clusters are not all the same redshift). Such a sample should, broadly speaking, pick out all lensed features to a certain surface brightness threshold. Two large SNAPSHOT programs are prominent in this respect: PID 8301 and 8719 (PI: Edge) which image together 44 0.1 clusters in the F606W filter with exposure times between 0.6 and 1.0 ks. According to the HST proposals, this program sought to understand the morphological properties of central cluster galaxies. Clusters were selected from the Brightest Cluster Sample (BCS – Ebeling et al. 1998) for which optical spectra of the central cluster galaxies are available (Crawford et al. 1999). The primary sample was selected from those BCS clusters hosting a BCG with optical line emission. A secondary control sample of BCS clusters that do not host an optical line emitting BCG was also selected to span the same range in redshift and X–ray luminosity as the primary sample (Edge, priv. comm.). Optical line emission from BCGs is one of the least ambiguous indicators of clusters for which the central cooling timescale is less than the Hubble time (Crawford et al. 1999). These ”cooling flow” clusters are also typically classified as relaxed clusters (e.g. Smith et al. 2005). The clusters in the control sample were also selected to appear relaxed at optical and X–ray wavelengths. While there are undoubtedly some exceptions (e.g. Edge et al. 2003), the ”Edge sample” is likely dominated by relaxed clusters.
2.2 WFPC2 Data Reduction
Although our cluster sample is drawn from the HST/WFPC2 archive, the various goals of each original program means the observing strategy varied from case to case. Fortunately, however, there are only two basic approaches to taking the observations. The first includes those CRSPLIT or SNAPSHOT observations in which two or more non-dithered exposures were taken. The second refers to the case where two or more dithered (either with integer or half-integer pixel offsets) exposures were taken either to enhance the sampling of the WFPC2 point spread function or for better cosmic ray removal (or both). A standard data reduction script was written for each of these cases and is described here briefly.
In the SNAPSHOT case, cosmic ray rejection was first performed on each individual exposure using the iraf task lacosmic (van Dokkum 2001). The cleaned images were then combined with the task crrej, which also served to remove residual cosmic ray hits. Background counts subtracted from each of the WFPC2 chips were noted and used in later photometric calculations. The WFPC2 chips were combined using the iraf task wmosaic.
For the multiple dithered exposures, the data were reduced using the iraf package DRIZZLE (Fruchter & Hook 2002) with a fixed parameter set. In particular, the final pixel size (represented by the drizzle.scale parameter) was set to 0.5 resulting in a pixel size half that of the original image. The drizzled “drop” size (represented by the drizzle.pixfrac parameter) was set to 0.8 regardless of the observational program. The final images of the WFPC2 chips were combined using the iraf task gprep. The sky background determined for each WFPC2 chip was again noted for later photometric use.
To aid in locating radial arcs, which are often buried in the halo of the BCG, we also examined images after subtracting the (assumed symmetrical) light of the most luminous galaxies (usually but not always just the central member). To do this we employed the iraf task ellipse allowing both the position angle and ellipticity of the fitted isophotes to vary as a function of semi-major axis. We discuss in §3.1, §3.2, & §3.3 how the galaxy subtraction and residuals might affect arc identification, photometry and derived length to width ratios, respectively.
3 The Arc Sample
In this section we discuss how the sample of tangential and radial arcs were identified in a consistent manner from the reduced data. The resulting catalog is presented in Table A Systematic Search for Gravitationally-Lensed Arcs in the Hubble Space Telescope WFPC2 Archive in the Appendix.
3.1 Arc Identification
Each mosaiced image was visually examined for lensed features by one of the authors (DJS), both in its original and bright galaxy-subtracted incarnations. A candidate gravitational arc was designated according to one of two categories: tangential or radial arc. The distinction between tangential and radial arcs is determined by the arc orientation with respect to the cluster center (assumed to be roughly coincident with the dominant BCG) and is rarely ambiguous, even in bi- or multi-modal clusters. Twenty-five of the HST clusters were also examined by one other author (TT). Within this subsample, DJS found 2 radial and 37 tangential arcs with a 7 (see §4.1 for justification of this criterion), while TT found 2 radial and 41 tangential arcs, resulting in arc number ratios of and , respectively. Thirty-six of the tangential arcs and both of the radial arcs were in common between the two samples. Given the consistency between these measurements, we conclude that our results are not sensitive to the person doing the identification.
A serious concern given our motivation to measure the ratio of the radial to tangential arcs, is the likelihood that radial arcs are harder to locate in the noisier region underneath the envelope of the brightest cluster galaxy. Taking the ten cluster Smith sample (see § 2.1) as an example, we find the rms background noise to be 1.5 to 3 times higher in the central regions after galaxy subtraction than in the periphery of the WFPC2 fields appropriate for the identification of tangential arcs. To investigate the bias this might cause in the preferential loss of radial arcs at a given image surface brightness, we re-examined the selection of tangential arcs after artificially increasing the background noise by a factor 3. Of the 38 tangential arcs (with 7) observed in the Smith sample (see Table 2), 32 were still identifiable as arcs after the background noise was increased. This implies that 20% more radial arcs would be found if they were looked for at an identical surface brightness limit as the tangential arc population. On its own, this systematic effect does not effect our conclusions on the mean dark matter density profile in this cluster sample, as will be shown in § 5.
When searching for radial arcs, our strategy of examining images after central galaxy subtraction is best suited for the case of a single, dominant central galaxy. However, eight clusters in our sample contain multiple bright galaxies in their core for which our central galaxy subtraction technique is less effective. The conservative results presented in § 5 do not change within the uncertainties if these clusters are excluded from our study. The photometric properties and length-to-width ratio () of arcs found in these clusters are also less certain than those found in clusters dominated by a single central galaxy (see Table A Systematic Search for Gravitationally-Lensed Arcs in the Hubble Space Telescope WFPC2 Archive for details).
3.2 Arc Photometry
Photometric magnitudes were measured for all candidate arcs. This is a complex task for two reasons. First, arcs are by definition often highly distorted, making them poorly-suited to automatic source identification codes such as SExtractor (Bertin & Arnouts 1996). Second, contamination from bright, nearby galaxies can affect the result, particularly for the radial arcs buried in galaxy halos.
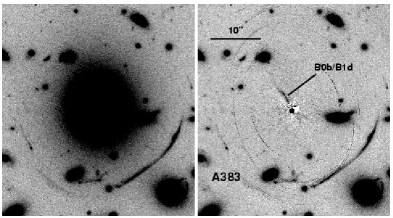
Our procedure was as follows. Polygonal apertures were determined for each arc using the iraf task polymark. Additionally, all possible galaxy interlopers were digitally subtracted with ellipse (in addition to the BCG; see § 2.2), as illustrated for Abell 383 in Figure 1. In order to measure the photometric uncertainties, a master “sky” frame was made by summing the initial sky subtraction of the image (see § 2.2) and the subtracted contaminating galaxies. Identical apertures were applied to both the “sky” frame and the object frames to determine the magnitude and associated uncertainty for each arc.
The subtraction of flux from cluster galaxies adjacent to an arc is not a perfect process. The subtraction of these galaxies leaves residuals which typically appear as thin ( pixels), tangentially oriented features (see Figure 1). Fortunately, upon close inspection these are readily distinguished from true gravitational arcs. Other residuals arise from nearby WFPC2 chip boundaries, tidal features in the cluster, double nuclei in BCGs, dust-lanes, and spiral arms. Those arc candidates whose photometry appears to have been compromised due to such residuals are flagged in Table A Systematic Search for Gravitationally-Lensed Arcs in the Hubble Space Telescope WFPC2 Archive in the Appendix. Both the photometry and measured for these flagged objects are more uncertain than the formal uncertainty listed in the table.
3.3 Arc Length-to-Width Ratio
The arc length-to-width ratio () is often used for characterizing how strongly a source has been lensed. Limiting our arc sample according to some criterion provides a means for undertaking comparisons with earlier work and with theoretical predictions (e.g. Bartelmann & Weiss 1994).
In practice, we measured ratios at three different signal to noise per pixel thresholds: 2.0,1.5 and 1.0. The mean and rms of these three measurements is given in Table A Systematic Search for Gravitationally-Lensed Arcs in the Hubble Space Telescope WFPC2 Archive. All measurements were done on the polygonal apertures used for photometry, limiting the possibility of contamination from nearby sources, and also limiting the chances of a very spurious measurement. In the case where a cluster has multi-band data, the final ratio is the mean found across the bands and the uncertainty includes measures in all bands. Arc lengths are measured by first finding the intensity weighted centroid of the arc within the same polygonal aperture that was used to obtain photometry. From there the pixel furthest from the arc centroid above the threshold is calculated. Finally, the pixel (above the threshold) furthest from this pixel is found. The final arc length is the sum of the two line segments connecting these three points. The width is simply the ratio of the contiguous area above the threshold to the length. If the arc width was found to be 03 (the typical WFPC2 PSF is 015), then the feature was determined to be unresolved in that direction. In this case, the measured is a lower limit (with the width set to 03) as noted in Table A Systematic Search for Gravitationally-Lensed Arcs in the Hubble Space Telescope WFPC2 Archive. As discussed in the arc photometry subsection, there are several arcs whose measurement was possibly compromised due to residuals from the galaxy subtraction technique, and these arcs have been flagged in Table A Systematic Search for Gravitationally-Lensed Arcs in the Hubble Space Telescope WFPC2 Archive.
Since this is the first systematic search for radial arcs, all candidates are presented in Table A Systematic Search for Gravitationally-Lensed Arcs in the Hubble Space Telescope WFPC2 Archive with an accompanying finding chart in Fig 4, regardless of their . For the tangential arcs, only those with are presented unless there is a spectroscopically-confirmed redshift in the literature (even though these arcs were not used in our final analysis, § 5).
3.4 Spectroscopic follow-up
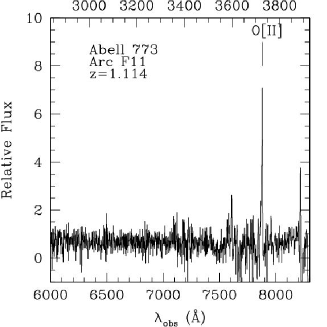
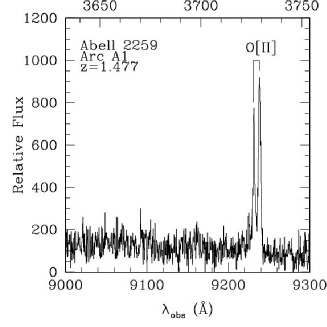
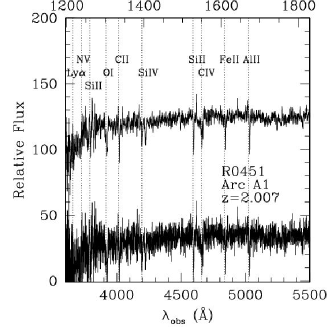
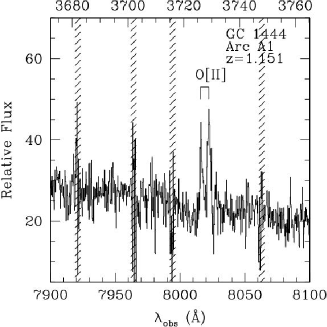
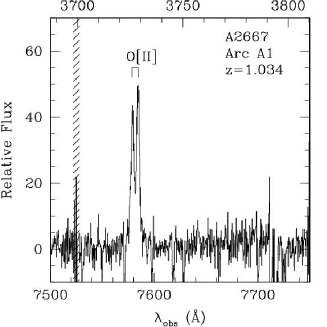
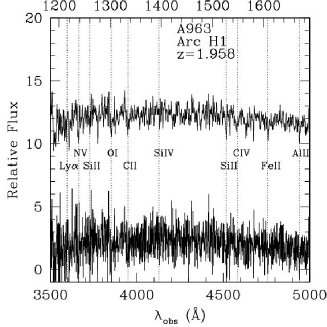
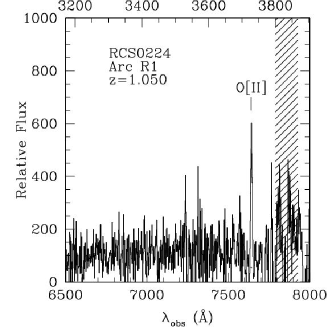
To gauge possible contamination of the radial arc candidate list by non-lensed sources, we have undertaken a limited Keck spectroscopic campaign as part of our quest to obtain deep spectroscopy of lensed systems for detailed individual study (Sand et al. 2002; 2004). Possible sources of contamination in the arc candidate list include optical jets and cooling flow features associated with the central cluster galaxy, and foreground edge-on disk galaxies. A summary of the spectroscopic results are given in Table 1. In this table we also present a compilation of spectroscopic redshifts for several tangential arcs (those which have not yet been published). The new arc spectra are shown in Figure 2.
Discussing the radial arc candidates in more detail:
-
•
GC 1444 & RCS 0224: These are the new radial arc redshifts presented in this work, based on single emission lines assumed to be O[II]. Both radial arc candidates have continuum blueward of the emission line making its interpretation as Ly unlikely.
-
•
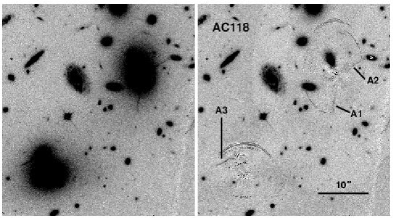
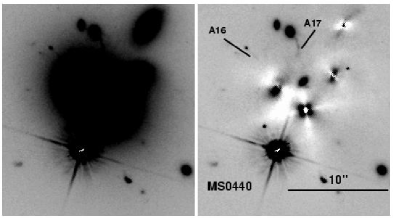
Abell 370, Abell 773, GC0848, Abell 1835, MS0440 and AC118: The spectra of these radial arc candidates were inconclusive. The spectrum was either faint and featureless or not detected at all. Note that spectra were taken for two radial arc candidates in AC118 (A1 and A2). The spectral coverage of all observations was continuous between 4000 and 10,000 Å.
-
•
MS 1455, 3c435a, 3c220, IRAS 0910 & A2667: These radial arc candidates are sources at the cluster redshift. The spectra exhibit numerous emission lines including: [OII], H, H, [OIII] 4959 and 5007, [O I] 6300 and 6363, [N II] 6548, H, [N II] 6583, and [SII] 6716 and 6731. These features each have velocity structures that can span hundreds of kilometers per second.
In addition to the spectroscopy presented in Sand et al. (2002, 2004), we have now attempted spectroscopic verification for 17 candidate radial arcs. Five spectra are consistent with the lensing hypothesis (Abell 383, MS2137, GC1444, RCS0224 (arc R1) and RXJ1133), seven are inconclusive (Abell 370, Abell 773, GC0848, Abell 1835, MS0440 and two arcs in AC118), and five turn out to be spectroscopically coincident with the cluster redshift (MS1455, 3c435a, 3c220, IRAS 0910 & A2667).
Although not all radial candidates selected for Keck spectroscopy have 7, it is fair to assume this sample is representative of the archive catalog list, since targets were selected on availability at the telescope (e.g. RA & DEC) and not towards arcs with any specific quality. A key issue, however, in deriving a contamination fraction is the question of the identity of those candidate radial arcs whose nature we were unable to confirm. Most likely these are either optical synchrotron jets associated with the BCG (which would have featureless spectra) or 12 lensed systems with a weak absorption line spectrum. Based on our current spectroscopy, we estimate that at least 30% of the radial arc candidates are likely to be non-lensed features. If we assume that half of the inconclusive spectra are also contaminants than the fraction would increase to 50%. The basic conclusions of this paper regarding the mean inner DM density slope are not sensitive to even a 50% decrease in the total number of radial arcs.
New redshifts were obtained for five tangential arc systems and are summarized in Table 1. One comment is warranted concerning the redshift of the southern arc in Abell 963. After considerable effort, an absorption line redshift (=1.958) was finally obtained for this low surface brightness feature (H1 in Smith et al. 2005) using the blue arm of LRIS on Keck I. Another portion of the southern arc (H2) seems to have a similar spectrum but of lower . The redshift and brightness of arc A1 in R0451 are interesting. At and this object is of similar brightness as the highly magnified Lyman break galaxy cB58.
3.5 Arc Statistics: A Summary
To summarize, using the archive of HST/WFPC2 galaxy clusters we have visually identified candidate gravitationally lensed features, performed appropriate photometry and measured the ratios. The arc catalog is presented in the Appendix as Table A Systematic Search for Gravitationally-Lensed Arcs in the Hubble Space Telescope WFPC2 Archive, along with published redshifts where available (or if presented in this work).
As this is the first systematic search for radial arcs, we list all such features found in Table A Systematic Search for Gravitationally-Lensed Arcs in the Hubble Space Telescope WFPC2 Archive and provide finding charts in Figure 4. The charts present the original HST image and a galaxy-subtracted version. In the case of the tangential arcs, since our subsequent analysis (§4 and §5) will focus only on those with 7 we only list those which either have a measured redshift or 7. Candidate arcs demonstrated spectroscopically to be foreground non-lensed sources are not included. However, where the spectroscopy is inconclusive, the candidates are retained. Offsets from the brightest cluster galaxy are provided in Table A Systematic Search for Gravitationally-Lensed Arcs in the Hubble Space Telescope WFPC2 Archive to aid in their identification.
As discussed in §4, our statistical analysis will be based on both radial and tangential arcs with 7. In the total cluster sample we have found 12 radial arc candidates and 104 tangential arc candidates out of a total sample of 128 galaxy clusters. In Table 2 we summarize the arc statistics for both the total sample and those subsamples introduced in §2.1. The 68% confidence range for the radial to tangential number ratio was computed using binomial statistics, appropriate for small number event ratios (Gehrels 1986). It is reassuring that the total sample and subsamples give similar results for this ratio, since this implies that the heterogeneous selection of clusters inherent in our analysis of the archival data is unlikely to be a dominant uncertainty.
4 Deriving Mass Distributions from Arc Statistics
In this section we discuss our methodology for calculating the expected number ratio of radial to tangential arcs, which is based on the precepts developed by O02 (§4.1). We will include the effect of the finite source size of the radial arc sources into our calculation, confirming that this is a significant contributor to the radial arc cross section which ultimately affects the deduced inner DM slope. We introduce our mass model in §4.2 and show further that the effects of a central BCG are also significant. In §4.3 we summarize those systematics that have been studied in previous analyses. Finally, in §4.4 we show how we use the arc cross sections to deduce the number ratio of radial to tangential arcs. Utilizing the tools presented in this section, we will place constraints on the inner DM profile in §5.
4.1 Methodology
We follow the prescription presented by O02 for calculating the expected number ratio of radial to tangential arcs. The lens equation is given by (e.g. Schneider, Ehlers, & Falco 1992),
| (1) |
where and are scaled radii in the source and lens plane, respectively. Throughout this work, we choose the generalized-NFW scale radius, , as our scaling radius, meaning that and . The deflection angle, , is determined by the mass distribution of the lens where the quantity is defined by
| (2) |
The quantity is proportional to the mass inside projected radius and is the surface mass density scaled by the critical surface mass density, ,
| (3) |
where
| (4) |
and , , and are the angular diameter distance to the lens, between the lens and source and to the source, respectively.
With these definitions, the two eigenvalues of the Jacobian mapping between the source and image plane can be written as
| (5) |
The root of these two equations describes the radial and tangential critical curves of the lens. Since the magnification of the source is equal to the inverse of the determinant of the Jacobian, the radial and tangential critical curves define regions where the magnification of the source formally diverges. For a simple spherical lens, an infinitesimal source at in the image plane is stretched by a factor in the tangential direction and in the radial direction. For an infinitesimal source, the cross section for either a radial or tangential arc is then simply the area in the source plane where
| (6) |
| (7) |
with being the minimum arc axis ratio to be considered. O02 demonstrates that only for is the ratio of radial to tangential arcs relatively robust with respect to systematic uncertainties such as source and lens ellipticity (see § 4.3). Even then, the finite source size of radial arcs must be taken into account. Throughout this work we will only consider situations in which , corresponding to .
As in O02, we first take the source size to be small for typical tangential arcs and so use Eqn.7 directly (see e.g. Hattori, Watanabe, & Yamashita 1997 for justification and Fig. 5; left panel of O02). Then the cross section for tangential arcs is
| (8) |
where and correspond to the position on either side of the tangential caustic which satisfies Eqn. 7. Figure A Systematic Search for Gravitationally-Lensed Arcs in the Hubble Space Telescope WFPC2 Archive illustrates the situation.
We now consider the effect of the finite source size for the radial arc sources. Useful diagrams for illustrating the relevant geometry are provided in Figs. 1 and 2 of O02 and we will adopt the nomenclature and procedure of that work. We assume that the sources are circular with a finite radius and consider situations where the source touches, crosses or lies within the radial caustic. Figure A Systematic Search for Gravitationally-Lensed Arcs in the Hubble Space Telescope WFPC2 Archive illustrates the dramatic effect that the finite source size can have on the radial arc cross section.
To allow for this important effect we require the true (unlensed) size distribution of a representative sample of 1-1.5 galaxies typical of those being lensed by our clusters. Fortunately, a 1.4 size distribution has been presented by Ferguson et al. (2004) based on the GOODS survey (see Fig. 2; top panel, of that work), and we will adopt this for the remainder of our analysis. Galaxy sizes in this redshift bin were found to have half-light radii (which we will take as the radius of our sources) between 02 and 11 with the peak of the distribution at 07. We shall show later that the arc number ratio is relatively insensitive to source redshift, making this redshift bin choice unimportant (although it does roughly correspond to that observed for typical arcs in our sample).
4.2 Mass Models
For the density profiles of our clusters we will adopt a simple, spherically symmetric two-component mass model. The simplicity of this model is justified by O02, who showed that the number ratio is a relatively robust quantity with respect to ellipticities in the cluster mass distribution (see § 4.3).
The adopted model comprises the DM halo of the galaxy cluster (as represented by the gNFW profile) and a luminous baryonic component, representing the central cluster galaxy. Previous work on constraining the inner DM slope through the number ratio of arcs neglected the possibly important contribution of the BCG luminous component or concluded that the effects are small (Molikawa & Hattori 2001). Given that most of the radial arcs found in our sample are buried in the halos of a bright, centrally located galaxy (or a compact group of galaxies) it seems appropriate to revisit this assumption. For example, it has been shown numerically and theoretically (Meneghetti, Bartelmann, & Moscardini 2003) that the central cluster galaxy can increase the cross section for radial gravitational arcs significantly, especially if the underlying DM halo slope is shallow.
4.2.1 Dark Component
The cluster DM halo is modeled as
| (9) |
which represents a generalization of the numerically-simulated CDM halos, where is the critical density and is a scaling factor. This density profile asymptotes to at and at . For values of , the DM density profile is identical to that found by NFW and nearly identical to that of Moore et al (1998), respectively. Using this general form for the DM halo allows for comparison to earlier numerical results, although the latest generation of DM halo simulations indicates that the DM profile may not converge to a simple asymptotic slope (e.g. Power et al. 2004; Tasitiomi et al. 2004). Basic lensing relations for the gNFW form have been presented elsewhere (e.g. Wyithe, Turner & Spergel 2001).
The profile of the DM halo is characterized further by a concentration parameter, . In this work we follow O02 and Oguri et al. (2001) in determining the critical parameters of the mean DM halo for a given mass. Following Bullock et al. (2001) in characterizing the median and scatter in concentration parameters for a given mass, we use
| (10) |
| (11) |
where
| (12) |
where the factor of generalizes the situation to (Keeton & Madau 2001). From this relation, it is possible to calculate both and for a typical halo of a given mass and inner DM density slope.
As Bullock et al. and others have found, there is significant scatter around the median value of the concentration parameter. Taking Eqn. 12 and using the Bullock et al. 1- dispersion around the median value of the concentration parameter
| (13) |
we have investigated the effect of a varying value of (Figure A Systematic Search for Gravitationally-Lensed Arcs in the Hubble Space Telescope WFPC2 Archive). As can be seen, the arc cross section ratio can vary by an order of magnitude between low and high concentration halos of the same mass and inner slope. For this reason, the dispersion in halo concentrations will be taken into account when we present our results in §5. It is important to note that the cross section ratio across concentrations is relatively constant as a function of source redshift (see § 4.4).
4.2.2 Luminous Component
Nearly all of the radial arc candidates discovered in our HST search were either buried in the halo of a central BCG or that of a compact multi-galaxy core. It thus seems reasonable to include a luminous baryonic mass component in our model. We used a Hernquist (1990) mass density profile
| (14) |
with total mass and . The Hernquist luminous density distribution is found to be a good representation of actual BCGs (see e.g. Sand et al. 2004). Throughout this work we choose =25 kpc which is a typical BCG effective radius (e.g. Gonzalez et al. 2004).
Figure A Systematic Search for Gravitationally-Lensed Arcs in the Hubble Space Telescope WFPC2 Archive illustrates the significant effect that adding a massive central galaxy can have on the arc ratio. A major degeneracy can be seen. The expected cross section ratio is similar for both a =1.0 and =1.5 DM halo if a BCG is inserted. Note again that the arc cross section ratio is a relatively constant function of the background redshift for a given mass model. We also experimented with different values for the BCG effective radius (1545 kpc) and found that the resulting number ratio varies by a factor of 5. Clearly the more precise the information on the mass of the BCG, the more useful will be the constraints on the DM profile.
4.3 Summary of Systematic Effects
Here we summarize the model assumptions which affect our subsequent analysis. The most thorough earlier investigation was by O02. Oguri considered the effect of finite source size, lens ellipticity, and mass dependence of the cluster lens.
The finite source size greatly affects the radial arc cross-section and O02 introduced an analytic formalism to correct for this. This analytic formalism reproduces well the expectation from numerical simulations and is used throughout this work. The tangential arc cross section, on the other hand, changes relatively little as a function of finite source size, particularly for the 7 condition considered here (e.g. O02; Figure 5). Accordingly, no correction was made.
Lens ellipticity primarily changes the absolute number of arcs (see also Bartelmann et al. 1995). For a minimum axis ratio of =7, the arc ratio changes only by a factor of order unity. Likewise, while changing the mass of the galaxy cluster has large consequences for the absolute number of arcs expected, the effect on the ratio of radial to tangential arcs for our minimum axial ratio is also small.
It is for these reasons that the arc ratio is an attractive statistic. No prior knowledge of the cluster mass is necessary and relatively heterogeneous samples (such as the current HST sample) may be used to find the average density profile.
Keeton (2001) studied the effect of source ellipticity on the number ratio of arcs. The basic conclusion of this work was that the ratio of radial to tangential arcs decreases with increasing source ellipticity. The size of the effect is a factor of order unity. For the purposes of the present paper where we are applying the arc number ratio test on the first observational sample of radial arcs, we will not consider the effects of source ellipticity.
4.4 The arc number ratio
Thus far we have presented predictions in terms of the ratio of arc cross sections and we now take the final step towards a comparison with the observations by determining the number ratio. To do this, for a given mass, inner DM slope, concentration parameter and redshift, it is necessary to integrate the product of the cross section and the number density of galaxies over some range in background (source) redshift.
Since the arc cross section ratio is largely independent of source redshift (see Figs. A Systematic Search for Gravitationally-Lensed Arcs in the Hubble Space Telescope WFPC2 Archive and A Systematic Search for Gravitationally-Lensed Arcs in the Hubble Space Telescope WFPC2 Archive), the expected number ratio of radial to tangential arcs should be well-represented by the ratio of their cross sections, for a given halo model. Moreover, the ratio is also fairly insensitive to the mass of the underlying galaxy cluster. Therefore, with a single reasonable fiducial model of fixed mass, lens redshift and source redshift we can obtain constraints on the DM inner slope for the average galaxy cluster in our sample.
It is not clear whether magnification bias will be significant in our survey. Our visually-based search method is not likely to be flux-limited; it is largely the persistence of a relatively high contiguous surface brightness signal that is noticed by a human searcher. As lensing conserves surface brightness, our arc search should not be unduly affected by magnification bias. Miralda-Escude (1993) discusses the possible magnification bias in arc searches and notes these may be significant in data affected by ground-based seeing. Given the improved point spread function of HST, it seems safe to conclude that our search for resolved arcs is effectively surface brightness limited.
5 Results
In this section we compare the observed arc number ratio with theoretical predictions based on the methodology presented in § 4 and derive the first statistical constraints on the inner slope of the DM distribution. We discuss the remaining sources of observational error and review the prospects for reducing their effect.
5.1 Constraints on the inner DM slope and the role of the BCG
Taking the formalism presented in §4, we now calculate the expected number ratio of radial to tangential arcs as a function of the DM inner slope, , for a two-component mass model. We assume a fiducial model representing the typical galaxy cluster in our sample with =1 at =0.2 and a background at =1.4. As discussed, we used the background size distribution from Ferguson et al. in order to calculate the radial arc cross section. We re-evaluate the concentration parameter , according to Eqs. 11 and 12 at each value of .
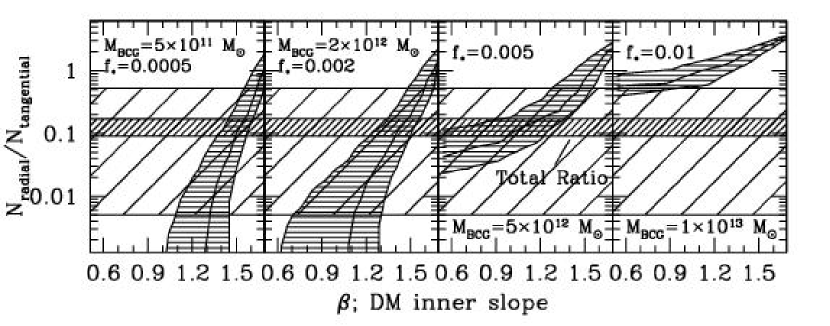
We present our constraints on the inner DM slope, , in Fig. 3. The two horizontal hatched bands represent two estimates of the uncertainty in our measured radial to tangential arc number ratio. The inner, tightly hatched band represents the 68% confidence limit on the ratio across the total, heterogenous, archival sample. The outer horizontal band represents the maximum range of the 68% confidence regions amongst the cluster subsamples presented in § 2.1 (see Table 2). Although this enlarged region may not take into account possible systematics associated with identifying arcs in each sub-sample, it probably gives a reasonably cautious upper limit on the uncertainties in the number ratio. The other, diagonally oriented band (with horizontal hatches) in each panel shows the predicted values of the number ratio for our fiducial cluster, taking into account the expected 1- dispersion of the concentration parameter according to Eq. 13, given different BCG masses.
The various panels in Fig. 3 represent different assumed values for the mean stellar mass of the BCG, recognizing that this is a key variable. The left two panels span the range of stellar masses (510 21012) derived by quantitative dynamical and photometric analysis in the sample studied by Sand et al (2004). The right-most two panels represent more extreme stellar masses, the third (510) being within the likely range, and the fourth (110) somewhat extreme. Also noted in the panels of Fig. 3 is the BCG to DM mass fraction, , which is an alternative way to parameterize the importance of the BCG for calculating the arc number ratio.
Depending on the mean BCG stellar mass, very different conclusions can be drawn about the DM profile. If the Sand et al (2004) sample is representative of the archive sample discussed here, the constraints on the inner DM slope are reasonably tight with for the total sample (and for the range spanned by the individual subsamples). In this case, it would be reasonable to conclude the sample is consistent with both NFW and the Moore profiles given the uncertainties. However, if typical BCG masses are as high as 5 we can only constrain the dark matter density profile to have 1.3 (1.6 for the subsamples). If the mean BCG mass were as as high as , then no acceptable solutions would be found unless the true ratio of radial to tangential arcs was at the upper end of the range of observed values.
Even if precise stellar masses for each BCG were available, it is important to probe the sensitivity to the cluster properties. We thus explored the effect on of changing the fiducial cluster model, namely one with =1 at =0.2. In fact, reducing the cluster mass to =5 or changing the redshift to =0.5 produces only a marginal change in the acceptable values of , illustrating again that the arc number ratio is a robust tool if the BCG parameters can be constrained.
5.2 Additional uncertainties and sample selection effects
Of the uncertainties discussed earlier, those relating to the identification and characterization of the radial arcs through galaxy subtraction would lead to an underestimate of their true number (and hence the radial to tangential number ratio), while contamination from non-lensed radially oriented objects would work in the opposite direction. Remarkably, the total number of radial arcs would need to change by nearly an order of magnitude for our conclusions on to be significantly altered. This, we believe, is highly unlikely given the tests we have performed.
For the tangential arcs, contamination may arise from chance alignment of elongated foreground objects or tidal debris associated with galaxies merging with the BCG. Spectroscopic identification of a large sample of arcs would be necessary to understand this contamination rate in detail. However, none of the tangential arcs identified in HST imaging and targeted in our Keck spectoscopic program have turned out to be spurious. It seems safe to conclude that the contamination rate is very low. As mentioned in § 3.1, the tangential arcs found independently by two of the authors disagreed only at the 10% level providing an estimate of the noise associated with visual identifications.
A further uncertainty related to our mass modeling technique is that arising from cluster substructure. In common with previous studies, the modeling framework presented in §4 assumes that clusters comprise a single central DM halo spatially coincident with the BCG. However, Smith et al. (2005) show that 70% of X–ray luminous cores in their sample (Table 3) are unrelaxed with –60% of the mass in structures not spatially coincident with the BCG.
We explore the implications of possible substructure using the Smith sample. Interestingly, the radial to tangential arc ratio in the Smith sample is lower than for the other cluster samples which may arise from the substructure issues noted above. To improve the statistics, we also considered the larger Edge sample which was selected to be dominated by relaxed systems (Edge, priv. comm. see § 2.1). Contrasting the Edge (predominantly relaxed) and Smith (predominantly unrelaxed) samples, we find the ratio = and = , differing at the – level.
Conceivably, is depressed relative to by the substructure present in the Smith clusters. This idea is supported by numerical simulations (Jing 2001) which show that DM halos in equilibrium (relaxed) have higher typical concentrations than DM halos out of equilibrium (unrelaxed). If true, this would naturally explain the different arc ratios seen in the Smith and Edge samples, since higher concentration halos yield higher arc number ratios (see Fig A Systematic Search for Gravitationally-Lensed Arcs in the Hubble Space Telescope WFPC2 Archive). In this respect, the scatter between the subsamples, as indicated in Fig. 3, may be a reasonable measure of the effects of substructure.
This can also be understood in terms of lensing cross-sections (see similar argument in Molikawa & Hattori 2001). Introducing irregularities (substructure) into a cluster mass distribution generally increases the shear, . Since the tangential critical line forms where , increasing pushes the tangential arcs towards regions with lower , i.e. further from the center of the cluster, and thus the cross-section to tangential arc formation increases. The effect works in the opposite sense for radial arcs, which form where . Additional shear shifts radial arcs toward regions with higher , i.e. closer to the center of the cluster and thus reduces the cross-section to radial arc formation. Therefore clusters with significant substructure are expected to display a lower arc number ratio than clusters that are more axisymmetric with little substructure.
It will be important to quantify this effect more rigorously in future experiments that combine BCG mass estimates with arc number ratio measurements. A key aspect of such work would be to study a large, well–defined sample of clusters (of order ) for which both homogeneous HST data and reliable cluster substructure diagnostics are available.
6 Summary and Prospects
In this work we have undertaken a systematic search for gravitational arcs in the HST/WFPC2 cluster archive. Since we digitally subtracted bright cluster galaxies, this is the first arc survey which is sensitive to radial gravitational arcs. Using this unique data set, we have attempted to place constraints on the inner DM density slope, , for this sample of clusters.
The main results of the paper can be summarized as follows:
1. A careful search of the 128 galaxy clusters reveals 12 radial and 104 tangential arc candidates with a length-width ratio 7.
2. Taking the entire sample of galaxy clusters, we have constructed 3 smaller subsamples: two based on X-ray properties and one with a roughly uniform optical imaging depth. The arc number ratio is roughly consistent across all three samples and confirms the hypothesis that the radial to tangential arc number ratio is a relatively robust statistic with respect to intrinsic cluster properties.
3. Employing an analysis similar to that of O02, but with the important addition of a BCG mass component, we have found that the observed arc number ratio is consistent with a wide range of DM inner slopes (), depending on the assumed BCG mass.
The archive sample presented in this paper has illustrated a potentially powerful method of constraining the profile of dark matter in clusters. Although statistical in nature, as with all gravitational lensing techniques, some assumptions are necessary. We have argued that the ratio of the abundance of radial and tangential arcs minimizes many of these leaving the mass of the baryon-dominated BCG, cluster substructure and sample uniformity as the key issues. All of these are, in principle, tractable problems given sufficient data. We thus remain optimistic that a valuable constraint on the distribution of DM slopes can be derived via the methods described in this paper given adequate observational effort.
Appendix A The cluster catalog
Here we present our HST/WFPC2 cluster catalog used to identify gravitational arcs. The criteria for being included in the sample are detailed in § 2. For each cluster entry, the redshift, RA & DEC, exposure time, filter, and X-ray luminosity are listed. If the cluster is associated with one of the three cluster subsamples present in § 2.1, this is noted as well. A cluster is flagged if it has an associated arc which is presented in Table A Systematic Search for Gravitationally-Lensed Arcs in the Hubble Space Telescope WFPC2 Archive. The cluster RA & DEC are taken from the HST world coordinate system directly at approximately the position of the BCG.
Appendix B The arc catalog
Here we present the gravitational arc catalog derived from Table 3. For each arc, the redshift (if available), magnitude, filter, length to width ratio, and offset from the BCG are presented. Also noted is whether or not the arc is radial or tangential. For the tangential arcs, only those with a 7 are listed, unless they have a spectroscopic redshift. For the radial arcs, all candidates are listed without regard to their value. Note that only those arcs with a 7 are included in the analysis presented in § 5. If possible, the arc nomenclature from previous work has been adopted. Otherwise, an arc is labeled with the prefix ’A’ followed by a sequential number. Those arcs whose photometry and measured have possibly been affected by poor galaxy subtraction are flagged (see discussion in § 3.2 & 3.3).
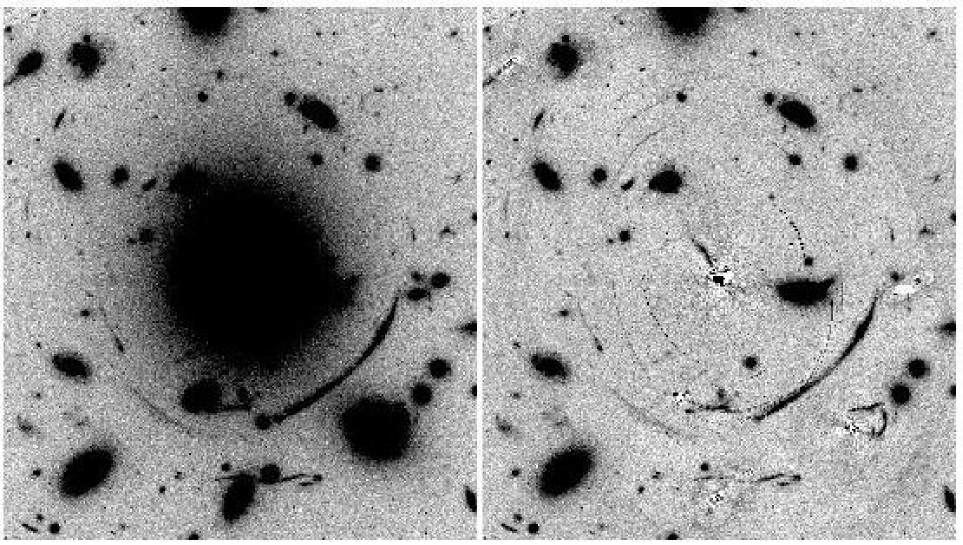
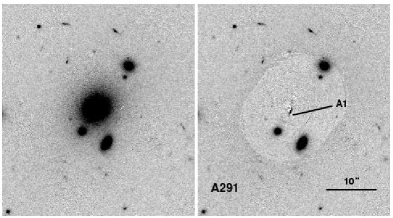
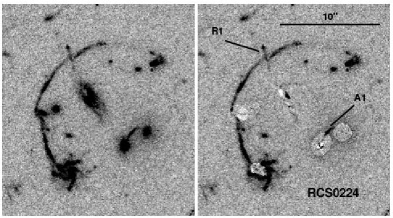
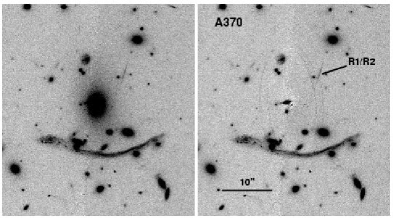
Appendix C Radial Arc Finding Charts
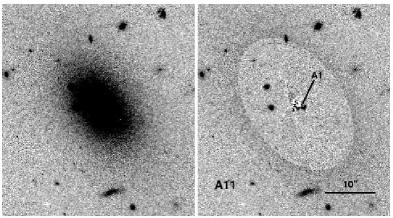
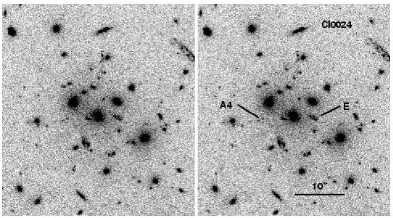
Here we present finding charts for all clusters with candidate radial arcs, whether or not the arc has a 7. For each chart, the left panel is of the original image, while the right panel is the BCG-subtracted image from which the radial arc was identified, along with a label corresponding to that presented in Table A Systematic Search for Gravitationally-Lensed Arcs in the Hubble Space Telescope WFPC2 Archive. Note that for Cl0024 and A1689, no bright galaxies were removed in the finding chart. Two finding charts are presented for MS0451 since one of the radial arcs (A6) is associated with a bright elliptical away from the cluster center. No finding charts were made of tangential arc candidates, although offsets from the BCG are listed in Table A Systematic Search for Gravitationally-Lensed Arcs in the Hubble Space Telescope WFPC2 Archive. North is up and east is always towards the left hand side of the page.
References
- Allen (1996) Allen, S.W., Fabian, A.C., & Kneib, J.-P. 1996, MNRAS, 279, 615
- Bartelmann (1994) Bartelmann, M., & Weiss, A. 1994, A&A, 287, 1
- Bartelmann et al. (1995) Bartelmann, M., Steinmetz, M., & Weiss, A. 1995, A&A, 297, 1
- Bartelmann (1996) Bartelmann, M. 1996, A&A, 313, 697
- Bartelmann (1998) Bartelmann, M., Huss, A., Colberg, J.M., Jenkin, A., &, Pearce, F.R. 1998, A&A, 330, 1
- Bertin (1996) Bertin, E., & Arnouts, S. 1996, A&AS, 117, 393
- Bezecourt (1999) Bezecourt, J., Kneib, J.-P., Soucail, G., & Ebbels, T.M.D. 1999, A&A, 347, 21
- Borys et al. (2004) Borys, C., Chapman, S., Donahue, M., Fahlman, G., Halpern, M., Kneib, J.-P., Newbury, P., Scott, D. & Smith, G.P., 2004, MNRAS, 352, 759
- Broadhurst et al. (2000) Broadhurst, T., Huang, X., Frye, B., Ellis, R., 2000, ApJ, 534, 15L
- Bullock et al. (2001) Bullock, J. S., Kolatt T. S., Sigad, Y., Somerville, R. S., Kravtsov, A. V., Klypin, A. A., Primack, J. R., & Dekel, A. 2001, MNRAS, 321, 598
- Buote (2004) Buote, D.A., & Lewis, A.D., 2004, ApJ, 604, 116
- Crawford et al. (1999) Crawford, C.S., Allen, S.W., Ebeling, H., Edge, A.C., & Fabian, A.C. 1999, MNRAS, 306, 857
- Campusano et al. (2001) Campusano, L.E., Pello, R., Kneib, J.-P., Le Borgne, J.-F., Fort, B., Ellis, R., Mellier, Y., & Smail, I. 2001, A&A, 378, 394
- Dahle et al. (2003) Dahle, H., Hannestad, S., Sommer-Larsen, J., 2003, ApJ, 588, L73
- Dalal et al. (2004) Dalal, N., Holder, G., & Hennawi, J.F., 2004, ApJ, 609, 50
- Dalal et al. (2004) Dalal, N., Hennawi, J.F., & Bode 2004, ApJsubmitted, arXiv:astro-ph/0409028
- Diemand et al. (2004) Diemand, J., Moore, B., & Stadel, J., 2004, MNRAS, 353, 624
- Ebbels et al. (1998) Ebbels, T., Ellis, R., Kneib, J.-P., Leborgne, J.-F., Pello, R., Smail, I., & Sanahuja, B. 1998, MNRAS, 295, 75
- Ebeling et al. (1996) Ebeling, H., Voges, W., Bohringer, H., Edge, A. C., Huchra, J.P., &, Briel, U.G. 1996, MNRAS, 281, 799
- Edge et al. (2003) Edge, A.C., Smith, G.P., Sand, D.J, Treu, T., Ebeling, H., Allen, S.W., & van Dokkum, P.G. 2003, ApJ, 599, 69
- Ellis et al. (2001) Ellis, R., Santos, M.R., Kneib, J.-P., & Kuijken, K. 2001, ApJ, 560, L119
- Ellis et al. (1991) Ellis, R., Allington-Smith, J., Smail, I. 1991, MNRAS, 249, 184
- Ferguson et al. (2004) Ferguson, H.C. et al., 2004, ApJ, 600, 107L
- Flores et al. (2000) Flores, R.A., Maller, A.H., & Primack, J.R. 2000, ApJ, 535, 555
- Fort et al. (1992) Fort, B., Le Fevre, O., Hammer, F., & Cailloux, M. 1992, ApJ, 399, L125
- Franx et al. (1997) Franx, M., Illingworth, G.D., Kelson, D.D., van Dokkum, P., & Tran, K-V. ApJ, 486, L75
- Fruchter (2002) Fruchter, A. S., & Hook, R. N. 2002, PASP, 114, 14
- Frye (1998) Frye, B. & Broadhurst, T., 1998, ApJ, 499, 115
- Fukushige (2003) Fukushige, T., Kawai, A., Makino, J. 2003, ApJ, 588, 674
- Gavazzi et al. (2003) Gavazzi, R., Fort, B., Mellier, Y., Pelló, R., Dantel-Fort, M. 2003, A&A, 403, 11
- Gehrels (1986) Gehrels, N. 1986, ApJ, 303, 336
- Gerhard et al. (2001) Gerhard, O., Kronawitter, A., Saglia, R. P., & Bender, R. 2001, AJ, 121, 1936
- Ghigna et al. (2000) Ghigna, S., Moore, B., Governato,F., Lake, G., Quinn, T., & Stadel, J. 2000, ApJ, 544, 616
- Gioia et al. (1998) Gioia, I.M., Shaya, E.J., Le Fevre, O., Falco, E.E., Luppino, G.A., & Hammer, F. 1998, ApJ, 497, 573
- Gladders et al. (2002) Gladders, M.D., Yee, H.K.C., & Ellingson, E. 2002, AJ, 123, 1
- Gladders et al. (2003) Gladders, M.D., Hoekstra, H., Yee, H.K.C., Hall, P.B., & Barrientos, L.F. 2003, ApJ, 593, 48
- Gonzalez et al. (2004) Gonzalez, A.H., Zabludoff, A.I., & Zaritsky, D. 2004, ApJaccepted, astro-ph/0406244
- Hattori (1997) Hattori, M., Watanabe, K., & Yamashita, K. 1997, A&A, 319, 764
- Hernquist (1990) Hernquist, L. 1990, ApJ, 356, 359
- Holden et al. (2001) Holden, B.P., Stanford, S.A., Rosati, P., Squires, G., Tozzi, P., Fosbury, R.A.E., Papovich, C., & Eisenhardt, P. 2001, AJ, 122, 629
- Jaffe (1983) Jaffe, W. 1983, MNRAS, 202, 995
- Keeton (2001) Keeton, C.R. 2001, ApJ, 562, 160
- Keeton Madau (2001) Keeton, C.R. & Madau, P. 2001, ApJ, 549, 25L
- Kelson et al. (2002) Kelson, D., Zabludoff, A., Williams, K., Trager, S., Mulchaey, J., & Bolte, M. 2002, ApJ, 576, 720
- Kneib et al. (1996) Kneib, J.-P., Ellis, R.S., Smail, I., Couch, W.J., & Sharples, R.M. 1996, ApJ, 471, 643
- Kneib et al. (2003) Kneib, J.-P., et al., 2003 ApJ, 598, 804
- Kneib et al. (2004) Kneib, J.-P., Ellis, R.S., Santos, M.R., & Richard, J., 2004 ApJ, 607, 697
- Kronawitter (2000) Kronawitter, A., Saglia, R.P., Gerhard, O., & Bender, R. 2000, A&AS, 144, 53
- (49) Le Fevre, O., Hammer, F., Angonin, M.C., Gioia, M., & Luppino, G.A., 1994 ApJ, 422, L5
- (50) Lemoine-Busserolle, M., Contini, T., Pello, R., Le Borgne, J.-F., Kneib, J.-P., & Lidman, C. 2003 A&A, 397, 839
- (51) Lokas, E.L. & Mamon, G.A., 2003 MNRAS, 343, 401
- (52) Luppino, G.A., Gioia, I.M., Hammer, F., Le Fevre, O., Annis, J.A. , 1999, A&AS, 136, 117
- Mahdavi (2004) Mahdavi, A. & Geller, M.J. 2004, ApJ, 607, 202
- Mellier et al. (1991) Mellier, Y., Fort, B., Soucail, G., Mathez, G., & Cailloux, M 1991, ApJ, 407, 33
- Mellier et al. (1993) Mellier, Y., Fort, B., & Kneib, J. 1993, ApJ, 407, 33
- Meneghetti et al. (2001) Meneghetti, M., Yoshida, N., Bartelmann, M., Moscardini, L., Springel, V., Tormen, G., & White, S.D.M. 2001, MNRAS, 325, 435
- Meneghetti et al. (2003) Meneghetti, M., Bartelmann, M., & Moscardini, L., 2003, MNRAS, 346, 67
- Meneghetti et al. (2004) Meneghetti, M., Jain, B., Bartelmann, M., & Dolag, K. 2004, MNRASsubmitted, arXiv:astro-ph/0409030
- Miralde-Escudé (1995) Miralde-Escudé, J. 1995, ApJ, 438, 514
- Miralde-Escudé (1993) Miralde-Escudé, J. 1993, ApJ, 403, 509
- Molikawa (2001) Molikawa, K., & Hattori, M. 2001, ApJ, 559, 544
- Moore et al. (1998) Moore, B., Governato, F., Quinn, T., Stadel, J. & Lake, G. 1998, ApJ, 499, L5
- Navarro et al. (1997) Navarro, J., Frenk, C. S., & White S. D. M 1997, ApJ, 490, 493
- Oguri et al. (2001) Oguri, M., Taruya, A., & Suto, Y. 2001, ApJ, 559, 572 (O02)
- Oguri (2002) Oguri, M., 2002, ApJ, 573, 51 (O02)
- Oguri et al. (2003) Oguri, M., Lee, J., & Suto, Y. 2003, ApJ, 599, 7
- Pello et al. (1992) Pello, R., Le Borgne, J.F., Sanahuja, B., Mathez, G., & Fort, B., 1992, A&A, 266, 6
- Pello et al. (1999) Pello, R., Kneib, J.-P., Le Borgne, J.F., Bezecourt, J., Ebbels, T.M., Tijera, I., Bruzual, G., Miralles, J.M., Smail, I., Soucail, G., & Bridges, T.J., 2000, ApJ, 528, 96
- Pettini et al. (2000) Pettini, M., Steidel, C.C., Adelberger, K.L., Dickinson, M., Giavalisco, M. 2000, ApJ, 528, 96
- Power et al. (2003) Power, C., Navarro, J. F., Jenkins, A., Frenk, C. S., White, S. D. M., Springel, V., Stadel, J., & Quinn, T. 2003, MNRAS, 338, L14
- Sand et al. (2002) Sand, D. J., Treu, T., & Ellis, R. S. 2002, ApJ, 574, L129
- Sand et al. (2004) Sand, D. J., Treu, T., Smith, G.P., & Ellis, R. S. 2004, ApJ, 604, 88
- Santos et al. (2004) Santos, M.R., Ellis, R.S., Kneib, J.-P., Richard, J., & Kuijken, K., 2004, ApJ, 606, 683
- Schneider et al. (1992) Schneider, P., Ehlers, J. & Falco, E. E. 1992, Gravitational Lenses, Springer-Verlag, Berlin.
- Schlegel (1998) Schlegel, D. J., Finkbeiner, D. P., & Davis, M. 2000, ApJ, 500, 525
- Seitz (1998) Seitz, S., Saglia, R.P., Bender, R., Hopp, U., Belloni, P., & Ziegler, B., 1998, MNRAS, 298, 945
- Sheinis et al. (2002) Sheinis, A. I., et al. 2002, PASP,in press, astro-ph/0204297
- Smail et al. (1995) Smail, I., Couch, W.J., Ellis, R.S., Sharples, R.M. 1995, ApJ, 440, 501
- Smail et al. (1996) Smail, I., Dressler, A., Kneib, J-P., Ellis, R.S., Couch, W.J., Sharples, R.M., Oemler, A. 1996, ApJ, 469, 508
- Smith et al. (2001) Smith, G. P., Kneib, J.-P., Ebeling, H., Czoske, O., & Smail, I. R. 2001, ApJ, 552, 493
- Smith et al. (2002) Smith, G. P., Smail, I. R., Kneib, J.-P., Davis, C.J., Takamiya, M., Ebeling, H., & Czoske, O., 2002, MNRAS, 333, L16
- Smith et al. (2002) Smith, G. P., Smail, I. R., Kneib, J.-P., Czoske, O., Ebeling, H., Edge, A.C., Pello, R., Ivison, R.J., Packham, C., & Le Borgne, J.-F., 2002, MNRAS, 330, 11
- Smith et al. (2003) Smith, G. P., Edge, A.C., Eke, V.R., Nichol, R.C., Smail, I., Kneib, J.-P., 2003, ApJ, 590, L79
- Smith et al. (2004) Smith, G. P., Kneib, J.-P., Smail, I., Mazzotta, P., Ebeling, H., Czoske, O. 2004, MNRASsubmitted, arXiv:astro-ph/0403588
- Soucail et al. (1988) Soucail, G., Mellier, Y., Fort, B., Mathez, G., Cailloux, M., 1988, A&A, 191, 19
- Swinbank et al. (2004) Swinbank, A.M., et al. 2004, ApJ, 598, 162
- Tasitiomi et al. (2003) Tasitsiomi, A., Kravtsov, A. V., Gottloeber, S., Klypin, A. A. 2004, ApJ, 607, 125
- Torri et al. (2004) Torri, E., Meneghetti, M., Bartelmann, M., Moscardini, L., Rasia, E., & Tormen, G., 2004, MNRAS, 349, 476
- Tran et al. (2005) Tran, K., van Dokkum, P., Illingworth, G. D., Kelson, D., Gonzalez, A., & Franx, M., 2004, ApJ619, 134
- van Dokkum (2001) van Dokkum, P.G. 2001, PASP, 113, 1420
- van der Marel (2000) van der Marel, R.P., Magorrian, J., Carlberg, R.G., Yee, H.K.C., & Ellingson, E. 2000, AJ, 119, 2038
- Wambsganss et al. (2004) Wambsganss, J., Bode, P., Ostriker, J.P. 2004, ApJ, 606, L93
- Williams et al. (1999) Williams, L., Navarro, J., & Bartelmann, M. 1999, ApJ, 527, 535
- Wu (2000) Wu, X. 2000, MNRAS, 316, 299
- Wyithe (2001) Wyithe, J. S.B., Turner, E. L., Spergel, D. N. 2001, ApJ, 555, 504
- Yee et al. (1996) Yee, H.K.C., Ellingson, E., Bechtold, J., Carlberg, R.G., Cuillandre, J.-C., 1996, AJ, 111, 1783
- Zaritsky (2003) Zaritsky, D., & Gonzalez, A.H., 2003, ApJ, 584, 691
![[Uncaptioned image]](/html/astro-ph/0502528/assets/x1.png)
Histogram illustrating the number of clusters in the sample as a function of redshift.
![[Uncaptioned image]](/html/astro-ph/0502528/assets/x10.png)
An illustration of how the tangential arc cross section is found with a NFW () profile at z=0.3 with a background at z=1.0. The x and y positions corresponding to a tangentially oriented axis ratio () greater than 7. The value of or with the largest absolute value is used in Eqn. 8 for calculating the cross-section.
![[Uncaptioned image]](/html/astro-ph/0502528/assets/x11.png)
The radial arc cross section as a function of source size. Shown are models with in DM with profile slopes =1.5 and various reasonable BCG masses included. The lens redshift is at and the background redshift is at . See § 4.2 for a description of the mass models used. Given the strong radial arc cross section dependence, we adopt the z1.4 size distribution of Ferguson et al. (2004) taken from the GOODS fields.
![[Uncaptioned image]](/html/astro-ph/0502528/assets/x12.png)
The radial to tangential cross section ratio as a function of background source redshift while varying the concentration parameter of the DM halo by 1- as prescribed by Bullock et al. 2001. Shown are models with in DM with =1.5 at a lens redshift . The assumed radial arc source size distribution is that found by Ferguson et al. Note that the cross section ratio is relatively constant as a function of background source redshift.
![[Uncaptioned image]](/html/astro-ph/0502528/assets/x13.png)
The radial to tangential arc cross section ratio as a function of background source redshift while varying the BCG mass and inner slope of the DM profile. The assumed radial arc source size distribution is that found by Ferguson et al. which we assumed stays constant throughout the relevant source redshift range. Shown are models with in DM at a lens redshift . Note that the =1.0 and =1.5 models with a BCG have expected arc number ratios within a factor of few of each other.
| Cluster | Date | Target | Instrument | Exposure | Redshift | Notes |
|---|---|---|---|---|---|---|
| time (ks) | ||||||
| Abell 2259 | July 27, 2001 | Tan Arc | ESI | 7.2 | 1.477 | Arc A1 |
| MS 1455 | July 27, 2001 | Rad Arc Cand | ESI | 4.5 | - | Not lensed |
| Abell 370 | Oct 19, 2001 | Rad Arc | LRIS | 7.2 | - | No detection |
| Abell 1835 | April 11, 2002 | Rad Arc | ESI | 1.8 | - | No detection |
| Abell 963 | Nov 22, 2003 | Tan Arc | LRIS | 7.2 | 1.958 | Arc H1 |
| GC0848+44 | Feb 22, 2004 | Rad Arc | LRIS | 3.0 | - | Faint Cont. |
| Abell 773 | Feb 22, 2004 | Tan Arc | LRIS | 5.4 | 1.114 | Arc F11 |
| GC 1444 | July 19, 2004 | Rad Arc | ESI | 7.2 | 1.151 | Arc A1 |
| 3c435a | July 19, 2004 | Rad Arc Cand | ESI | 5.4 | - | Not lensed |
| Abell 2667 | July 19, 2004 | Rad Arc Cand | ESI | 3.6 | - | Not lensed |
| Abell 2667 | July 19, 2004 | Tan Arc | ESI | 3.6 | 1.034 | Arc A1 |
| AC 118 | July 19,20, 2004 | 2 Rad Arc | ESI | 4.6/7.2 | - | Faint Cont. |
| MS 0440 | Dec 12, 2004 | Rad Arc | LRIS | 5.4 | - | No detection; arc A17 |
| IRAS 0910 | Dec 12, 2004 | Rad Arc | LRIS | 0.6 | - | Not lensed |
| 3c220 | Dec 12, 2004 | Rad Arc | LRIS | 2.4 | - | Not lensed |
| R0451 | Dec 13, 2004 | Tan Arc | LRIS | 3.6 | 2.007 | Arc A1 |
| RCS0224 | Dec 13, 2004 | Rad Arc | LRIS | 5.4 | 1.050 | Arc R1 |
| Cluster | No. of | Tangential | Radial | Ratio R/T | 68% Confidence Range |
|---|---|---|---|---|---|
| Sample | Clusters | ||||
| Edge | 44 | 15 | 4 | 0.27 | 0.13-0.53 |
| Smith | 10 | 38 | 1 | 0.03 | 0.005-0.09 |
| EMSS | 12 | 13 | 2 | 0.15 | 0.05-0.40 |
| Total | 128 | 104 | 12 | 0.12 | 0.08-0.16 |
| Cluster | PID | Exp. | Filter | Cluster | |||
|---|---|---|---|---|---|---|---|
| (J2000.0) | (J2000.0) | time (ks) | Sample | ||||
| A11††Cluster has a radial arc candidate | 8719 | 0.166 | 00 12 33.9 | -16 28 06.9 | 0.8 | 606 | 1 |
| AC118††Cluster has a radial arc candidate | 5701 | 0.308 | 00 14 20.6 | -30 24 01.5 | 6.5 | 702 | .. |
| MS0016 | 5378 | 0.541 | 00 18 33.6 | +16 26 16.0 | 12.6/16.8 | 555/814 | 3 |
| Cl0024††Cluster has a radial arc candidate‡‡Cluster has a tangential arc candidate with | 5453 | 0.39 | 00 26 35.5 | +17 09 50.7 | 23.4/19.8 | 450/814 | .. |
| A68‡‡Cluster has a tangential arc candidate with | 8249 | 0.255 | 00 37 06.8 | +09 09 23.4 | 7.5 | 702 | 2 |
| 3c16 | 6675 | 0.405 | 00 37 45.4 | +13 20 09.8 | 7.1 | 702 | .. |
| GC0054‡‡Cluster has a tangential arc candidate with | 5378 | 0.560 | 00 56 56.9 | -27 40 29.6 | 12.6/16.8 | 555/814 | .. |
| PKS0101 | 6675 | 0.390 | 01 04 24.1 | +02 39 43.4 | 7.5 | 702 | .. |
| A209‡‡Cluster has a tangential arc candidate with | 8249 | 0.206 | 01 31 52.6 | -13 36 40.8 | 7.8 | 702 | 2 |
| A267‡‡Cluster has a tangential arc candidate with | 8249 | 0.230 | 01 52 41.9 | +01 00 25.9 | 7.5 | 702 | 2 |
| A291††Cluster has a radial arc candidate | 8301 | 0.196 | 2 01 39.90 | -02 11 39.7 | 0.8 | 606 | 1 |
| GC0210 | 8131 | 0.270 | 02 10 26.0 | -39 29 42.9 | 7.8 | 702 | .. |
| 5c6.124‡‡Cluster has a tangential arc candidate with | 6675 | 0.448 | 02 16 40.9 | +32 50 47.1 | 10.4 | 702 | .. |
| RCS0224††Cluster has a radial arc candidate‡‡Cluster has a tangential arc candidate with | 9135 | 0.77 | 02 24 30.82 | -00 02 27.8 | 13.2/6.6 | 606/814 | .. |
| GC0231 | 6000 | 0.607 | 02 31 42.7 | +00 48 41.0 | 15.3 | 606 | .. |
| A370††Cluster has a radial arc candidate‡‡Cluster has a tangential arc candidate with | 6003 | 0.375 | 02 39 53.1 | -01 34 54.8 | 5.6 | 675 | .. |
| A383††Cluster has a radial arc candidate‡‡Cluster has a tangential arc candidate with | 8249 | 0.189 | 02 48 03.3 | -03 31 44.4 | 7.5 | 702 | 2 |
| GC030518 | 5991 | 0.42 | 03 05 18.1 | +17 28 24.9 | 2.1/2.4 | 606/814 | 3 |
| GC03053‡‡Cluster has a tangential arc candidate with | 5991 | 0.43 | 3 05 31.6 | +17 10 03.1 | 2.1/2.4 | 606/814 | 3 |
| GC0303 | 5378 | 0.420 | 03 06 19.0 | +17 18 49.6 | 12.6 | 702 | .. |
| Cl0317 | 7293 | 0.583 | 03 20 00.8 | +15 31 50.1 | 2.6/2.5 | 555/814 | .. |
| GC0329 | 8131 | 0.45 | 03 29 02.8 | +02 56 23.3 | 10.4 | 702 | .. |
| GC0337 | 7374 | 0.59 | 03 37 45.1 | -25 22 35.8 | 11.0 | 702 | .. |
| GC0341 | 8131 | 0.44 | 03 41 59.1 | -44 59 58.3 | 11.2 | 702 | .. |
| GC0412 | 5378 | 0.51 | 04 12 52.1 | -65 50 48.5 | 12.6/14.7 | 555/814 | .. |
| RXJ0439‡‡Cluster has a tangential arc candidate with | 8719 | 0.245 | 04 39 00.5 | +07 16 09.5 | 04.1 | 606 | 1 |
| MS0440††Cluster has a radial arc candidate‡‡Cluster has a tangential arc candidate with | 5402 | 0.190 | 04 43 09.7 | +02 10 19.5 | 22.2 | 702 | 3 |
| RXJ0451‡‡Cluster has a tangential arc candidate with | 8719 | 0.430 | 04 51 54.6 | +00 06 19.3 | 1.0 | 606 | 1 |
| MS0451††Cluster has a radial arc candidate‡‡Cluster has a tangential arc candidate with | 5987 | 0.55 | 04 54 10.6 | -03 00 50.7 | 10.4 | 702 | 3 |
| GC0720 | 7374 | 0.268 | 07 20 17.8 | +71 32 13.4 | 4.8 | 702 | .. |
| GC072056 | 8131 | 0.230 | 07 20 53.8 | +71 08 59.3 | 5.2 | 702 | .. |
| A586 | 8301 | 0.170 | 07 32 20.3 | +31 38 00.1 | 0.8 | 606 | 1 |
| PKS0745‡‡Cluster has a tangential arc candidate with | 7337 | 0.103 | 07 47 31.3 | -19 17 40.0 | 2.1/1.8 | 555/814 | .. |
| GC0818 | 8325 | 0.260 | 08 18 57.3 | +56 54 24.5 | 7.2 | 702 | .. |
| GC0819 | 8325 | 0.226 | 08 19 18.3 | +70 55 04.6 | 6.9 | 702 | .. |
| RXJ0821 | 8301 | 0.109 | 08 21 02.3 | +07 51 47.3 | 0.6 | 606 | 1 |
| A646 | 8301 | 0.127 | 08 22 09.6 | +47 05 52.5 | 0.6 | 606 | 1 |
| 4c+55‡‡Cluster has a tangential arc candidate with | 8719 | 0.242 | 08 34 54.9 | +55 34 21.3 | 1.0 | 606 | 1 |
| GC0841+64 | 7374 | 0.342 | 08 41 07.6 | +64 22 25.7 | 7.2 | 702 | .. |
| GC0841 | 8325 | 0.235 | 08 41 44.1 | +70 46 53.2 | 6.9 | 702 | .. |
| A697‡‡Cluster has a tangential arc candidate with | 8301 | 0.282 | 08 42 57.6 | +36 21 59.1 | 1.0 | 606 | 1 |
| GC0848††Cluster has a radial arc candidate | 7374 | 0.570 | 08 48 48.0 | +44 56 16.7 | 12.0 | 702 | .. |
| GC0848N‡‡Cluster has a tangential arc candidate with | 7374 | 0.543 | 08 48 49.3 | +44 55 48.2 | 12.0 | 702 | .. |
| GC0849 | 8325 | 0.240 | 08 49 10.8 | +37 31 08.1 | 7.8 | 702 | .. |
| Z2089 | 8301 | 0.235 | 09 00 36.8 | +20 53 39.6 | 1.0 | 606 | 1 |
| 3c215 | 5988 | 0.411 | 09 06 31.8 | +16 46 11.7 | 7.8/5.0 | 555/814 | .. |
| RXJ0911 | 8705 | 0.77 | 09 11 26.5 | +05 50 14.5 | 12.5/12.5 | 606/814 | .. |
| IRAS0910 | 6443 | 0.442 | 09 13 45.5 | +40 56 27.9 | 4.34 | 814 | .. |
| A773‡‡Cluster has a tangential arc candidate with ††Cluster has a radial arc candidate | 8249 | 0.217 | 09 17 53.5 | +51 44 1.0 | 7.2 | 702 | 2 |
| A795 | 8301 | 0.136 | 09 24 05.3 | +14 10 21.0 | 0.6 | 606 | 1 |
| 3c220‡‡Cluster has a tangential arc candidate with | 6778 | 0.620 | 09 32 40.1 | +79 06 28.9 | 11.4/11.5 | 555/814 | .. |
| GC0939 | 5378 | 0.407 | 09 43 03.0 | +46 56 33.3 | 4.0/6.3 | 555/814 | .. |
| GC0943 | 6581 | 0.70 | 09 43 42.7 | +48 05 03.1 | 20.2 | 702 | .. |
| A868‡‡Cluster has a tangential arc candidate with | 8203 | 0.153 | 09 45 26.4 | -08 39 06.6 | 4.4 | 606 | .. |
| Z2701 | 8301 | 0.215 | 09 52 49.1 | +51 53 05.2 | 1.0 | 606 | 1 |
| GC0952 | 6478 | 0.377 | 09 52 56.0 | +43 55 28.8 | 7.0 | 555/814 | .. |
| GC0957 | 5979 | 0.390 | 10 01 20.9 | +55 53 50.9 | 32.2/2.3 | 555/814 | .. |
| A963‡‡Cluster has a tangential arc candidate with | 8249 | 0.206 | 10 17 03.7 | +39 02 49.2 | 7.8 | 702 | 2 |
| A980 | 8719 | 0.158 | 10 22 28.4 | +50 06 19.9 | 0.8 | 606 | 1 |
| Z3146‡‡Cluster has a tangential arc candidate with | 8301 | 0.291 | 10 23 39.6 | +04 11 10.8 | 1.0 | 606 | 1 |
| A990 | 8301 | 0.142 | 10 23 39.9 | +49 08 37.9 | 0.6 | 606 | 1 |
| Z3179‡‡Cluster has a tangential arc candidate with | 8301 | 0.143 | 10 25 58.0 | +12 41 07.5 | 0.6 | 606 | 1 |
| A1033 | 8301 | 0.126 | 10 31 44.3 | +35 02 29.0 | 0.6 | 606 | 1 |
| A1068 | 8301 | 0.139 | 10 40 44.4 | +39 57 10.9 | 0.6 | 606 | 1 |
| A1084††Cluster has a radial arc candidate | 8301 | 0.133 | 10 44 32.9 | -07 04 08.0 | 0.6 | 606 | 1 |
| 5c210 | 5988 | 0.478 | 10 52 36.1 | +48 40 01.2 | 10.8/5.3 | 555/814 | .. |
| A1201‡‡Cluster has a tangential arc candidate with | 8719 | 0.151 | 11 12 54.5 | +13 26 08.0 | 0.8 | 606 | 1 |
| A1204 | 8301 | 0.171 | 11 13 20.5 | +17 35 41.0 | 0.8 | 606 | 1 |
| Z3916 | 8301 | 0.204 | 11 14 21.8 | +58 23 19.8 | 1.0 | 606 | 1 |
| A1246 | 8301 | 0.190 | 11 23 58.8 | +21 28 46.2 | 0.8 | 606 | 1 |
| RXJ1133††Cluster has a radial arc candidate‡‡Cluster has a tangential arc candidate with | 8719 | 0.394 | 11 33 13.2 | +50 08 40.8 | 1.0 | 606 | 1 |
| MS1137‡‡Cluster has a tangential arc candidate with | 6668/5987 | 0.782 | 11 40 22.3 | +66 08 14.1 | 13.8/14.4 | 606/814 | 3 |
| A1366 | 8719 | 0.116 | 11 44 36.9 | +67 24 20.4 | 0.6 | 606 | 1 |
| A1423 | 8719 | 0.213 | 11 57 17.3 | +33 36 40.1 | 1.0 | 606 | 1 |
| GC1205 | 8131 | 0.35 | 12 05 51.3 | +44 29 08.9 | 7.8 | 702 | .. |
| Z5247 | 8719 | 0.229 | 12 34 17.6 | 09 45 58.6 | 1.0 | 606 | 1 |
| GC1256 | 8131 | 0.232 | 12 56 02.3 | +25 56 36.7 | 4.4 | 702 | .. |
| 5c12.251 | 6675 | 0.312 | 13 05 51.7 | +36 39 27.3 | 5.0 | 702 | .. |
| A1682††Cluster has a radial arc candidate‡‡Cluster has a tangential arc candidate with | 8719 | 0.221 | 13 06 45.8 | +46 33 30.4 | 1.0 | 606 | 1 |
| 3c281 | 5988 | 0.600 | 13 07 54.0 | +06 42 14.5 | 9.6/7.6 | 606/814 | .. |
| GC1309 | 8325 | 0.290 | 13 09 56.2 | +32 22 13.0 | 7.8 | 702 | .. |
| A1689‡‡Cluster has a tangential arc candidate with ††Cluster has a radial arc candidate | 6004 | 0.183 | 13 11 29.4 | -01 20 28.7 | 44.2/6.0 | 555/814 | .. |
| GHO1322 | 6278 | 0.755 | 13 24 47.2 | +30 59 00.1 | 15.8/15.8 | 606/814 | .. |
| GC1322 | 5234 | 0.571 | 13 24 48.9 | 30 11 39.3 | 8.0/16.0 | 606/814 | .. |
| GC1335 | 8131 | 0.382 | 13 34 57.6 | +37 50 29.9 | 7.8 | 702 | .. |
| A1763‡‡Cluster has a tangential arc candidate with | 8249 | 0.223 | 13 35 20.2 | +41 00 04.6 | 7.8 | 702 | 2 |
| GC1347 | 8131 | 0.470 | 13 48 00.9 | +07 52 23.7 | 10.4 | 702 | .. |
| MS1358‡‡Cluster has a tangential arc candidate with | 5989 | 0.33 | 13 59 50.5 | +62 31 06.8 | 3.6 | 606/814 | 3 |
| A1835‡‡Cluster has a tangential arc candidate with ††Cluster has a radial arc candidate | 8249 | 0.253 | 14 01 02.1 | +02 52 42.3 | 7.5 | 702 | 2 |
| GC1409 | 5378 | 0.460 | 14 11 20.5 | +52 12 09.6 | 12.6 | 702 | .. |
| A1902 | 8719 | 0.160 | 14 21 40.4 | +37 17 30.5 | 0.8 | 606 | 1 |
| A1914‡‡Cluster has a tangential arc candidate with | 8301 | 0.170 | 14 25 56.7 | +37 48 58.08 | 0.8 | 606 | 1 |
| GC1444††Cluster has a radial arc candidate | 8325 | 0.298 | 14 44 06.8 | +63 44 59.6 | 7.5 | 702 | .. |
| GC1446 | 5707 | 0.37 | 14 49 31.2 | +26 08 36.8 | 4.4 | 702 | .. |
| A1978 | 8719 | 0.147 | 14 51 09.4 | +14 36 43.7 | 0.8 | 606 | 1 |
| MS1455‡‡Cluster has a tangential arc candidate with | 8301 | 0.258 | 14 57 15.1 | +22 20 34.9 | 1.0 | 606 | 1,3 |
| A2009 | 8301 | 0.153 | 15 00 19.5 | +21 22 10.7 | 0.8 | 606 | 1 |
| MS1512‡‡Cluster has a tangential arc candidate with | 6832/6003 | 0.372 | 15 14 22.4 | +36 36 21.0 | 10.4/5.8/19.8 | 555/675/814 | 3 |
| A2125 | 7279 | 0.247 | 15 41 02.0 | +66 16 26.2 | 2.6/2.6 | 606/814 | .. |
| A2146 | 8301 | 0.234 | 15 56 13.9 | +66 20 52.5 | 1.0 | 606 | 1 |
| GC1601 | 5378 | 0.539 | 16 03 13.0 | +42 45 50.7 | 16.8 | 702 | .. |
| RXJ1621.4 | 8719 | 0.465 | 16 21 24.8 | +38 10 09.0 | 1.0 | 606 | 1 |
| MS1621††Cluster has a radial arc candidate‡‡Cluster has a tangential arc candidate with | 6825 | 0.426 | 16 23 35.2 | +26 34 28.2 | 4.6/4.6 | 555/814 | 3 |
| A2204††Cluster has a radial arc candidate | 8301 | 0.151 | 16 32 46.9 | +05 34 33.1 | 0.8 | 606 | 1 |
| GC1633 | 7374 | 0.239 | 16 33 42.1 | +57 14 13.9 | 4.8 | 702 | .. |
| A2218‡‡Cluster has a tangential arc candidate with | 5701/7343 | 0.176 | 16 35 49.3 | +66 12 43.5 | 8.4/6.5 | 606/702 | 2 |
| A2219‡‡Cluster has a tangential arc candidate with ††Cluster has a radial arc candidate | 6488 | 0.225 | 16 40 19.8 | +46 42 41.9 | 14.4 | 702 | 2 |
| GC1648 | 8131 | 0.377 | 16 48 42.5 | +60 19 09.7 | 7.8 | 702 | .. |
| GC1701 | 8325 | 0.220 | 17 01 47.7 | +64 21 00.5 | 7.5 | 702 | .. |
| GC1702 | 8325 | 0.224 | 17 02 13.9 | +64 19 54.2 | 7.5 | 702 | .. |
| A2254 | 8301 | 0.178 | 17 17 45.9 | +19 40 49.1 | 0.8 | 606 | 1 |
| Z8197 | 8301 | 0.114 | 17 18 12.1 | +56 39 56.0 | 0.6 | 606 | 1 |
| A2259‡‡Cluster has a tangential arc candidate with | 8719 | 0.164 | 17 20 9.7 | +27 40 07.4 | 0.8 | 606 | 1 |
| A2261‡‡Cluster has a tangential arc candidate with | 8301 | 0.224 | 17 22 27.2 | +32 07 57.5 | 1.0 | 606 | 1 |
| A2294††Cluster has a radial arc candidate‡‡Cluster has a tangential arc candidate with | 8301 | 0.178 | 17 24 12.6 | +85 53 11.6 | 0.8 | 606 | 1 |
| RXJ1750 | 8301 | 0.171 | 17 50 16.9 | +35 04 58.7 | 0.8 | 606 | 1 |
| MS2053‡‡Cluster has a tangential arc candidate with | 5991/6745 | 0.58 | 20 56 21.4 | -04 37 50.9 | 3.3/2.4/3.2 | 606/702/814 | 3 |
| AC103 | 5701 | 0.311 | 20 57 01.1 | -64 39 47.2 | 6.5 | 702 | .. |
| 3c435a | 6675 | 0.471 | 21 29 05.5 | +07 33 00.2 | 12.8 | 702 | .. |
| RXJ2129 | 8301 | 0.235 | 21 29 40.0 | +00 05 20.7 | 1.0 | 606 | 1 |
| MS2137‡‡Cluster has a tangential arc candidate with ††Cluster has a radial arc candidate | 5991/5402 | 0.313 | 21 40 14.9 | -23 39 39.5 | 2.4/2.6/22.2 | 606/814/702 | 3 |
| A2390‡‡Cluster has a tangential arc candidate with | 5352 | 0.228 | 21 53 36.9 | +17 41 43.4 | 8.4/10.5 | 555/814 | .. |
| GC2157 | 6581 | 0.70 | 21 57 50.6 | +03 48 47.3 | 18.8 | 702 | .. |
| A2409 | 8719 | 0.147 | 22 00 52.6 | +20 58 09.7 | 0.8 | 606 | 1 |
| Cl2244‡‡Cluster has a tangential arc candidate with | 5352 | 0.330 | 22 47 12.2 | -02 05 38.6 | 8.4/12.6 | 555/814 | .. |
| AC114††Cluster has a radial arc candidate‡‡Cluster has a tangential arc candidate with | 7201/5935 | 0.312 | 22 58 48.3 | -34 48 07.2 | 15.6/16.6 | 702/702 | .. |
| 4c27.51 | 6675 | 0.319 | 23 25 00.4 | +28 03 11.4 | 5.2 | 702 | .. |
| A2667‡‡Cluster has a tangential arc candidate with | 8882 | 0.2264 | 23 51 39.4 | -26 05 03.8 | 12.0/4.0/4.0 | 450/606/814 | .. |
| Cluster | Arc Label | z ref. | Mag | Filter | L/W | N” | E” | Type | |
|---|---|---|---|---|---|---|---|---|---|
| A11 | A1 | .. | .. | 22.240.11 | 606 | 3.50.2 | -0.7 | -1.7 | R |
| AC118 | A1 | .. | .. | 24.290.19 | 702 | 9.41.2 | 2.0 | -3.9 | R |
| A2 | .. | .. | 24.550.27 | 702 | 12.11.4 | -5.4 | 0.5 | R | |
| A3 | .. | .. | 24.330.21 | 702 | 10.40.9 | -17.5 | 22.5 | R | |
| CL0024 | A††Photometry and may be affected by poor galaxy subtraction or chip boundary | 1.675 | 1 | 21.300.02,20.320.02 | 450/814 | 4.40.2 | -4.1 | 32.9 | T |
| B††Photometry and may be affected by poor galaxy subtraction or chip boundary | 1.675 | 1 | 22.190.02,21.610.03 | 450/814 | 3.70.7 | -17.7 | 29.4 | T | |
| C | 1.675 | 1 | 21.080.01,19.940.01 | 450/814 | 5.20.2 | -29.0 | 19.8 | T | |
| D | 1.675 | 1 | 22.130.03,21.350.03 | 450/814 | 4.60.1 | 11.9 | -17.8 | T | |
| E††Photometry and may be affected by poor galaxy subtraction or chip boundary | 1.675 | 1 | 23.240.03,20.980.01 | 450/814 | 2.60.1 | -0.7 | -3.9 | R | |
| A1 | .. | .. | 22.250.03,22.180.05 | 450/814 | 11.392.4 | 22.5 | -30.0 | T | |
| A2 | .. | .. | 23.470.06,23.240.11 | 450/814 | 12.21.2 | -47.3 | -21.3 | T | |
| A3 | .. | .. | 23.630.06,22.170.04 | 450/814 | 8.60.5 | -52.1 | 6.8 | T | |
| A4††Photometry and may be affected by poor galaxy subtraction or chip boundary | .. | .. | 24.430.07,22.190.02 | 450/814 | 2.30.1 | -0.9 | 6.4 | R | |
| A5 | .. | .. | 24.280.08,22.380.03 | 450/814 | 7.50.9 | -2.7 | 60.9 | T | |
| A68 | C0ab††Photometry and may be affected by poor galaxy subtraction or chip boundary | 1.60 | 2 | 20.940.04 | 702 | 9.60.7 | 2.3 | 7.7 | T |
| C0c | 1.60 | 2 | 23.990.19 | 702 | 8.30.4 | -15.9 | -11.7 | T | |
| C4 | 2.625 | 3 | 22.820.07 | 702 | 6.20.6 | -18.6 | 12.1 | T | |
| C6/C20 | .. | .. | 21.770.05 | 702 | 14.11.4 | 27.4 | -32.3 | T | |
| C8 | 0.861 | 4 | 22.730.04 | 702 | 4.00.2 | 30.3 | -46.6 | T | |
| C9 | .. | .. | 23.780.14 | 702 | 7.20.4 | 37.4 | -38.7 | T | |
| C12††Photometry and may be affected by poor galaxy subtraction or chip boundary | 1.265 | 4 | 21.090.02 | 702 | 4.80.1 | 56.6 | -28.8 | T | |
| C18 | .. | .. | 22.750.05 | 702 | 13.62.5 | 5.5 | 24.2 | T | |
| GC0054 | A1 | .. | .. | 24.180.07;23.470.07 | 555/814 | 7.40.1 | -3.2 | 14.1 | T |
| A209 | D1 | .. | .. | 21.600.02 | 702 | 8.00.3 | 15.1 | -16.4 | T |
| A267 | E0 | .. | .. | 23.900.17 | 702 | 8.70.9 | 23.3 | 12.6 | T |
| A291 | A1 | .. | .. | 23.140.15 | 606 | 3.80.4 | -1.2 | 0.2 | R |
| 5c6.124 | A1††Photometry and may be affected by poor galaxy subtraction or chip boundary | .. | .. | 23.270.05 | 702 | 8.30.4 | 1.40 | 1.5 | T |
| RCS0224 | C | 4.879 | 12 | 24.220.24,22.110.06 | 606/814 | 15.63.7 | -8.9 | -12.4 | T |
| R1 | 1.055 | 7 | 24.250.10,23.090.06 | 606/814 | 5.30.9 | -9.5 | 5.5 | R | |
| A1††Photometry and may be affected by poor galaxy subtraction or chip boundary | .. | .. | 24.260.10,24.940.4 | 606/814 | 5.31.8 | -1.5 | -0.8 | R | |
| A2††Photometry and may be affected by poor galaxy subtraction or chip boundary | .. | .. | 22.940.05,22.150.04 | 606/814 | 9.60.4 | -6.1 | 7.9 | T | |
| A3 | .. | .. | 24.500.2,22.560.06 | 606/814 | 8.61.2 | -14.5 | -6.3 | T | |
| A370 | A0††Photometry and may be affected by poor galaxy subtraction or chip boundary | 0.724 | 25 | 18.920.01 | 675 | 13.60.6 | -47.3 | 3.7 | T |
| A1 | .. | .. | 22.910.13 | 675 | 32.412.2 | 18.0 | -14.7 | T | |
| A2 | .. | .. | 23.130.13 | 675 | 19.64.9 | 21.8 | -4.9 | T | |
| B2 | 0.806 | 26 | 22.930.06 | 675 | 4.70.1 | -17.0 | -3.9 | T | |
| B3 | 0.806 | 26 | 22.990.06 | 675 | 4.40.3 | -17.9 | -9.1 | T | |
| R1/R2††Photometry and may be affected by poor galaxy subtraction or chip boundary | .. | .. | 22.220.05 | 675 | 7.00.4 | -31.2 | 0.4 | R | |
| A383 | B0a/B1abc/B4abc | 1.01 | 5,6 | 20.220.02 | 702 | 16.30.9 | -10.4 | -12.0 | T |
| B0b/B1d††Photometry and may be affected by poor galaxy subtraction or chip boundary | 1.01 | 5 | 22.690.11 | 702 | 20.23.3 | 2.6 | 1.8 | R | |
| B2ab/B2c/B3a††Photometry and may be affected by poor galaxy subtraction or chip boundary | .. | .. | 22.100.05 | 702 | 17.41.5 | -22.5 | -4.3 | T | |
| B5 | .. | .. | 23.430.24 | 702 | 16.41.9 | -15.6 | 8.7 | T | |
| B6 | .. | .. | 23.100.10 | 702 | 9.11.2 | -6.4 | 13.9 | T | |
| B7 | .. | .. | 24.360.18 | 702 | 8.60.5 | 4.3 | -18.7 | T | |
| B11 | .. | .. | 24.330.20 | 702 | 7.50.4 | 7.1 | 22.9 | T | |
| GC03053 | A1 | .. | .. | 21.930.09,21.030.08 | 606/814 | 20.91.2 | 17.03 | -6.39 | T |
| GC0337 | A1††Photometry and may be affected by poor galaxy subtraction or chip boundary | .. | .. | 23.650.08 | 702 | 9.30.7 | -7.1 | 6.7 | T |
| MS0440 | A1††Photometry and may be affected by poor galaxy subtraction or chip boundary | 0.5317 | 7 | 21.310.01 | 702 | 2.20.1 | -7.3 | 18.9 | T |
| A3††Photometry and may be affected by poor galaxy subtraction or chip boundary | .. | .. | 22.510.01 | 702 | 10.20.4 | 10.1 | -20.4 | T | |
| A16††Photometry and may be affected by poor galaxy subtraction or chip boundary | .. | .. | 20.670.01 | 702 | 2.90.1 | 4.8 | 4.7 | R | |
| A17††Photometry and may be affected by poor galaxy subtraction or chip boundary | .. | .. | 20.260.01 | 702 | 3.20.1 | 5.9 | 0.7 | R | |
| RXJ0451 | A1 | 2.007 | 7 | 20.240.03 | 606 | 19.73.7 | -3.8 | 38.0 | T |
| A2 | .. | .. | 22.820.13 | 606 | 10.31.7 | 21.6 | -18.6 | T | |
| MS0451 | A1 | 2.91 | 13 | 22.330.04 | 702 | 7.60.3 | -4.2 | 31.5 | T |
| A3††Photometry and may be affected by poor galaxy subtraction or chip boundary | .. | .. | 24.480.20 | 702 | 9.21.4 | -6.5 | 11.3 | T | |
| A4 | .. | .. | 22.480.03 | 702 | 7.20.2 | 11.9 | -18.0 | T | |
| A5††Photometry and may be affected by poor galaxy subtraction or chip boundary | .. | .. | 25.210.32 | 702 | 11.42.8 | -1.7 | 1.7 | R | |
| A6 | .. | .. | 23.660.08 | 702 | 4.60.4 | 44.2 | 81.9 | R | |
| PKS0745 | A | 0.433 | 14 | 20.730.02;18.960.01 | 555/814 | 4.30.1 | 5.8 | -18.3 | T |
| 4c+55 | A1 | .. | .. | 21.040.07 | 606 | 8.92.1 | -13.0 | -7.1 | T |
| A697 | A1 | .. | .. | 22.790.23 | 606 | 8.31.9 | -20.6 | -9.0 | T |
| GC0848N | A/B/C | 3.356 | 15 | 22.710.04 | 702 | 8.80.7 | 2.0 | -5.8 | T |
| GC0848 | A1 | .. | .. | 25.200.20 | 702 | 4.70.6 | -0.3 | -0.9 | R |
| A773 | F0††Photometry and may be affected by poor galaxy subtraction or chip boundary | 0.650 | 4 | 22.140.05 | 702 | 15.50.9 | -19.8 | -16.3 | T |
| F3††Photometry and may be affected by poor galaxy subtraction or chip boundary | 0.398 | 4 | 21.210.02 | 702 | 9.00.2 | -17.7 | -44.6 | T | |
| F4††Photometry and may be affected by poor galaxy subtraction or chip boundary | .. | .. | 23.820.13 | 702 | 10.60.8 | -30.2 | -49.6 | T | |
| F9 | .. | .. | 21.580.03 | 702 | 9.80.3 | -17.7 | 49.9 | T | |
| F11 | 1.114 | 7 | 22.860.06 | 702 | 9.50.5 | 13.0 | 48.1 | T | |
| F13 | 0.398 | 4 | 21.520.03 | 702 | 6.60.4 | -8.1 | 59.5 | T | |
| F16 | .. | .. | 23.760.09 | 702 | 4.60.3 | -4.6 | -8.4 | R | |
| F18 | 0.487 | 4 | 23.390.11 | 702 | 10.00.8 | -10.4 | 53.2 | T | |
| 3c220 | A1 | 1.49 | 16 | 22.300.04;21.360.03 | 555/814 | 10.10.1 | 8.6 | 0.4 | T |
| A868 | A1 | .. | .. | 22.280.05 | 606 | 16.82.1 | 10.3 | 17.1 | T |
| A2 | .. | .. | 24.580.23 | 606 | 8.50.8 | 9.9 | 26.6 | T | |
| A963 | H0 | 0.771 | 8 | 22.250.06 | 702 | 15.31.7 | 12.2 | -0.3 | T |
| H1/H2/H3 | 1.958⋆⋆Redshift is only for feature H1 | 7 | 21.730.06 | 702 | 30.24.0 | -17.9 | -1.5 | T | |
| H5 | .. | .. | 23.260.09 | 702 | 11.11.1 | 21.7 | -4.8 | T | |
| A1 | .. | .. | 25.030.30 | 702 | 8.01.1 | 15.1 | 14.7 | T | |
| Z3146 | A1 | .. | .. | 23.550.30 | 606 | 11.03.1 | -10.6 | 25.4 | T |
| Z3179 | A1 | .. | .. | 24.721.20 | 606 | 7.0 | 2.0 | T | |
| A1084 | A1 | .. | .. | 23.810.58 | 606 | 20.36.2 | 0.5 | -7.6 | R |
| A1201 | A1 | 0.451 | 9 | 20.350.03 | 606 | 7.80.7 | 1.8 | -2.2 | T |
| RXJ1133 | A1 | 1.544 | 5 | 20.540.03 | 606 | 12.42.0 | -0.7 | 10.7 | T |
| A2 | 1.544 | 5 | 21.560.05 | 606 | 7.00.7 | 3.3 | -1.2 | R | |
| MS1137 | A1 | .. | .. | 24.280.10,23.580.10 | 606/814 | 8.20.9 | 1.6 | 15.6 | T |
| A2 | .. | .. | 24.480.14,24.410.28 | 606/814 | 17.9 | 4.8 | T | ||
| A3 | .. | .. | 24.370.12,26.831.79 | 606/814 | -13.1 | 6.5 | T | ||
| A1682 | A1 | .. | .. | 25.171.15 | 606 | 8.33.5 | 3.3 | -1.4 | R |
| A2 | .. | .. | 22.280.11 | 606 | 25.35.7 | 3.8 | -47.9 | T | |
| A1689 | A1††Photometry and may be affected by poor galaxy subtraction or chip boundary | .. | .. | 23.400.02,21.980.04 | 555/814 | 3.20.1 | 5.9 | -14.3 | R |
| 16.2††Photometry and may be affected by poor galaxy subtraction or chip boundary | .. | .. | 23.520.03,22.120.05 | 555/814 | 3.60.1 | -0.5 | -9.8 | R | |
| 25.1††Photometry and may be affected by poor galaxy subtraction or chip boundary | .. | .. | 24.180.05,22.510.07 | 555/814 | 4.40.2 | -7.0 | -14.8 | R | |
| 5.1/5.2††Photometry and may be affected by poor galaxy subtraction or chip boundary | .. | .. | 22.490.02,21.080.03 | 555/814 | 5.50.1 | -18.7 | -5.2 | R | |
| A2††Photometry and may be affected by poor galaxy subtraction or chip boundary | .. | .. | 23.810.03,22.470.06 | 555/814 | 3.10.1 | -21.0 | 0.8 | R | |
| A6††Photometry and may be affected by poor galaxy subtraction or chip boundary | .. | .. | 23.040.03,22.470.06 | 555/814 | 6.90.1 | 9.6 | 9.8 | R | |
| 19.1††Photometry and may be affected by poor galaxy subtraction or chip boundary | .. | .. | 23.040.01,22.270.05 | 555/814 | 7.51.5 | 4.3 | 32.4 | T | |
| 12.1 | 1.83 | .. | 24.100.06,24.200.40 | 555/814 | 8.62.8 | 37.0 | 11.8 | T | |
| A3 | .. | .. | 24.100.05,24.020.32 | 555/814 | 10.03.8 | 45.9 | -11.3 | T | |
| A4 | .. | .. | 23.090.02,22.840.13 | 555/814 | 15.33.5 | 44.8 | -12.3 | T | |
| 13.1/13.2/13.3 | .. | .. | 23.530.08,22.550.21 | 555/814 | 30.63.5 | 61.0 | 53.5 | T | |
| A5 | .. | .. | 24.250.09,22.720.13 | 555/814 | 7.61.9 | -17.4 | 33.3 | T | |
| 8.1/8.2/19.3/19.4 | .. | .. | 21.670.02,20.460.05 | 555/814 | 30.11.9 | -31.5 | 36.7 | T | |
| 1.1/2.1 | 3.05 | .. | 22.350.02,21.510.06 | 555/814 | 13.81.9 | 31.7 | -45.1 | T | |
| 21.2††Photometry and may be affected by poor galaxy subtraction or chip boundary‡‡Unable to detect feature or get reliable photometry in one of the observed bands | .. | .. | -,23.850.34 | 555/814 | -16.6 | 18.9 | R | ||
| 29.2‡‡Unable to detect feature or get reliable photometry in one of the observed bands | .. | .. | 25.970.39,- | 555/814 | 13.91.0 | 53.5 | 8.1 | T | |
| A6aaThere is a flatfielding problem with this portion of the chip for this image. While this arc is clearly detected in the F814W band, no attempt was made to correct the flatfielding problem and so no arc magnitude was recoverable. The for this arc was determined solely from the F555W band. | .. | .. | 24.640.08,- | 555/814 | 12.10.7 | 41.0 | 31.9 | T | |
| A1763 | J1 | .. | .. | 24.870.28 | 702 | 8.71.5 | -5.9 | 14.1 | T |
| MS1358 | B/C‡‡Unable to detect feature or get reliable photometry in one of the observed bands | 4.92 | 17 | 22.190.11 | 606/814 | 14.91.6 | -18.6 | -11.7 | T |
| A1835 | K0††Photometry and may be affected by poor galaxy subtraction or chip boundary | .. | .. | 24.100.13 | 702 | 6.10.3 | 7.2 | -1.1 | R |
| K2 | .. | .. | 23.450.11 | 702 | 7.70.7 | -0.8 | 20.9 | T | |
| K3††Photometry and may be affected by poor galaxy subtraction or chip boundary | .. | .. | 21.710.07 | 702 | 12.01.2 | -20.8 | 23.3 | T | |
| A1914 | A1 | .. | .. | 23.350.20 | 606 | -25.4 | -11.8 | T | |
| GC1444 | A1 | 1.151 | 7 | 23.880.11 | 702 | 4.40.5 | 1.2 | 0.8 | R |
| MS1455 | A1 | .. | .. | 21.660.08 | 606 | 15.66.6 | 8.9 | 17.9 | T |
| MS1512 | cB58††Photometry and may be affected by poor galaxy subtraction or chip boundary | 2.72 | 18 | 20.620.01;20.400.02;19.930.01 | 555/675/814 | 4.10.2 | 4.6 | -2.3 | T |
| MS1621 | A1††Photometry and may be affected by poor galaxy subtraction or chip boundary | .. | .. | 25.190.52;25.420.23 | 555/814 | -1.5 | -0.1 | R | |
| A2††Photometry and may be affected by poor galaxy subtraction or chip boundary | .. | .. | 21.210.03;22.100.04 | 555/814 | 8.90.1 | 3.4 | 3.5 | T | |
| A2204 | A1 | .. | .. | 22.360.10 | 606 | 5.90.4 | 7.9 | 2.7 | R |
| A2 | .. | .. | 22.560.09 | 606 | 6.00.4 | 3.4 | -0.3 | R | |
| A2218 | M0bcd | 0.702 | 23 | 21.010.01,20.160.01 | 606/702 | 11.00.7 | -16.6 | 12.7 | T |
| M4∗∗Due to different imaging orientations, this arc only appear in the F702W image | 1.034 | 23 | 20.250.02 | 606/702 | 15.31.0 | -53.2 | 35.9 | T | |
| M1ab | 2.515 | 24 | 21.330.02,20.820.02 | 606/702 | 6.50.7 | 22.4 | 0.9 | T | |
| M3ab | .. | .. | 23.030.08,22.940.10 | 606/702 | 18.30.3 | 17.0 | -17.6 | T | |
| 730∗∗Due to different imaging orientations, this arc only appear in the F702W image | .. | .. | 22.020.05 | 702 | 17.20.2 | -59.2 | 45.6 | T | |
| 323 | .. | .. | 21.380.02,20.560.01 | 606/702 | 7.71.6 | -14.3 | 24.2 | T | |
| 382 | .. | .. | 23.750.16,25.471.00 | 606/702 | 16.22.0 | 35.1 | 2.7 | T | |
| A1 | .. | .. | 23.430.07,23.270.08 | 606/702 | 7.20.9 | -38.6 | 9.1 | T | |
| H2/H3∗∗Due to different imaging orientations, this arc only appear in the F702W image | .. | .. | 23.190.12 | 702 | 22.93.0 | -32.3 | 31.3 | T | |
| H1/273 | .. | .. | 21.730.01,21.890.03 | 606/702 | 8.91.5 | -20.0 | 40.2 | T | |
| A2219 | P0 | 1.070 | 3 | 21.580.02 | 702 | 10.00.6 | -13.9 | 10.6 | T |
| P2ab | 2.730 | 3 | 22.380.05 | 702 | 26.93.0 | 17.3 | -16.9 | T | |
| P2c | 2.730 | 3 | 22.600.03 | 702 | 6.00.2 | -3.8 | -26.7 | T | |
| P13 | .. | .. | 23.940.11 | 702 | 9.00.7 | 4.6 | -30.8 | T | |
| A1††Photometry and may be affected by poor galaxy subtraction or chip boundary | .. | .. | 23.890.08 | 702 | 5.30.5 | -19.2 | 31.1 | R | |
| A2259 | A1 | 1.477 | 7 | 21.700.08 | 606 | 17.84.8 | -0.7 | 10.7 | T |
| A2261 | A1††Photometry and may be affected by poor galaxy subtraction or chip boundary | .. | .. | 22.820.20 | 606 | 25.58.1 | -6.6 | -26.3 | T |
| A2††Photometry and may be affected by poor galaxy subtraction or chip boundary | .. | .. | 21.760.04 | 606 | 7.70.9 | 8.4 | 23.5 | T | |
| A2294 | A1 | .. | .. | 24.690.81 | 606 | 2.3 | 6.7 | R | |
| A2 | .. | .. | 24.090.70 | 606 | -19.9 | -24.9 | T | ||
| MS2053 | AB | 3.146 | 29 | 21.670.03;21.270.05;20.900.05 | 606/702/814 | 11.60.7 | 14.6 | -3.8 | T |
| MS2137 | A01/A02 | 1.501 | 10 | 21.760.06;21.910.04;21.540.12 | 606/702/814 | 13.65.7 | 15.4 | 1.5 | T |
| AR | 1.502 | 10 | 23.680.16;23.580.07;23.200.24 | 606/702/814 | 9.22.7 | 5.4 | -0.2 | R | |
| A2390 | A/C | 1.033/0.913 | 22 | 21.510.03,19.90.02 | 555/814 | 10.70.5 | 17.7 | -33.7 | T |
| H3a | 4.04 | 22 | 24.150.14,22.440.06 | 555/814 | 7.90.4 | 19.3 | -45.1 | T | |
| H3b | 4.04 | 22 | 24.460.12,22.880.06 | 555/814 | 4.10.1 | 9.4 | -49.7 | T | |
| H5a | 4.05 | 27 | 24.280.11,23.530.11 | 555/814 | 5.00.7 | 3.6 | -20.4 | T | |
| H5b | 4.05 | 27 | 24.210.11,22.820.06 | 555/814 | 5.90.9 | -9.4 | -24.6 | T | |
| A1 | .. | .. | 24.780.22,23.270.11 | 555/814 | 10.40.9 | -6.3 | 5.8 | T | |
| A2††Photometry and may be affected by poor galaxy subtraction or chip boundary | .. | .. | -,20.760.04 | 555/814 | 19.12.1 | -13.5 | 6.1 | T | |
| A3 | .. | .. | 22.590.10,22.990.11 | 555/814 | 8.10.5 | -33.2 | 9.2 | T | |
| CL2244 | A1††Photometry and may be affected by poor galaxy subtraction or chip boundary | 2.237 | 11 | 20.620.02,20.000.02 | 555/814 | 10.80.1 | 1.3 | -8.3 | T |
| A4 | .. | .. | 23.740.13,24.720.59 | 555/814 | 10.41.9 | -1.9 | 33.2 | T | |
| AC114 | A4/A5 | .. | .. | 22.590.04 | 702 | 6.90.4 | -2.9 | -0.3 | R |
| S1††Photometry and may be affected by poor galaxy subtraction or chip boundary | 1.867 | 21 | 21.970.02 | 702 | 2.50.1 | 12.7 | 2.0 | T | |
| S2††Photometry and may be affected by poor galaxy subtraction or chip boundary | 1.867 | 21 | 21.910.02 | 702 | 3.10.1 | 12.7 | 2.0 | T | |
| C1 | 2.854 | 19 | 24.170.10 | 702 | 5.60.2 | 29.0 | 5.6 | T | |
| T1 | .. | .. | 24.680.36 | 702 | 29.04.7 | -24.7 | 2.5 | T | |
| T2 | .. | .. | 24.080.13 | 702 | 14.21.5 | -33.1 | 15.5 | T | |
| T3 | .. | .. | 22.480.05 | 702 | 7.70.6 | -40.0 | 16.1 | T | |
| A2667 | A1 | 1.034 | 7 | 19.670.01,19.330.01,18.260.01 | 450/606/814 | 14.62.4 | 13.4 | 6.1 | T |
| A2 | .. | .. | 23.070.06,23.590.16,23.500.37 | 450/606/814 | 18.18.9 | 7.2 | 14.7 | T |
References. — (1) Broadhurst et al. 2000; (2) Smith et al. 2002; (3) Smith et al. 2004; (4) Richard et al. in prep; (5) Sand et al. 2004; (6) Smith et al. 2001; (7) This work; (8) Ellis et al. 1991; (9) Edge et al. 2003; (10) Sand et al. 2002; (11) Mellier et al. 1991; (12) Gladders, Yee, & Ellingson 2002; (13) Borys et al. 2004; (14) Allen et al. 1996; (15) Holden et al. 2001; (16) PID 6778 abstract; (17) Franx et al. 1997; (18) Yee et al. 1996; (19) Campusano et al. 2001; (20) Smail et al. 1995; (21) Lemoine-Busserolle et al. 2003; (22) Frye & Broadhurst 1998; (23) Pello et al. 1992; (24) Ebbels et al. 1998; (25) Soucail et al. 1988; (26) Bezecourt et al. 1999; (27) Pello et al. 1999; (29) Tran et al. 2004