Long-term variations in the pulse emission from PSR J07373039B
Abstract
Analysis of 20 months of observations at the Parkes radio telescope shows secular changes in the pulsed emission from J07373039B, the 2.77 s pulsar of the double-pulsar system. Pulse profiles are becoming single-peaked in both bright phases of the orbital modulation although there is no clear variation in overall pulse width. The shape of the orbital modulation is also varying systematically, with both bright phases shrinking in longitude by yr-1. However, the combined span of the two bright phases is relatively constant and together they are shifting to higher longitudes at a rate of yr We discuss the possible contributions of geodetic precession and periastron advance to the observed variations.
Subject headings:
binaries: general — pulsars: general — pulsars: individual (PSR J07373039B)1. Introduction
One of the many unique features of the double-pulsar system J07373039A/B (Burgay et al., 2003; Lyne et al., 2004) is the dramatic orbital modulation of the pulsed emission from PSR J07373039B (hereafter “B”), the 2.77 s pulsar of the system. Both the shape and the intensity of the B pulse profile vary with orbital longitude, with two bright phases centered around longitudes (with respect to the ascending node) of (bright phase 1, hereafter bp1) and (hereafter bp2), respectively. The pulse is weakly visible at other orbital longitudes, except perhaps between and .
This unprecedented behavior has been interpreted as being due to the interaction between radiation from the 23 ms pulsar J07373039A (hereafter “A”) and B’s magnetosphere (Jenet & Ransom, 2004; Zhang & Loeb, 2004; Lyutikov, 2004, 2005). Direct evidence of the mutual interaction between the two pulsars is manifested by the drifting behavior at A’s period in the single pulses of B (McLaughlin et al., 2004a) and by the modulation at B’s period of the emission from A during its eclipse (McLaughlin et al., 2004b).
The geometry of the system is expected to vary with time as a result of the strong relativistic effects occurring in the system: the geodetic precession (Damour & Ruffini, 1974) and periastron advance of B have periods of only 71 and 21 yr, respectively, both much less than for any other known pulsar binary system (Lyne et al., 2004). These effects are expected to result in secular changes in the observed pulse shape (see e.g. Kramer, 1998), in the interaction between the two pulsars, and hence in the orbital modulation. Somewhat surprisingly, Parkes observations of A show no significant evidence of profile-shape variation over a 3 yr interval (Manchester et al., 2005). Near alignment of A’s rotation axis with the orbit normal is a possible explanation for the observed lack of variations.
2. Observations and Results
The double-pulsar system J07373039A/B was observed at 20 cm (1390 MHz) using the Parkes 64 m radio telescope from 2003 May 1 to 2005 January 1. All observations were made using the central beam of the multibeam receiver, except from November 2003 to September 2004 when the “H-OH” receiver was used. A filter-bank system providing 512 total-power channels across 256 MHz was used. Further details of the observing systems are given in Manchester et al. (2005). For the present analysis we used a total of 94 hr of data spread over 105 observations, more or less uniformly distributed across the 20 month data span.
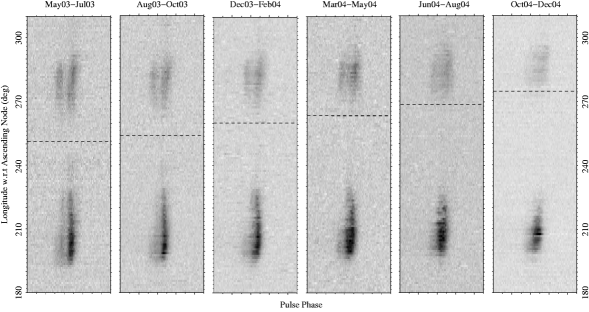
Figure 1 shows the intensity of the two bright phases of emission from B as a function of the orbital longitude with respect to the ascending node for six epochs across the 20 month data span. Each panel was obtained by summing the observations taken over an 3 month interval. The PSRCHIVE data analysis system (Hotan et al., 2004) was used to sum and image the data. These plots confirm the overall picture presented in Lyne et al. (2004) and Ramachandran et al. (2005), showing the complex pulse shape and flux density variations as a function of orbital longitude. Furthermore, Figure 1 clearly shows that both the extent in orbital longitude of the bright phases and the shape of the pulse at a given orbital longitude are evolving with time. We also note that the mean pulse intensity in bp2 is decreasing relative to that in bp1. In the following sections we quantify these trends.
2.1. Pulse Profile Variations
As Figure 1 shows, the mean pulse profile for B is quite different in bp1 and bp2 and even varies somewhat with orbital longitude within each bright phase. Despite the small variations within each bright phase, we have chosen to illustrate the trends in profile shape by integrating across bp1 and bp2 separately for each of the epochs corresponding to those in Figure 1. The resulting pulse profiles are shown in Figure 2. This figure shows significant long-term variations in the mean pulse profile for both bright phases. The variations are in fact very similar in both bp1 and bp2, with the leading component getting weaker and the trailing component becoming broader with time. There is little or no significant evolution in the 10% width of either profile (upper limits of 7 and 8 ms yr-1 for bp1 and bp2, respectively). For bp1, the width of the trailing component appears to increase with time, but the change is nonlinear, with the first two profiles narrow and the last four broader. The feature on the leading edge of the trailing component in the 2004 January profile suggests that this width increase is due to the relatively rapid growth of an additional component between the two other components. For bp2 the 50% widths are difficult to interpret as the leading component has a relative amplitude close to 50% and the signal-to-noise ratio is smaller.

2.2. Orbital Phase Variations
To quantify the orbital evolution of the bright phases, we took the data illustrated in Figure 1 and summed the pulse intensity at each epoch over the 3% of pulse phase where the pulse is present. A baseline level calculated in the orbital longitude range – was then subtracted, and the area under the resulting curves equalized to remove the effects of refractive interstellar scintillation. The resulting normalized pulse intensity curves are shown in Figure 3 for each of the six epochs.

This figure shows clear systematic changes in the orbital modulation with time. The most obvious change is that the saddle region between the two bright phases is becoming less filled: that is, the end of bp1 and the start of bp2 are becoming more separated. Less obvious are that the modulation as a whole is moving toward later longitudes and that relative to bp1, bp2 is becoming fainter. These changes are shown more quantitatively in Figures 4 and 5.


Linear least-squares fits to the points in Figure 4 show that the starting point of bp1 and the end of bp2 are slowly shifting toward higher longitudes at a rate of and yr-1, respectively (all the errors are quoted at 2 ). Likewise, the centroid of bp1 and bp2 taken together is moving at a rate of yr-1, confirming that the overall modulation pattern is shifting toward later longitudes. However, the interior points have a different behavior, with the end of bp1 moving backward at yr-1 and the start of bp2 advancing at yr-1. This shows that bp1 and bp2 are shrinking at a rate of and yr-1, respectively, and the gap between the two bright phases is widening at yr-1.
3. Discussion
This Letter reports the first observation of secular changes in the pulsed emission from the J07373039A/B binary system. The B pulse profile, initially consisting of two obvious components in both bright phases, has become single peaked over the 20-month interval of our observations. This constrasts with the apparent stability of A’s profile over a similar interval (Manchester et al., 2005). Moreover, the orbital extent of both bright phases is shrinking at a rate of yr-1 and bp2 is getting progressively fainter with respect to bp1. Both the outer edges and the centroid of the two bright phases taken together are advancing in orbital longitude at a rate of yr-1, whereas there is no significant variation in the separation of the outer edges of the modulation pattern. All these numbers have been derived by analyzing observations made at 1.4 GHz; similar trends appear in a preliminary inspection of unpublished data taken at the Green Bank and the Giant Metrewave Radio Telescopes at lower frequencies.
If these changes were to continue at the current rate, the second bright phase would disappear by the end of 2007 when its centroid will be at orbital longitude , whereas bp1 will fade away in mid-2009, with the centroid at orbital longitude . We note that the shape of the integrated pulse profile of B at orbital longitudes away from the two bright phases is single-peaked with 10% and 50% widths ( and ms, respectively) similar to the corresponding values for the pulse profile in bp1. This may indicate that B’s emission is tending to become more uniform along the orbit as the physical processes producing the bright regions cease to operate.
Provided B’s spin and total angular momentum vectors are not aligned, general relativity predicts (e.g., Barker & O’Connell, 1975) that B’s rotational axis will precess about the orbit normal at a rate yr-1. This precession will vary the angle of impact of A’s wind on B’s open magnetic field lines. Several authors (Lyne et al., 2004; Jenet & Ransom, 2004; Lyutikov, 2004; Zhang & Loeb, 2004; Lyutikov, 2005) have suggested that the pulsed emission from B is modulated by the impinging energetic flux from A, so some kind of evolution in B’s orbital light curve may be expected. We note that is of the same order of magnitude as the rate of the observed variations in the location and extent of bp1 and bp2.
Geodetic precession will also change our line of sight across B’s emission cone, affecting the shape and width of the observed pulse profile as reported for other pulsars (Weisberg et al., 1989; Kramer, 1998; Stairs et al., 2004). In fact, the profile shapes in both bp1 and bp2 are clearly evolving. However, there is no significant variation in the angular extent of the pulse emission, with limits of about yr-1 on the change of the 10% widths. This may indicate that B’s spin axis is almost parallel to orbit normal, possibly supporting the hypothesis that wind-torques from A, which dominate the energetics of the system, have caused the spin axis of B to almost align with the direction of the orbital angular momentum (Arons et al., 2005; Demorest et al., 2004).
Periastron precession has moved the orbit with respect to the ascending node by over our data span. This large angular shift is not reflected in any of the measured variations of the orbital light curves and so the relative position of the two stars with respect to periastron cannot be a significant factor in the changing orbital modulation of the emission from B. Likewise, it cannot be responsible for the shrinking width of the bright phases. In fact, despite the longitudinal extents of bp1 and bp2 undergoing a similar decreasing trend, the linear distance between the two pulsars has changed with opposite signs in bp1 and bp2 along the data span: an increment for bp1 and an decrement for bp2.
Various models have been proposed to explain the dramatic orbital modulation of the B pulse emission. Jenet & Ransom (2004) suggested that B brightens only when the emission beam from A illuminates B’s magnetosphere. In its present form, the model is inconsistent with the observed stability of A’s emission (Manchester et al., 2005), and it does not include B’s geodetic precession or the effect of the varying separation of the two pulsars at a given orbital longitude.
Zhang & Loeb (2004) propose that the modulation is a consequence of particles from A’s wind streaming into some of the open magnetic field lines of B. The model requires that A’s wind is anisotropic and also that B’s spin axis is not parallel to the orbital angular momentum vector, thus allowing geodetic precession to have an effect: the size and the location of the portion of B’s open magnetosphere directly seen by A’s wind at any given orbital longitude would be modified.
Alternatively, Lyutikov (2004) first suggested that B brightens when the line of sight runs parallel to the magnetic field lines in the portion of the B’s magnetosphere where the field lines are swept back owing to the impinging A’s wind: in fact, strongly curved magnetic field lines would favor the growth of a Cerenkov-drift instability, producing radio emission beamed along (and polarized perpendicular to the plane of) the magnetic field lines. In this model geodetic precession affects the location along the orbit (and the spin phase of B) at which the condition of alignment between the bent-back field lines and the line of sight is met.
More recently, Lyutikov (2005) has proposed that the modulations of the B light curve are due to orbital phase-dependent distortions of B’s magnetosphere by A’s wind. In this model, B is intrinsically bright at all orbital phases, but strong emission is detected only at those orbital longitudes where the magnetic field lines along which the radio emission is generated are bent toward the observer.
Assuming the geometry inferred in Lyutikov & Thompson (2005, and , where is the angle between spin and magnetic axes of B, and is the angle between spin axis and orbit normal), this model roughly accounts for both the extent and the location of the two bright phases. It can also account for the variations of the pulse shape along the orbit (Lyne et al., 2004; Ramachandran et al., 2005) and predicts that the separation between bp1 and bp2 will vary because of geodetic precession. The magnitude and direction of the changes we observe will place further constraints on this model parameters.
With continued monitoring of the secular evolution of the emission from the J07373039A/B double-pulsar system, including the measurement of the changes in polarization properties, we should be able to remove the existing degeneracy both in the orientation of the spin and magnetic axes of the two pulsars and among various precessional effects; this will also be crucial for measuring the moment of inertia of pulsar A once we measure higher-order terms to periastron advance at the second Post-Newtonian level (Kramer et al., 2005). Combining these data with an improved understanding of the complicated magnetospheric interactions and emission physics in the system, we may hope to eventually obtain an explanation for this most intriguing pulsar behavior.
References
- Arons et al. (2005) Arons, J., Backer, D. C., Sptikovsky, A., & Kaspi, V. M. 2005, in Binary Radio Pulsars, ed. F. Rasio & I. H. Stairs (San Francisco: ASP), in press (astro-ph/0404159)
- Barker & O’Connell (1975) Barker, B. M. & O’Connell, R. F. 1975, ApJ, 199, L25
- Burgay et al. (2003) Burgay, M., et al. 2003, Nature, 426, 531
- Damour & Ruffini (1974) Damour, T. & Ruffini, R. 1974, C. R. Acad. Sc. Paris, Serie A, 279, 971
- Demorest et al. (2004) Demorest, P., Ramachandran, R., Backer, D. C., Ransom, S. M., Kaspi, V., Arons, J., & Spitkovsky, A. 2004, ApJ, 615, L137
- Hotan et al. (2004) Hotan, A. W., van Straten, W., & Manchester, R. N. 2004, Publ. Astron. Soc. Australia, 21, 302
- Jenet & Ransom (2004) Jenet, F. A. & Ransom, S. M. 2004, Nature, 428, 919
- Kramer (1998) Kramer, M. 1998, ApJ, 509, 856
- Kramer et al. (2005) Kramer, M., et al. 2005, in Binary Radio Pulsars, ed. F. Rasio & I. H. Stairs (San Francisco: ASP), in press (astro-ph/0405179)
- Lyne et al. (2004) Lyne, A. G., et al. 2004, Science, 303, 1153
- Lyutikov (2004) Lyutikov, M. 2004, MNRAS, 353, 1095
- Lyutikov & Thompson (2005) Lyutikov, M. & Thompson, C. 2005, ApJ, submitted (astro-ph/0502333)
- Lyutikov (2005) Lyutikov, M. 2005, MNRAS, submitted (astro-ph/0502503)
- Manchester et al. (2005) Manchester, R. N., et al. 2005, ApJ, 621, L49
- McLaughlin et al. (2004a) McLaughlin, M. A., et al. 2004a, ApJ, 613, L57
- McLaughlin et al. (2004b) McLaughlin, M. A., et al 2004b, ApJ, 616, L131
- Ramachandran et al. (2005) Ramachandran, R., Backer, D. C., Demorest, P., Ransom, S. M., & Kaspi, V. M. 2005, ApJ, submitted (astro-ph/0404392)
- Stairs et al. (2004) Stairs, I. H., Thorsett, S. E., & Arzoumanian, Z. 2004, Phys. Rev. Lett., 93, 141101
- Weisberg et al. (1989) Weisberg, J. M., Romani, R. W., & Taylor, J. H. 1989, ApJ, 347, 1030
- Zhang & Loeb (2004) Zhang, B. & Loeb, A. 2004, ApJ, 614, L53