Berkeley 22, an old and distant open cluster towards the Galactic anticentre
Abstract
We present deep CCD photometry of the distant, old open cluster Berkeley 22, covering from the red giants branch (RGB) to about 6 magnitudes below the main sequence (MS) turn-off. Using the synthetic Colour - Magnitude Diagram method with three different types of stellar evolutionary tracks, we estimate values and theoretical uncertainty of distance modulus (m-M)0, reddening E() , age and approximate metallicity. The best fit to the data is obtained for 13.8 (m-M)0 14.1, 0.64 E() 0.65, 2.0 2.5 Gyr (depending on the amount of overshooting from convective regions adopted in the stellar models) and solar metallicity.
keywords:
Hertzsprung-Russell (HR) diagram – open clusters and associations: general – open clusters and associations: individual: Berkeley 221 Introduction
This paper is part of our general program of observations of galactic open clusters (the Bologna Open Clusters Chemical Evolution project, or BOCCE, Bragaglia & Tosi 2004, and in preparation). These aggregates, and in particular the old ones, represent an ideal tool to study the properties of the disc of our Galaxy and their evolution with time (e.g. Janes 1979; Panagia & Tosi 1981; Friel 1995). Open clusters with ages less than about 5 Gyr are also good tests of the stellar evolutionary tracks, since they can be used to discriminate between models with or without overshooting, and on its supposed extension.
In our well tested approach, we obtain the cluster colour-magnitude diagram (CMD) from deep and precise photometry, and derive at the same time age, distance, reddening and approximate metallicity using the synthetic CMD method (Tosi et al. 1991). We have already published our findings for 15 clusters (see Kalirai & Tosi 2004; Tosi et al. 2004, and references therein). Whenever possible, we also try to derive precise metal abundances with high resolution spectroscopy (Bragaglia et al. 2001; Carretta et al. 2004).
We present here the photometric results on the relatively unstudied open cluster Berkeley 22 (C0555+078), with coordinates , , l = , b = .
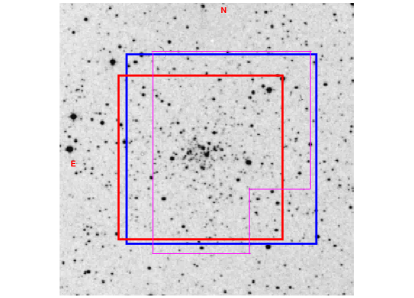
The best colour magnitude diagram published so far for this object is by Kaluzny (1994, hereafter K94). He observed a small region around the cluster centre (covering with a mosaic of 5 pointings less than 4.5 arcmin by 6 arcmin, see Fig. 1) with the KPNO 2.1m telescope, in the , , and filters. He obtained quite deep CMDs and derived a very small apparent radius for the cluster, of about 2 arcmin on the sky. Kaluzny estimated age, reddening, and distance (age 3 Gyr, E() = 0.65, and distance from the Sun = 6 kpc), assuming solar metallicity. This assumption was made for lack of any precise information on the true metal abundance, but he argued that the actual metallicity should be lower than solar, because of the morphology of the red giant clump (in which case, reddening and distance estimates would increase).
Phelps, Janes & Montgomery (1994, their fig. 13) also observed this cluster, in the and filters. From their data, of quality inferior to K94, they estimate an age of 2.1 Gyr, based on the MAI (Morphological Age Indicator, i.e. the difference in magnitude between the MS turn-off and the red clump). In a companion paper Janes & Phelps (1994) give for this cluster E(B-V)=0.65, as deduced from the mean colour of the red clump.
Salaris, Weiss & Percival (2004), using a new calibration of the morphological age index, and adopting V = 2.1 from Friel (1995) and [Fe/H] = from Gratton (2000), find for Be 22 an age of 4.26 1.65 Gyr.
Lata et al. (2002) give integrated magnitude and colour for Be 22, based on published data: following their age - magnitude relation, an age of 1.1 Gyr is derived, while the use of the age - colour relation produces an unreasonable value (28 Gyr).
The maps of dust infrared emission by Schlegel, Finkbeiner & Davis (1998) indicate a reddening of E() = 0.65, while Dutra & Bica (2000) find E() = 0.63, in very good agreement. Noriega-Mendoza and Ruelas-Mayorga (1997), applying a technique similar to the Sarajedini (1994) method for simultaneous metallicity and reddening determination, find [Fe/H] = and E() = 0.70. The reddening seems in close agreement with the other literature values, even if tied to a metallicity different from K94.
Finally, Be 22 has recently been suggested to be part of the Canis Major cluster family (Frinchaboy et al. 2004, Martin et al. 2004), as many other OCs.
In Section 2 we describe our data and the reduction process, in Section 3 we present our CMDs and compare them to literature ones, in Section 4 we derive the cluster parameters, and a summary is given in Section 5.
2 Observations and data reduction
Berkeley 22 was observed at three different telescopes. Table 1 gives a log of the three runs and Fig. 1 shows the used observed fields (as well as K94’s).
The first data were obtained with the 1.54m Danish telescope located in La Silla, Chile, on 1995 March 6, 8, 10. We used the direct camera with CCD No 28 (Tek 10241024, scale 0.377 arcsec pix-1, field of view 6.4 6.4 arcmin2). We took only one field, centred on the cluster (see Fig. 1). Exposures ranged from 300 to 1500 seconds in B, from 20 to 900 seconds in V and from 30 to 900 seconds in I. Conditions were photometric, and seeing ranged between 0.9 and 1.4 arcsecarcsec. Standard stars areas were observed, and later used to calibrate the whole set of data on the cluster.
We later reobserved the cluster on 2000 October 2 and 3 with the Telescopio Nazionale Galileo (TNG) on Roque de los Muchachos, mounting DOLORES (Device Optimized for LOw RESolution) a focal reducer instrument equipped with a Loral thinned, back-illuminated 20482048 CCD, with scale 0.275 arcsec pix-1, and field of view of 9.4 9.4 arcmin2. Seeing conditions were not ideal for this rather crowded cluster, and we had some technical problems, which plagued chiefly the long exposures on the central field. We decided to retain for further analysis only the data obtained for the external comparison field, located 30 arcmin South of the cluster centre, and calibrated independently using standard areas observed during the run.
Finally, deep exposures (B: 3 600 sec; V: 2 300 sec, I: 2 300 sec) on the central field were obtained with the Superb Seeing Imager 2 (SuSI2) on the New Technology Telescope (NTT), on 2000 December 1 (see Fig. 1). The two EEV CCDs cover a field of view of 5.4 5.4 arcmin2, and a gap of about 8 arcsec is present between the two chips; we binned the chips 22, yielding a scale of 0.16 arcsec pix-1. Seeing was better than about 1 arcsec.
| Date | Instrument | Ra, Dec | Exposures |
|---|---|---|---|
| 1995 March 6,8,10 | Danish + direct CCD | 05:58:10, +07:45:17 | B=300,1500; V=20,60,300,720,900; I=30,60,180,480,900 |
| 2000 October 3 | TNG + DOLORES | 05:58:27, +07:15:28 | B=60,900; V=10,300; I=10,300 |
| 2000 December 1 | NTT + SuSI2 | 05:58:28, +07:45:32 | B=600,600,600; V=300,300; I=300,300 |
For all sets of data, standard CCD reduction of bias subtraction, trimming, and flatfield correction were performed. We applied to all frames the usual procedure for point spread function (PSF) study and fitting available in DAOPHOT–II (Stetson 1987, Davis 1994) in IRAF111 IRAF is distributed by the National Optical Astronomical Observatory, which are operated by the Association of Universities for Research in Astronomy, under contract with the National Science Foundation environment. All frames were searched independently (the two SuSi2 chips were reduced separately), and the output catalogues were later aligned in coordinates. Magnitudes for the frames centred on Be 22 were aligned to a reference frame for each band, chosen among the Danish ones, since they were acquired under photometric conditions. A colour term is present in the B filter and was taken into account in the photometry calibration. All the catalogues of instrumental magnitudes (5 in , 7 in and ) were correlated; multiple measures of the same star in the same filter were averaged using a rejection cycle. Finally, aperture photometry was performed on isolated stars on the reference images (47 stars for the B, 51 for the V and 40 for the I bands respectively), to compute a correction to the PSF derived magnitudes and be on the same system as the photometric standard stars. This correction is -0.240, -0.223, -0.141 mag in , and respectively. Analysis of the external field proceeded in a completely analogous way.
The calibration from instrumental magnitudes to the Johnson-Cousins standard system was obtained on the Danish data in the case of the central field, using the same set of equations derived for Pismis 2 (Di Fabrizio et al. 2001), a cluster observed in the same run. We refer to that paper for all details. The TNG data for the external field were calibrated separately, using the following equations, derived from the Stetson (2000) standard areas Markarian A and PG0231+051:
where are the instrumental magnitudes and are the corresponding Johnson-Cousins magnitudes.
We tested the completeness of our photometry in the B, V and I bands on the deepest frames (the SuSI2 oned for Be 22), using the procedure developed by P. Montegriffo at the Bologna Observatory. Artificial stars were added, about 120 at a time, to the frames at random positions properly chosen in order not to alter the crowding conditions. The images were then reduced exactly as before, finding objects and measuring magnitudes using the same parameters, PSF and selection criteria. The process was repeated as many times as to reach about 50000 added artificial stars, to ensure statistical significance. We then derived the completeness level (see Table 2) as the ratio of recovered over added stars in different magnitude bins. A a star is considered as recovered if it is found within 0.5 pixel and 0.75 mag of the simulated one. The former value is due to the pointing precision and the latter corresponds to the magnitude difference resulting from complete overlap of two equal brightness stars. By keeping all the artificial stars with lower magnitude difference, we can trace the trend of blending with magnitude (see e.g. Tosi et al. 2001) and introduce it in the synthetic CMD procedure described below.
The differences between the input and output magnitudes of the artificial stars provide a good estimate of the photometric errors (and possible image blends). The errors in the cluster field turn out to be smaller than 0.01 mag for 18.2, and 16.5, and larger that 0.1 mag for 24.2, 23.5 and 21.5.
| mag | ComplB | ComplV | ComplI |
|---|---|---|---|
| 15.250 | 1.000 | 1.000 | 0.996 |
| 15.750 | 1.000 | 1.000 | 0.996 |
| 16.250 | 0.989 | 0.998 | 0.995 |
| 16.750 | 0.989 | 0.997 | 0.995 |
| 17.250 | 0.989 | 0.999 | 0.996 |
| 17.750 | 0.989 | 0.997 | 0.989 |
| 18.250 | 0.987 | 0.997 | 0.994 |
| 18.750 | 0.985 | 0.995 | 0.986 |
| 19.250 | 0.983 | 0.991 | 0.984 |
| 19.750 | 0.979 | 0.987 | 0.982 |
| 20.250 | 0.976 | 0.986 | 0.977 |
| 20.750 | 0.972 | 0.981 | 0.965 |
| 21.250 | 0.967 | 0.975 | 0.940 |
| 21.750 | 0.957 | 0.969 | 0.800 |
| 22.250 | 0.935 | 0.950 | 0.425 |
| 22.750 | 0.892 | 0.882 | 0.085 |
| 23.250 | 0.818 | 0.780 | 0.008 |
| 23.750 | 0.689 | 0.505 | 0.001 |
| 24.250 | 0.488 | 0.111 | 0.000 |
| 24.750 | 0.264 | 0.009 | 0.000 |
| 25.250 | 0.103 | 0.001 | 0.000 |
| 25.750 | 0.029 | 0.000 | 0.000 |
| 26.250 | 0.007 | 0.000 | 0.000 |
3 The colour - magnitude diagram


The final cluster catalogue contains 1494 stars, of which 1123 have , , and magnitudes, 4 have only and magnitudes, and 367 have only and magnitudes. The catalogue was astrometrized using private software written by P. Montegriffo at the Bologna Observatory; pixel coordinates were transformed to equatorial coordinates by means of 140 objects in common with the Guide Star Catalogue 2; residuals of the transformation between the two systems are of about 0.08 arcsec both in right ascension and declination. Tables containing the photometry, the pixel and equatorial coordinates will be available in electronic form through the BDA222 http://obswww.unige.ch/webda/webda.html (Base Des Amas, Mermilliod 1995).
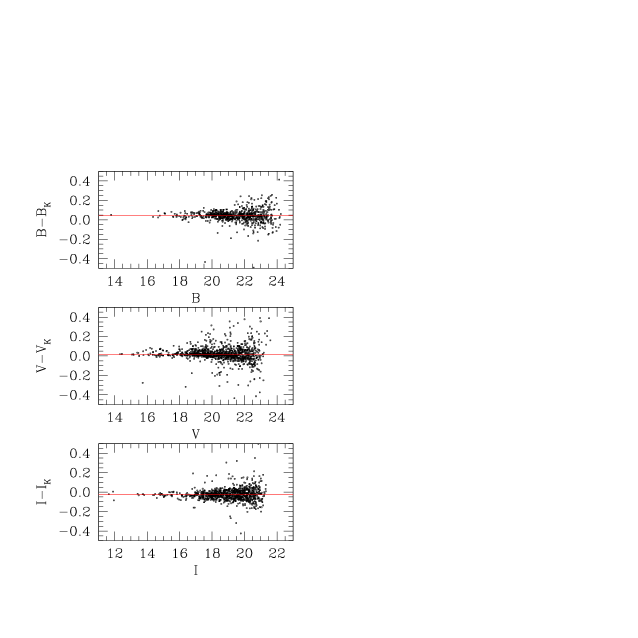
We also identified stars in common between our sample and K94, and a comparison of the two photometries is shown in Fig. 2: they appear to be in reasonable agreement. There is no trend with magnitude, and the average zero point shifts (our photometry minus K94) are of +0.045 mag in , +0.011 mag in , and mag in .
The CMDs for Be 22 based on our photometry are shown in Fig. 3(a,b), while Fig. 3(c,d) show the external comparison field (note that the 2 CMDs are based on a 6.4 6.4 arcmin2 and 9.4 9.4 arcmin2 fields, respectively). The cluster sequences are very well delineated, with a main sequence extending from and or at the turn-off (TO) point down to 23 or 24.5, for about 5 - 6 magnitudes. The subgiant and red giant branches are also visible, even if suffering more from field contamination. The red clump, i.e., the locus of core-He burning stars, is present at and , .
The field contamination shows up both as a component redder than the cluster MS, which is easily identifiable, and a second one, perfectly overimposed to the cluster (see Fig. 3). To try to separate Be 22 from the background we have produced radial CMDs (Fig. 4, with centre at Ra = , Dec = ), showing stars within a given radius, and a portion of the comparison field of same area. The similarity between the resulting MS’s is striking, given that the comparison field is 30 arcmin away from the cluster centre.
A further check of the field component has been done comparing our fields with the Galaxy model by Robin et al. (2003, available at the web site www.obs-besancon.fr/www/modele). We have retrieved the model for an area equivalent to our central field of view located at l =199.8, b = . In Fig. 5(a,b,c) we show Be 22, the external field, and the results of the Besançon model (to which we have applied our incompleteness factors) respectively, all for the same area. We notice immediately an eccess of stars in our external field with respect to the model; they follow the same distribution of Be 22 MS.
Since Be 22 has been proposed, although with some doubts, to be related to the Canis Major galaxy (Martin et al. 2004, Frinchaboy et al. 2004), we have compared our data also to these recently presented by Bellazzini et al. (2004, kindly made available in electronic form by M. Bellazzini), shown in Fig. 5(d), after correcting for the different reddenings, and for an area equal to ours. Again, there are similarities, but the Canis Major sequences are bluer than our cluster.
Judging from Fig. 1 the cluster appears to have a small radius ( a few arcmin, see also K94), but its radial extent is not easily determined from our data. We have computed the radial star density distribution (in annuli 10 arcsec wide), and the profile is shown in Fig. 6. We do not see any strong evidence of flattening, so we can not determine the point where the cluster disappears. This is also consistent with the presence of cluster stars in the external field.
In literature, Be 22 has E() 0.65, without anyone ever suggesting it to be differential. This is what we find also from our data (see next Section): the MS width is perfectly compatible with a single value of reddening, once photometric errors and binaries are taken into account.


4 Cluster parameters
For sake of homogeneity, age, distance and reddening of all the clusters of the BOCCE project are derived with the same synthetic CMD method (Tosi et al. 1991) and the same sets of stellar evolution models (see Kalirai & Tosi 2004 and references therein). The best values of the parameters are found by selecting the cases providing synthetic CMDs with morphology, colours, number of stars in the various evolutionary phases and luminosity functions (LFs) in better agreement with the observational ones. To test the effect of different input physics on the derived parameters, we run the simulations with three different types of stellar evolutionary tracks, assuming different prescriptions for the treatment of convection and ranging from no overshooting to high overshooting from convective regions.
Be 22 has very uncertain metallicity estimates (see the Introduction), hence, we have created the synthetic CMDs adopting, for each type of stellar models, various metallicities. For sake of homogeneity, we keep considering as solar metallicity tracks those with Z=0.02 (i.e. the ones calibrated on the Sun by their authors), although the actual solar metallicity is supposed to be lower (see Asplund et al. 2004).
The adopted sets of stellar tracks are listed in Table 3, where the corresponding references are also given, as well as the model metallicity and the information on their overshooting assumptions. The transformations from the theoretical luminosity and effective temperature to the Johnson-Cousins magnitudes and colours have been performed using Bessell, Castelli & Pletz (1998) conversion tables and assuming E = 1.25 E() (Dean et al. 1978) for all sets of models. Hence, the different results obtained with different stellar models must be ascribed fully to the models themselves and not to the photometric conversions. Different conversion tables can lead to different magnitudes of the synthetic stars and affect our results on the cluster reddening and metallicity. We have however checked that the effect on colours of adopting other conversions is smaller than, or at most comparable to, the photometric errors and not sufficient to introduce metallicity mismatches.
| Set | metallicity | overshooting | Reference |
|---|---|---|---|
| BBC | 0.02 | yes | Bressan et al. 1993 |
| BBC | 0.008 | yes | Fagotto et al. 1994 |
| FRA | 0.02 | no | Dominguez et al. 1999 |
| FRA | 0.01 | no | Dominguez et al. 1999 |
| FRA | 0.006 | no | Dominguez et al. 1999 |
| FST | 0.02 | =0.02 | Ventura et al. 1998 |
| FST | 0.02 | =0.03 | Ventura et al. 1998 |
| FST | 0.006 | =0.02 | Ventura et al. 1998 |
| FST | 0.006 | =0.03 | Ventura et al. 1998 |
The synthetic stars are attributed the photometric error derived from the artificial stars’ tests performed on the actual images. They are retained in (or excluded from) the synthetic CMD according to the completeness factors listed in Table 2. All the synthetic CMDs have been computed either assuming that all the cluster stars are single objects or that a fraction of them are members of binary systems with random mass ratio. We find, as in many other clusters, that a binary fraction around 30% well reproduces the observed distribution along the main sequence. All the synthetic CMDs shown in the figures assume this fraction of binaries. These models reproduce well also the observed colour distribution, thus suggesting that differential reddening does not affect the examined regions of the cluster.
To our knowledge, no studies have been performed on the cluster membership. To reduce the field contamination, without limiting excessively the number of measured stars, we have used as reference for the simulations the CMD of the cluster region within a radius of 2 arcmin from the centre. This central region contains 744 stars with measured and magnitudes. The corresponding CMD is shown in Fig. 7(a). Since an equivalent area of the external field contains 131 stars, we can assume that the cluster members in the central region are presumably 613. The synthetic CMDs have therefore been created with this number of objects. To compare the resulting CMDs and LFs with the empirical ones, we have added to the 613 theoretical stars the 131 objects measured in the external field, which wouldn’t be reproduceable by the models.
Due to the very red colour of Be22, and in spite of the depth of the B frames, only 600 of the 744 central stars have also a measured magnitude (see Fig. 7 b). We used the synthetic CMDs to check the colours and the morphology of the various evolutionary sequences.
We find that with all the adopted sets of stellar tracks only the solar metallicity models are able to reproduce both in and in the colours of the observed CMD sequences. All the other metallicities lead to extended SGBs and excessively red RGBs (once fitting the MS colours), or wrong slopes of the MS, or non self-consistent and MS colours.
The synthetic CMDs in better agreement with the data for each of the three types of models are shown in Fig. 7, where the diagrams of panels c, d and e show the 613 synthetic stars plus the 131 ones of the external field. In the CMDs of panels f, g and h only the synthetic stars with magnitude compatible with the measured B magnitudes are plotted. All the synthetic CMDs seem to underpredict the colour extension of the clump, but the lack of information on the actual cluster membership of the objects observed in that CMD region prevents any firm conclusion on this point.
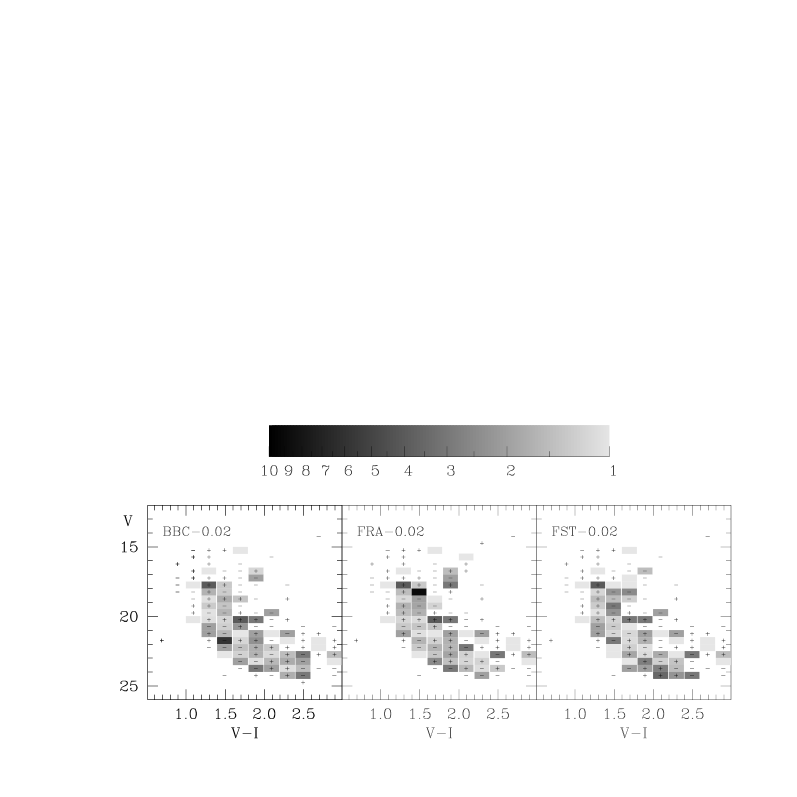
To appreciate the quality of the agreement between the synthetic and the observational diagrams of Fig. 7, we have divided the CMDs in cells and compared the number of synthetic () and observed () stars counted in each cell. Fig. 8 displays the ratio , if , or , if with a logarithmic grey-scale coding. The cell size is 0.5 mag in and 0.2 mag in . The grey level is lightest for =1 and becomes increasingly dark for increasing difference in either direction of synthetic and observed counts. To keep memory of the actual , a plus sign is indicated in all cells where and a minus sign in those where . Cells with no grey filling have no observed stars when a plus is plotted, and have no synthetic stars when a minus is plotted.
The LFs of the best cases for the BBC, FRA and FST models are shown in Fig. 9 (lines) and compared to that of the CMD of Fig. 7(a).
The BBC solar models reproduce quite well the shape and colours of the observed evolutionary sequences, but only for =2.4 Gyr [Fig. 7(c) and (f)] they predict not only the right luminosity but also the right number of clump and RGB stars. The LF (top panel in Fig. 9) is in excellent agreement with the data as well. At lower metallicity the BBC models provide more extended SGBs (hence, redder RGBs) and turn-off hooks, that make their synthetic CMDs less satisfactory than the solar metallicity ones.
The FST solar models also reproduce well the data, if the intermediate overshooting case is chosen. The luminosity and the number of stars of the clump are consistent with the data for whatever age between 2.3 and 2.7 Gyr, but only for =2.5 Gyr is the TO shape in excellent agreement with the observational one [Fig. 7(e) and (h)]. As apparent from the LF of the bottom panel of Fig. 9, the relative number of stars in the different evolutionary phases is slightly less correct than that of the BBC best case, but still very good. On the other hand, these tracks reproduce the observed RGB colour (both in and in better than the others. If the higher overshooting, , models are adopted, the clump is always less populated and the TO tends to come out excessively hooked, independently of the age. At lower metallicity, the FST models predict MS slopes deviating from the observed one, specially in the CMD.
The FRA solar models allow for the best clump reproduction, but have pronounced TO hook and tend to populate the whole RGB, contrary to what is observed. The best compromise is obtained with =2.0 or 2.1 Gyr and, respectively, (m-M)0=14.1 or 14.0, with the same E() =0.65 [Fig. 7(d) and (g)]. At lower metallicity the TO shape worsens, the MS curvature diminishes and the RGB is overpopulated and too red.
The results obtained with the various sets of models are quite consistent with each other, once the known differences in the input physics are taken into account. In fact, we obtain the youngest best fitting age (2.0 or 2.1 Gyr) with the FRA models, without overshooting, the oldest one (2.7 Gyr) with the FST ones with maximum overshooting, and intermediate values with the sets with intermediate overshooting (2.4 Gyr with the BBC models and 2.5 with the FST models). The reddening E() is derived with a very small uncertainty (only 0.005), and the distance modulus (m-M)0 with an uncertainty of 0.15. If we consider only the two best fitting models (BBC and FST), the agreement is even more striking, with =2.4 and 2.5 Gyr, E() =0.64 and 0.65, and (m-M)0=13.8 and 13.9, respectively.
5 Summary and discussion
The application of the synthetic CMD method to Be 22 has allowed us to derive very narrow ranges for the values of its age, distance and reddening. The theoretical uncertainty related to the adoption of different stellar models is significant only on the age, where it inevitably reflects the different overshooting assumptions. Even allowing for a less selective choice of the best cases, the reddening E() always turns out between 0.64 and 0.65, in excellent agreement with the derivations by K94, Janes & Phelps (1994), and the maps by Schlegel et al. (1998). Higher reddenings, of course, are inferred if a metallicity lower than solar is adopted. The BBC models with Z=0.008, the FRA models with Z=0.01 and the FST ones with Z=0.006 all need E() =0.70, the value suggested by Noriega-Mendoza & Ruelas-Mayorga (1997), but none of them reproduces the observed features as well as the solar tracks. We thus favour a solar metallicity for this cluster, despite the existing suggestions for lower abundances.

In fact this cluster could be an important piece in the puzzle regarding the abundance distribution with Galactocentric distance: while almost anyone thinks in term of a radial gradient, Twarog, Ashman & Anthony-Twarog (1997) and more recently Corder & Twarog (2001) presented the case for a step distribution, with clusters closer than 10 kpc from the centre having metallicities different from those of more external objects. Be 22 is farther than 10 kpc, and from our study appears to have solar abundance; if that is confirmed, it would represent a flaw in Twarog et al.’s (1997) reasoning. However, none of the presently available metallicity derivations resides on firm grounds, and we believe that high-resolution spectroscopy is needed for a safe estimate.
As discussed in the previous Section, the distance modulus formally ranges between 13.8 and 14.1, but the very best models indicate (m-M)0=, corresponding to a distance from the Sun of kpc and from the Galactic centre of kpc. This places Be 22 among the outermost old open clusters, second in our BOCCE sample only to Be 29, which is however much farther out, at kpc (Tosi et al. 2004, Carraro et al. 2004) from the centre.
Although affected by a substantial reddening, Be 22 does not show evidence for differential effects. The CMDs of different cluster regions do not present colour shifts, and the synthetic diagrams have the same colour spread of the empirical ones by simply adopting the photometric errors.
Evaporation of low mass stars does not appear to have significantly affected Be 22, contrary to what happens to many open clusters. The synthetic luminosity functions match very well the observational ones both in the inner regions and in the whole surveyed field. Since all the stars born in the cluster, and still alive at the present epoch, which passed the incompleteness tests, are counted in the synthetic LF, this good match indicates that, within the uncertainties, only a minor fraction of the objects born in the examined area can have moved away during the cluster lifetime. Yet, the comparison of the CMD of our external field with those of the cluster field and of the Besançon galactic models suggests that MS stars like those of Be22 and not expected from the models are found also at 30 arcmin from the cluster centre, corresponding, at our derived distance to 52 pc. Is this just a coincidence, or has Be 22 really been able to form stars over such a large area ?
Be 22 has been suggested to belong to the family of the debris of the newly discovered Canis Major satellite (Frinchaboy et al. 2004, Martin et al. 2004), and we have made a direct comparison to it (Fig. 5), finding Be 22 redder than CMa, once considered the different absorptions. Our fields of view are probably too small to address this issue, but the circumstance that neither the CMD of the cluster nor that of our external field appear to contain alien contaminating structures, when compared with the predictions of the Besançon Galactic model, suggests that Be 22 is out of significant streams or overdensity regions. Interestingly enough, we found the same lack of evidence for Be 29, which was also suggested by Frinchaboy et al. to be connected to Canis Major. Admittedly, lack of evidence is not evidence of lack.
ACKNOWLEDGEMENTS
This paper is based on observations collected at the European Southern Observatory, Chile, and at the Italian Telescopio Nazionale Galileo. Most of L.D.F.’s work was done while at the Osservatorio Astronomico di Bologna. We warmly thank P. Montegriffo, whose programs were used in the data analysis, M. Bellazzini for interesting discussions and for providing the Canis Major data, P. Ventura, who kindly provided the unpublished FST models, and L. Angeretti for help with the comparison procedures. We appreciated the constructive comments of the anonymous referee. The bulk of the numerical code for CMD simulations was originally written by L. Greggio. We acknowledge the use of the valuable BDA database, maintained by J.C. Mermilliod, Geneva. This research has made use of the Simbad database, operated at CDS, Strasbourg, France.
References
- [1] Asplund, M., Grevesse, N., Sauval, A.J., Allende Prieto, C., & Kiselman D. 2004, A&A, 417, 751
- [2] Bellazzini, M., Ibata, R., Monaco, L., Martin, N., Irwin, M.J., Lewis, G.F. 2004, MNRAS, 354, 1263
- [3] Bessel, M.S., Castelli, F.,& Plez, B. 1998, A&A, 337, 321
- [4] Bragaglia, A., Carretta, E., Gratton R.G., Tosi, M., Bonanno, G., Bruno, P., Calì, A., Claudi, R.,et al. 2001, AJ, 121, 327
- [5] Bragaglia, A., Tosi, M. 2004, S. Randich, L. Pasquini eds, Chemical Abundances and Mixing in Stars in the Milky Way and its Satellites, Springer-Verlag Series ”ESO Astrophysics Symposia”, in press
- [6] Bressan, A., Fagotto, F., Bertelli, G., & Chiosi, C. 1993, A&AS, 100, 647
- [7] Carraro, G., Bresolin, F., Villanova, S., Matteucci, F., Patat, F., Romaniello, M. 2004, AJ, 128, 1676
- [8] Carretta, E., Bragaglia, A., Gratton, R.G., & Tosi, M. 2004, A&A, 422, 951
- [9] Corder, S., Twarog, B.A. 2001, AJ, 122, 895
- [10] Davis, L.E. 1994, A Reference Guide to the IRAF/DAOPHOT Package, IRAF Programming Group, NOAO, Tucson
- [11] Dean, J.F., Warren, P.R., & Cousins, A.W.J. 1978, MNRAS, 183, 569
- [12] Di Fabrizio, L., Bragaglia, A., Tosi, M., Marconi, G. 2001, MNRAS, 328, 795
- [13] Dominguez, I., Chieffi, A., Limongi, M., & Straniero, O. 1999, ApJ, 524, 226
- [14] Dutra C.M., Bica E. 2000, A&A, 359, 347
- [15] Fagotto, F., Bressan, A., Bertelli, G., & Chiosi, C. 1994, A&AS, 105, 29
- [16] Friel, E.D. 1995, ARAA, 33, 38
- [17] Frinchaboy P.M.. Majewski S.R., Crane J.D., Reid I.N., Rocha-Pinto H.J., Phelps R.L., Patterson R.J., Muñoz R.R. 2004, ApJ, 602, L21
- [18] Gratton R.G. 2000, R. Pallavicini, G. Micela, S. Sciortino eds., Stellar Clusters and Associations: Convection, Rotation ans Dynamos, ASP Conf. Ser., 198, 225
- [19] Janes, K.A. 1979, ApJS, 39, 135
- [20] Janes, K.A., Phelps, R.L. 1994, AJ, 108, 1773
- [21] Kalirai, J.S., & Tosi, M. 2004, MNRAS, 351, 649
- [22] Kaluzny, J. 1994, A&AS, 105, 151 (K94)
- [23] Landolt, A.U. 1992, AJ, 104, 340
- [24] Lata, S., Pandey, A.K., Sagar, R., Mohan, V. 2002, A&A, 388, 158
- [25] Martin N.F., Ibata R.A., Bellazzini M., Irwin, M.J., Lewis G.F., Dehnen W. 2004, MNRAS, 348, 12
- [26] Mermilliod, J.C. 1995, D. Egret, M.A. Albrecht eds, Information and On-Line Data in Astronomy, Kluwer Academic Press (Dordrecht), p. 127
- [27] Noriega-Mendoza, H., Ruelas-Mayorga, A. 1997, AJ, 113, 722
- [28] Panagia, N., Tosi, M. 1981, A&A, 96, 306
- [29] Phelps, R.L., Janes, K.A., Montgomery, K.A. 1994, AJ, 107, 1079
- [30] Robin, A.C., Reylé, C., Derrière S., & Picaud, S. 2003, A&A, 409, 523
- [31] Salaris M., Weiss A., Percival S.M. 2004, A&A, 414, 163
- [32] Sarajedini, A. 1994, AJ, 107, 618
- [33] Schlegel, D.J., Finkbeiner, D.P., Davis, M. 1998 ApJ, 500, 525
- [34] Stetson, P.B. 1987, PASP 99, 191
- [35] Stetson, P.B. 2000, PASP, 112, 925
- [36] Tosi, M., Di Fabrizio, L., Bragaglia, A., Carusillo, P.A., Marconi, G. 2004, MNRAS, 354, 225
- [37] Tosi, M., Greggio, L., Marconi, G., & Focardi, P. 1991, AJ, 102, 951
- [38] Tosi, M., Sabbi, E., Bellazzini, M., Aloisi, A., Greggio, L., Leitherer, C., Montegriffo, P. 2001, AJ, 122, 1271
- [39] Twarog, B.A., Ashman, K.M., Anthony-Twarog, B.A. 1997, AJ, 114, 2556
- [40] Ventura, P., Zeppieri, A., Mazzitelli, I, & D’Antona, F. 1998, A&A, 334, 953