Red variables in the OGLE-II data base – III. Constraints on the three-dimensional structures of the LMC and SMC
Abstract
We present an analysis of the 3-D structure of the Magellanic Clouds, using period–luminosity (P–L) relations of pulsating red giants in the OGLE-II sample. By interpreting deviations from the mean P–L relations as distance modulus variations, we examine the three-dimensional distributions of the sample. The results for the Large Magellanic Cloud, based solely on stars below the tip of the Red Giant Branch, confirm previous results on the inclined and possibly warped bar of the LMC. The depth variation across the OGLE-II field is about 2.4 kpc, interpreted as the distance range of a thin but inclined structure. The inclination angle is about 29∘. A comparison with OGLE-II red clump distances revealed intriguing differences that seem to be connected to the red clump reddening correction. A spatially variable red clump population in the LMC can explain the deviations, which may have a broader impact on our understanding of the LMC formation history. For the Small Magellanic Cloud, we find a complex structure showing patchy distribution scattered within 3.2 kpc of the mean. However, the larger range of the overall depth on every line-of-sight is likely to smooth out significantly the real variations.
keywords:
Magellanic Clouds – stars: late-type – stars: variables – stars: oscillations – stars: AGB and post-AGB1 Introduction
The close proximity of the Magellanic Clouds offers an important opportunity to study in detail the dynamics and composition of these galaxies. One of the important issues that affects our interpretation of the observable parameters is the three-dimensional structure of the Clouds. The Large Magellanic Cloud (LMC) has long been regarded as a thin flat disk seen nearly face-on, but with the east side being closer than the west (Westerlund 1997; see also van der Marel 2004 for an updated review). Recent determinations of the tilt angle place it in the range 30–35∘ (van der Marel & Cioni 2001, Olsen & Salyk 2002, Nikolaev et al. 2004). However, one can find a significantly broader range in the literature (25–45∘, Westerlund 1997), which can at least partly be explained by nonplanar geometry of the inner LMC (Nikolaev et al. 2004). In contrast, the structure of the Small Magellanic Cloud (SMC) has proved difficult to define, mostly because of its large inclination angle. Different distance indicators implied a line-of-sight depth from 7 kpc (O, B and A type stars; Azzopardi 1982) to 6–12 kpc (star clusters; Crowl et al. 2001) and 20 kpc (Cepheids; Mathewson et al. 1986, 1988). It is well established that the asymmetric appearence of the SMC is due almost exclusively to the young population of stars, since the older stellar population shows a very regular distribution (e.g. Zaritsky et al. 2000, Cioni et al. 2000, Maragoudaki et al. 2001).
Time-series observations from microlensing projects such as MACHO (Alcock et al. 2000) and OGLE (Udalski et al. 1992), combined with data from two recent near-infrared surveys, 2MASS (Skrutskie 1998) and DENIS (Epchtein 1998), have provided an unprecedented new wave of high-quality data and a dramatic improvement in statistical analyses. The order-of-magnitude increase in the numbers of well-measured stellar distance indicators has allowed detailed searches for small distance modulus variations across the face of the Clouds. Most recent examples for the LMC include the Cepheid period–luminosity (P–L) relations (Nikolaev et al. 2004), the Asymptotic Giant Branch (AGB) luminosity distribution (van der Marel & Cioni 2001) and the luminosity of core helium-burning red clump stars (Subramaniam 2003, 2004). The basic idea was the same in all these studies: the observed apparent magnitude deviations were translated to distance modulus variations. The analysed fields ranged from the central 4.5 square degrees of the LMC bar (Subramaniam 2003, 2004) to over 300 square degrees, covering the outest parts of the disk (van der Marel & Cioni 2001).
In this Letter we present the first attempt to use red giant P–L relations to constrain the three-dimensional structures of the Clouds. Since the discovery of multiple P–L relations of long-period variables in the LMC (Wood et al. 1999, Wood 2000), there has been strong interest in pulsating red giants and many independent analyses have been published (Cioni et al. 2001, 2003; Noda et al. 2002, 2004; Lebzelter, Schultheis & Melchior 2002; Kiss & Bedding 2003, 2004 – Paper I and Paper II; Ita et al. 2004ab; Groenewegen 2004; Schultheis, Glass & Cioni 2004; Soszyński et al. 2004). Interestingly, none of these studies considered the geometric effects on the apparent magnitudes, as has been done, for instance, by Wray, Eyer & Paczyński (2004), who analysed short-period red giants in the galactic Bulge. The main aim of the present paper is to address this issue and draw conclusions on the line-of-sight distance variations of the Clouds, as traced by pulsating red giants.
2 Data analysis
In this work we used OGLE-II periods and 2MASS Ks magnitudes of red giant variables in the LMC and SMC, as discussed in Papers I and II, where all relevant details on data reduction can be found. Our key assumption here is that the vertical scatter about any particular P–L relation contains information on the relative distances to individual stars. This allows us to examine the magnitude differences from mean P–L relations as a function of position on the sky. Although this sounds simple, we have to ask to what extent this assumption is valid. There are three aspects to the question: (i) star-to-star extinction variations due to interstellar dust; (ii) the contribution of stellar variability to the vertical scatter in the P–L relations; (iii) the intrinsic width of the P–L relations.
| P–L relationa | Number | ||
|---|---|---|---|
| LMC | |||
| R3 (A-) | |||
| R2 (B-) | |||
| SMC | |||
| R3 (A-) | |||
| R2 (B-) | |||
| 3O (A+) | |||
| 2O (B+) | |||
| 1O (C′) | |||
| F (C) | |||
| L2 (D)b | |||
| L2 (D)c | |||
a – abbreviations by Ita et al. (2004a) in parentheses
b – above the tip of the Red Giant Branch
c – below the tip of the Red Giant Branch
(i) The influence of dust absorption in the near-infrared was discussed by van der Marel & Cioni (2001) for the LMC, who concluded that it was only a few hundredths of a magnitude in and could be neglected. This has later been criticised by Nikolaev et al. (2004), who preferred the multi-wavelength approach that involved both distance modulus and extinction variations. Their fig. 7 shows that most of the individual Cepheid reddenings scattered within , which can be translated to a random error , using the extinction law in Schlegel et al. (1998). However, there are also two facts which have to be considered: 1. the Nikolaev et al. sample covered a much larger field of view, where larger extinction variations can occur; 2. Cepheids, as young supergiant stars, are often found close to star forming regions, where the local dust amount might be much higher than the average. Individual reddenings have also been determined by Subramaniam (2003), who analysed exactly the same OGLE-II field of view as us (Udalski, Kubiak & Szymanski 1997), allowing a direct comparison. She found as the maximum reddening dispersion along the bar of the LMC, which corresponds to extinction dispersion in . From these numbers, we conclude that for each star, the uncertainty in due to extinction is likely to be less than 003, possibly around 001, which is indeed negligible if we can take averages over hundreds of stars.
(ii) Since 2MASS magnitudes are single-epoch measurements, intrinsic variability can introduce some uncertainty. For that reason, we decided to use only small-amplitude first ascent Red Giant Branch (RGB) stars in the LMC, of which several thousands were identified in Paper I. Their amplitudes in range from 0005 to 002, so that 2MASS measurements should be within 001–002 of the mean values. The situation is less favourable in the SMC, for which the smaller number of stars (about 3,200 were analysed in Paper II) forced us to use most P–L relations, including both RGB and AGB variables. The latter may have amplitudes up to several tenths of a mag in the infrared (Whitelock, Marang & Feast 2000).
(iii) The horizontal width of the P–L relations is affected by errors arising from period determination and instrinsic scatter caused by astrophysics (e.g., mixing different populations of stars or random and time-dependent excitation of pulsations). Considering P–L ridges R2 and R3, we compared the relations presented in Paper I with those determined by Wood (2000) and Soszyńsky et al. (2004), both based on about 8 years of observations (twice as long as OGLE-II). If the widths were dominated by errors in period determination caused by the short time-span of data, the longer datasets should have led to significantly tighter P–L relations. Somewhat surprisingly, this is not the case: we found the same 0.1 dex width in in all three studies, which implies that the natural width of the relations is probably resolved by OGLE-II alone. We note that errors in period determination can also arise from the fact that the majority of stars show multiply periodic behaviour, so that period uncertainty does not necessarily scale inverse-proportionally with the full time-span. In this work we assumed that the scatter in the P–L relations is partly due to a random error in period, which will be averaged out in a large sample, and that there is a vertical scatter due to a statistical error in the distance moduli estimates.
To calculate distance modulus variations, each star in our sample was classified as lying on one of the P–L relations. To minimize the effects of spurious periods, we only used the dominant period for each star. For the classification, we drew straight line boundaries between the different relations, similarly to Ita et al. (2004b). The results do not depend heavily on the exact definition of these lines because the majority of the stars lie away from the boundaries. To distinguish between AGB and RGB stars, we adopted TRGB magnitudes from Paper II. We then made linear least-squares fits to each of the P–L relations. Because of the non-zero width and the rhomboid-shaped P–L ridges, these fits were performed as inverse regressions in the form of (Table 1), which were then converted back to usual P–L relations in form of . For a star at a given period, the vertical difference between its observed magnitude and the linear fit was taken as the distance modulus of that star relative to the average distance of the host galaxy. Because of the relatively large scatter in these distance moduli, caused by the issues discussed above, it was helpful to bin the distance data to see the underlying trends. When combining the results from different P–L relations, each measured distance modulus was weighted by the overall scatter (combined with the number of points) in its P–L relation. This gave more weight to the distances based on the P–L relations that had the tightest overall correlations.
3 Results
3.1 Structure of the LMC
The results presented here for the LMC used only the R3 and R2 period-luminosity relations from Paper I, i.e. those below the TRGB (sequences A- and B- in Ita et al. 2004a). They had by far the tightest relations and gave the best distance measurements; 4,276 stars were used for the LMC.
The OGLE-II data are limited to the region around the bar of the LMC, which lies approximately in the east-west direction. Therefore, the obvious way to bin the data was in Right Ascension. This is the same approach as used by Subramaniam (2003, 2004), who analysed dereddened OGLE-II red-clump magnitude variations in terms of relative distance variations. She has kindly provided her data and we compare these with our results in Fig. 1. To overlay the Subramaniam distance moduli, we subtracted their weighted mean value ((). Larger values in Fig. 1 refer to those parts of the LMC that are further from us. The uncertainty in each RA bin was calculated from the scatter of the distance moduli that were combined to make that point.

It is clear from Fig. 1 that red giant P–L relations alone reveal that the bar is inclined away from us, running east-west. This is in perfect agreement with the general view of the LMC (Westerlund 1997). The magnitude variations can be translated to distance variations by assuming a distance modulus to the LMC of (Alves 2004a), corresponding to 50.1 kpc mean distance. The maximum distance modulus range we observe in the LMC is 01003 (calculated from a linear fit between RA=77∘ and 87∘), which can be translated to 2.40.7 kpc distance variation. We interpret this as the distance range of a thin but inclined structure, where the thickness of the LMC bar is assumed to vary less than the mean distance along any given line-of-sight. Using Fig. 1 and the assumed LMC distance, an inclination angle of 29 degrees (with a formal error of several degrees) can be determined. However, note that OGLE-II data are not well suited for inclination angle determination because the field of view is highly linear so the position angle of the node, along which the inclination angle has to be measured, is weakly constrained. In this sense, the inclination angle we determined is a lower limit to the real value. Nevertheless, our 29∘ is in good agreement with recent inclination angle determinations (e.g., van der Marel & Cioni 2001, Nikolaev et al. 2004).
There is also evidence for substructures within the bar as deviations from a straight line in Fig. 1. Similar substructures were recently found by Subramaniam (2003, 2004), who interpreted red clump magnitude variations as evidence of a misaligned secondary bar within the primary one. There appears to be good consistency between the two data sets, with the distance values mostly agreeing to within 1. However, there are also some discrepancies, most prominently at RA and RA. At these position there are two 005 dips in the Subramaniam data but not in our data (although we have fewer data points, so that the 2-3 differences may arise purely from statistical fluctuation). There are two reasons to believe that our data in these regions are to be preferred. Firstly, optical and narrow-band H images show prominent HII regions in the quoted positions (e.g. giant shells No. 51, 54 and 60 at RA and No. 77 at RA in Kim et al. 1999), which suggests that the difference may indicate undercorrected extinction in the -band data used by Subramaniam (2003). Secondly, the two RAs where we found the largest deviations coincide exactly with the positions where the average reddening values show sudden jumps in fig. 2 of Subramaniam (2003). Both facts imply that the red clump method (developed by Olsen & Salyk 2002 and used by Subramaniam 2003) may be affected by a systematic error that is related to the red clump reddening determination.
The red clump method assumes the red clump has constant colour everywhere in the LMC. Since we used reddening-insensitive -band data for red giants, the discrepancy with clump results implies the intrinsic colour of the clump must be redder than the assumed constant value (=092, Olsen & Samolyk 2002), and this probably shows a change in the mean red clump population. Alves (2004a) showed that population effect on model red-clump colour-magnitude diagrams can significantly affect distances derived from and band red clump data. Our findings can be explained by a spatially varying clump population in the LMC, which may have broad implications for understanding the LMC bulge/halo/disk structure and formation history, as discussed recently by Alves (2004b) and Zaritsky (2004).
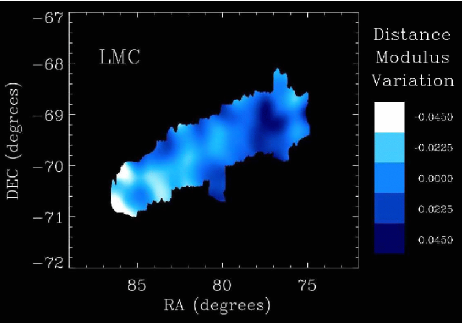
To search for structure in the Declination direction we created a 3-D representation of the LMC in which the relative distance modulus is shown in grey scale (Fig. 2). This figure was made using a two-dimensional averaging with a Gaussian weight-function (). This representation makes the depression at RA quite prominent. The overall appearance shows the tilt of the bar, with no measurable systematic trend along Declination within the OGLE-II field of view.
3.2 Structure of the SMC
In the SMC the smaller number of stars led us to use more P–L relations to reduce the errors. We included P–L ridges R3, R2, 3O, 2O, 10, F and L2 (A-, B-, A+, B+, C′, C and D in Ita et al. 2004a); these were the only relations for which reasonable boundaries could be defined, due to the larger scatter in the SMC. As for the LMC, we weighted the results by the corresponding scatter in each P–L relation, so that better-defined relations received higher weight.
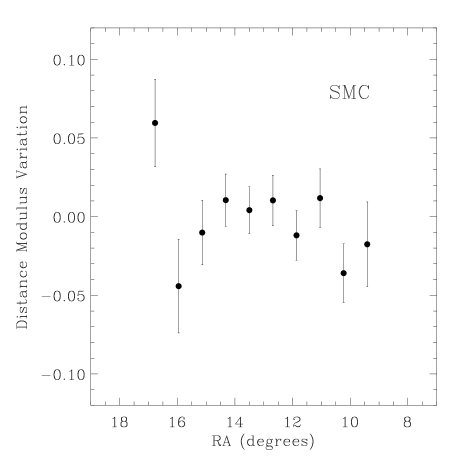
The resulting distance modulus variations are plotted in Fig. 3. The uncertainties are considerably larger than for the LMC, which is partly due to having fewer stars and partly due to the known larger depth of the SMC (cf. Sect. 1). The latter effect is particularly prominent in fig. 9 of Ita et al. (2004a): all ridges, without exception, are significantly thicker, including those of the fundamental and first overtone Cepheids. For that reason it would be misleading to conclude from Fig. 3 that no relative distance modulus variations occur in the SMC. There are hints of substructures but their interpretation is difficult because the mean distance modulus is a complicated function of stellar distribution along the line of sight. Formally, the given distance modulus variations correspond to a distance range of 3.21.6 kpc, adopting (Paper II), which, contrary to the LMC, is likely to be more affected by the overall depth on every line-of-sight. A better depth measurement would require a study of the vertical scatter along individual P–L ridges, but for that purpose, these red giant P–L relations in the SMC are less useful because they are too close to each other in the P–L plane, which makes it more difficult to distinguish between members of different ridges.
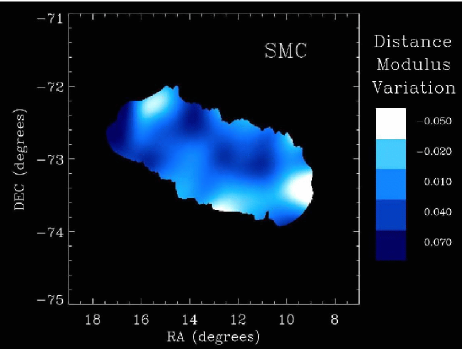
Finally, the 3-D representation of the SMC (Fig. 4) shows that both the north-eastern and the south-western corners of the OGLE-II field are slightly closer to us, while there is a system of depressions along the northern boundary. Interestingly, the two deepest “holes” (at RA14∘ and 11∘) coincide exactly with the two major concentrations of red giant (RGB and AGB) stars in figs. 6-7 in Cioni et al. (2000), thus they represent significant extensions of the main body of the SMC, inclined further away from us.
4 Conclusions
We have demonstrated the usefulness of pulsating red giants as distance indicators in external galaxies by measuring the 3-D structures of the Magellanic Clouds. In particular, the variables below the tip of the Red Giant Branch are numerous and their narrow P–L relations are real competitors to those of the Cepheid variables. About a year of continuous monitoring gives very well-defined P–L relations for those stars, which have periods between 15 and 50 days. Because of the much lower amplitudes, intrinsic variability introduces negligible vertical scatter in the relations. This is, of course, a major observational obstacle: one has to reach the several millimagnitude precision over the whole photometric monitoring period, which should be as continuous as possible. For that reason, red giant P–L relations in general can be considered as giving supplementary information to other distance indicators, although high-amplitude red giants have already been used for measuring a stand-alone extragalactic distance to NGC 5128=Cen A (Rejkuba 2004).
From an analysis of almost 4,300 RGB variables in the LMC we determined spatial depth of the LMC bar as a function of celestial position. The results are in good agreement with those based on other distance indicators (Cepheids, red clump stars, AGB luminosity distributions), but are perhaps less affected by dust. We also found possible evidence for spatial variations in the red clump population in the LMC, which suggests that the assumption of constant red-clump colour over the whole LMC may not be valid. For the Small Magellanic Cloud, we found a patchy structure with the two major concentrations of late-type stars displaced a few () kiloparsecs further away. However, the vertical widths of red giant P–L relations seem to be significantly higher in the SMC, which can be attributed to the larger spatial depth range of the galaxy. Because of this, the calculated depth change is likely to be seriously affected and the interpretation of the results should be made with care.
Acknowledgments
This work has been supported by the OTKA Grant #T042509 and the Australian Research Council. P. Lah received a Vacation Scholarship for this project from the School of Physics, University of Sydney. L.L. Kiss is supported by a University of Sydney Postdoctoral Research Fellowship. Thanks are due to an anonymous referee for very helpful comments and suggestions. We also thank Dr. A. Subramaniam for providing her red clump distance data for the LMC. This research has made use of the NASA/IPAC Infrared Science Archive, which is operated by the Jet Propulsion Laboratory, California Institute of Technology, under contract with the National Aeronautics and Space Administration. The NASA ADS Abstract Service was used to access data and references.
References
- [] Alcock C., et al., 2000, ApJ, 542, 281
- [] Alves D. R., 2004a, New Astronomy Reviews, 48, 659
- [] Alves D. R., 2004b, ApJ, 601, L151
- [] Azzopardi M., 1982, Comptes Rendus sur les Journées de Strasbourg, Observatoire de Strasbourg, p. 20
- [] Cioni M.-R. L., Habing H. J., & Israel F. P., 2000, A&A, 358, L9
- [] Cioni M.-R. L., Marquette J. B., Loup C., Azzopardi M., Habing H. J., Lasserre T., & Lesquoy E., 2001, A&A, 377, 945
- [] Cioni M.-R. L. et al., 2003, A&A, 406, 51
- [] Crowl H. H., Sarajedini A., Piatti A. E., Geisler D., Bica E., Clariá J. J., & Santos Jr. J. F. C., 2001, AJ, 122, 220
- [] Epchtein N., 1998, IAU Symp. 179, 106
- [] Groenewegen M. A. T., 2004, A&A, in press (astro-ph/0404561)
- [] Ita Y. et al., 2004a, MNRAS, 347, 720
- [] Ita Y. et al., 2004b, MNRAS, in press (astro-ph/0312079)
- [] Kim S., Dopita M. A., Staveley-Smith L., & Bessell M. S., 1999, AJ, 118, 2797
- [] Kiss L. L., Bedding T. R., 2003, MNRAS, 343, L79 (Paper I)
- [] Kiss L. L., Bedding T. R., 2004, MNRAS, 347, L83 (Paper II)
- [] Lebzelter T., Schultheis M., & Melchior A. L., 2002, A&A, 393, 573
- [] Maragoudaki F., Kontizas M., Morgan D. H., Kontizas E., Dapergolas A., & Livanou E., 2001, A&A, 379, 864
- [] Mathewson D. S., Ford V. L., & Visvanathan N., 1986, ApJ, 301, 664
- [] Mathewson D. S., Ford V. L., & Visvanathan N., 1988, ApJ, 333, 617
- [] Nikolaev S., Drake A. J., Keller S. C., Cook K. H., Dalal N., Griest K., Welch D. L., & Kanbur S. M., 2004, ApJ, 601, 260
- [] Noda S. et al., 2002, MNRAS, 330, 137
- [] Noda S. et al., 2004, MNRAS, 348, 1120
- [] Olsen K. A. G., & Salyk C., 2002, AJ, 124, 2045
- [] Rejkuba M., 2004, A&A, 413, 903
- [] Schlegel D. J., Finkbeiner D. P., & Davis M., 1998, ApJ, 500, 525
- [] Schultheis M., Glass I. S., & Cioni M.-R. L., 2004, A&A, in press (astro-ph/0408126)
- [] Skrutskie M., 1998, in: The Impact of Near-Infrared Sky Surveys on Galactic and Extragalactic Astronomy, ed. N. Epchtein, Dordrecht: Kluwer, 11
- [] Soszyński I., Udalski A., Kubiak M., Szymański M., Pietrzyński G., Żebruń K., Szewczyk O., & Wyrzykowski Ł, 2004, Acta Astron., 54, 129
- [] Subramaniam A., 2003, ApJ, 598, L19
- [] Subramaniam A., 2004, ApJ, 604, L41
- [] Udalski A., Szymanski M., Kaluzny J., Kubiak M., & Mateo M., 1992, Acta Astron., 42, 253
- [] Udalski A., Szymanski M., & Kubiak M., 1997, Acta Astron., 47, 319
- [] Westerlund B. E., 1997, The Magellanic Clouds, Cambridge University Press, Cambridge
- [] van der Marel R. P., & Cioni M.-R. L., 2001, AJ, 122, 1807
- [] van der Marel R. P., 2004, in: “The Local Group as an Astrophysical Laboratory”, Proceedings of the May 2003 STScI Symposium, ed. M. Livio, Cambridge University Press, in press (astro-ph/0404192)
- [] Whitelock P., Marang F., & Feast M., 2000, MNRAS, 319, 728
- [] Wood P. R., 2000, PASA, 17, 18
- [] Wood P. R. et al., 1999, IAU Symp., 191, p. 151
- [] Wray J. J., Eyer L., & Paczyński B., 2004, MNRAS, 349, 1059
- [] Zaritsky D., Harris J., Grebel E. K., & Thompson I. B., 2000, ApJ, 534, L53
- [] Zaritsky D., 2004, ApJ, submitted (astro-ph/0408533)