Discovery of a Radio Source following the 27
December 2004 Giant Flare from SGR 180620
On 3 January 2005 we observed SGR 180620 with the Very Large Array (VLA) and identified and promptly reported[Cameron & Kulkarni¡6¿] a new radio source at right ascension 18h08m39.34s and declination (with an uncertainty of ” in each coordinate) coincident with the quiescent X-ray counterpart[Kaplan et al.¡7¿]. In Table 1 we report the results of a subsequent monitoring program undertaken with the VLA, the Giant Metrewave Radio Telescope (GMRT), the Australia Telescope Compact Array (ATCA), the Nobeyama Millimeter Array (NMA) and the Institut de Radioastronomie Millimtrique (IRAM) 30m Telescope.
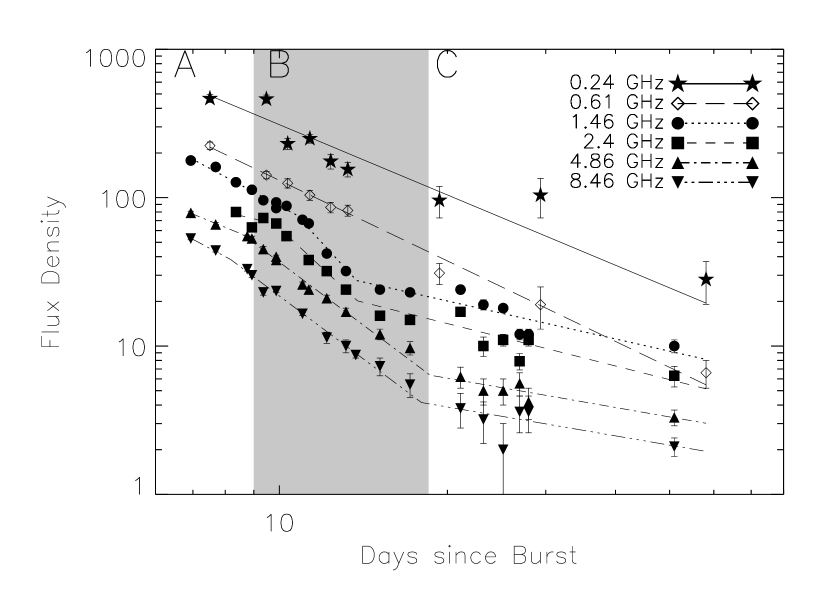
The radio source decays in all frequency bands, but the behaviour is complex (Figure 1). At each band we model the flux by a power law, , but allow for changes in the temporal indices (“breaks”) at two epochs. These breaks are clearly seen in our highest signal-to-noise ratio data. Following the first break (9 days, postburst) the light curve steepens to . The radio source[Frail, Kulkarni & Bloom¡8¿] from SGR 1900+14 following the 27 August 1998 giant flare[Feroci et al.¡9¿] showed a similar rapid decay at 8 GHz. Subsequently around day 14 the light curve flattens to . At any given epoch, the radio spectrum can be modeled by a power law, . The spectral index, , steepens with time, changing from to (see Figure 1 and Supplemental Information).
We confirm claims that the source is resolved[Gaensler et al.¡10¿] by an independent analysis. We find that it is elongated with a major axis milliarcsecond (mas) and an axial ratio of 2:1 (Table 2). We considered four expansion models, with unconstrained and plausible expansion models (, 2/5, and 1). The best fit model corresponds to no expansion (). However, due to the limited range of our observations we prefer not to model the dynamics of the explosion.
We took advantage of the brightness of the radio source and obtained a high resolution spectrum (Figure 2, second panel) centered around the 21-cm line of atomic Hydrogen (HI). Intervening interstellar clouds appear as absorption features in the spectrum. These clouds are expected to participate in the rotation of the Galaxy and the absorption features allow us to infer “kinematic” distance estimates. Such estimates have several complications. First, in the inner Galaxy the radial velocity curve is double-valued (see Figure 2, third panel) leading to a “near” distance estimate (dl) and a “far” distance estimate (du) for each velocity. Second, in some directions, there are features with non-circular motion e.g. the “3-kpc expanding arm” and the “ km s-1 spiral arm”[Corbel & Eikenberry¡11¿]. Finally, in the innermost part of the Galaxy there is a deficit of cold gas[Kolpak et al.¡12¿].
Significant HI absorption toward SGR 180620 is seen over the velocity range 20 km s-1 to +85 km s-1 (Figure 2, second panel). There is also a weak (2.5-) absorption feature coincident in velocity with a clearly detected 12CO(1-0) emission feature identified[Corbel et al.¡13¿] as MC94 (Figure 2, first panel). Adopting a simple Galactic rotation curve with a circular velocity km s-1 and a Galactic center distance R∘=8.5 kpc, the near distance to SGR 180620 (for VLSR=95 km s-1) is dl=6.4 kpc.
The two HI emission clouds seen at velocities above 100 km s-1 toward SGR 180620 (Figure 2, first panel), with no corresponding HI absorption, may be used to infer an upper limit to the distance provided that we can be reasonably certain that cold neutral gas exists at these velocities. The HI absorption spectrum toward the nearby () extragalactic source J18112055 shows a strong and broad absorption feature between 110 and 130 km s-1 (Figure 2, fourth panel). The only HI emission in this direction[Hartmann & Burton¡14¿] above 60 km s-1 corresponds to an HI cloud at this same velocity. This feature can be traced in absorption toward several other extragalactic radio sources in this direction [Garwood & Dickey¡15¿], suggesting that cold gas at 120 km s-1 is widespread. Adopting the same Galactic rotation curve as above, the absorbing cloud at +120 km s-1 can either be located at 7 kpc or 9.8 kpc (see Figure 2, third panel). We thus suggest an upper limit to the distance, du=9.8 kpc.
Our new distance estimate is smaller than previous (indirect) values[Figer, Najarro & Kudritzki¡16¿, Corbel & Eikenberry¡11¿] of 12 to 15 kpc. Accepting our estimate has several important implications. It results in a reduction of the total energy released () as well as the rate of such events in nearby galaxies[Nakar et al.¡17¿] (), and calls into question the association[Fuchs et al.¡18¿] of SGR 180620 with a star cluster along the same line-of-sight. Therefore, claims that magnetars originate from more massive stars than normal neutron stars[Gaensler et al.¡19¿] may be called into question.
Next we consider the energetics of the material giving rise to the radio emission. As with many other radio sources, the power law spectrum can be attributed to energetic electrons with a power law energy distribution (; here is the Lorentz factor of electrons and we measure on day 7, which as is a typical value for strong shocks) which gyrate in a magnetic field and emit synchrotron radiation. We apply the minimum energy formulation for synchrotron sources[Pacholczyk¡20¿, Scott & Readhead¡21¿] to the radio spectrum (from 0.2 GHz to 100 GHz) of 3 January 2005 and find the energy of the radio emitting source and the associated magnetic field strength are erg and mG; here, the distance is 10 kpc and the angular diameter is 75 mas (Table 2).
Evidently the amount of energy released in the -ray flare, erg s-1 (assuming unbeamed, isotropic emission), substantially exceeds . In contrast, the ratio is unity for GRBs and as a result the lower energy and longer duration emission is correctly regarded as arising from the shock of the circumburst medium (the “afterglow” model). Thus, based solely on energetics, there is no prima facie reason to suggest that the radio source is the afterglow of the -ray flare.
Furthermore, as discussed above, the radio emission decays quite rapidly 9 days after the burst. Such a rapid decay is incompatible with the afterglow model (in the non-relativistic limit) for which we expect[Frail, Waxman & Kulkarni¡22¿] . We conclude (in contrast to refs. ?, ? and ?) that the radio emission must be powered by something very different from that which produced the -ray emission.
In summary, the radio emission can be described by two components: a rapidly decaying component and a slowly decaying component. The latter becomes detectable when the former has decayed significantly. The rapid decay is phenomenologically similar to that seen from accreting Galactic sources (e.g. ref. ?) – the so-called “plasmon” model framework in which the radio emission arises from a ball of electrons and magnetic field which are initially shocked and then cool down by expansion. We make the specific suggestion that the radio emission up until about 2 weeks is a result of the shocking of the debris given off in the explosion (the “reverse shock”). In this framework the slowly decaying component is the emission arising from the forward shock as the ejecta slams into the circumburst medium. A requirement of this suggestion is that the energy inferred in the slowly decaying component should be comparable to . Separately, we note that the comparable ratios and the temporal and spectral similarities of the giant flares from SGR 180620 and SGR 190014 suggest a common mechanism for launching these flares and similar circumstellar environments.
Regardless of the suggestions and speculations, it is clear that radio afterglow is telling us something entirely different from that revealed by the -ray emission. If our suggestion of a reverse shock origin is correct then radio observations allow us to probe the ejecta. Taken together it appears that rapid and intense radio monitoring of such flares will be highly fruitful in the future.
References
- [Kulkarni & Frail¡1¿] Kulkarni, S. R. & Frail, D. A. Identification of a supernova remnant coincident with the soft gamma-ray repeater SGR1806-20. Nature 365, 33–35 (1993).
- [Murakami et al.¡2¿] Murakami, T., Tanaka, Y., Kulkarni, S. R., Ogasaka, Y., Sonobe, T. et al. X-Ray Identification of the Soft Gamma-Ray Repeater 1806-20. Nature 368, 127–128 (1994).
- [Woods & Thompson¡3¿] Woods, P. M. & Thompson, C. Soft gamma repeaters and anomalous x-ray pulsars: Magnetar candidates. To appear in ’Compact Stellar X-ray Sources’, eds. W.H.G. Lewin and M. van der Klis; astro-ph/0406133 (2004).
- [Borkowski et al.¡4¿] Borkowski, J., Gotz, D., Mereghetti, S., Mowlavi, N., Shaw, S. et al. Giant flare from Sgr 1806-20 detected by INTEGRAL. GRB Circular Network 2920, 1–+ (2004).
- [Boggs et al.¡5¿] Boggs, S., Hurley, K., Smith, D. M., Lin, R. P., Hurford, G. et al. SGR 1806-20, RHESSI observations of the 041227 giant flare. GRB Circular Network 2936, 1–+ (2005).
- [Cameron & Kulkarni¡6¿] Cameron, P. B. & Kulkarni, S. R. VLA observations of Sgr 1806-20. GRB Circular Network 2928, 1–+ (2005).
- [Kaplan et al.¡7¿] Kaplan, D. L., Fox, D. W., Kulkarni, S. R., Gotthelf, E. V., Vasisht, G. et al. Precise Chandra Localization of the Soft Gamma-Ray Repeater SGR 1806-20. ApJ 564, 935–940 January 2002.
- [Frail, Kulkarni & Bloom¡8¿] Frail, D. A., Kulkarni, S. R. & Bloom, J. S. An outburst of relativistic particles from the soft gamma-ray repeater SGR 1900+14. Nature 398, 127–129 (1999).
- [Feroci et al.¡9¿] Feroci, M., Hurley, K., Duncan, R. C. & Thompson, C. The Giant Flare of 1998 August 27 from SGR 1900+14. I. An Interpretive Study of BeppoSAX and Ulysses Observations. Astrophys. J. 549, 1021–1038 March 2001.
- [Gaensler et al.¡10¿] Gaensler, B. M., Kouveliotou, C., Wijers, R., Garrett, M., Finger, M. et al. Second-epoch VLA observations of Sgr 1806-20. GRB Circular Network 2933, 1–+ (2005).
- [Corbel & Eikenberry¡11¿] Corbel, S. & Eikenberry, S. S. The connection between W31, SGR 1806-20, and LBV 1806-20: Distance, extinction, and structure. Astr. Astrophys. 419, 191–201 (2004).
- [Kolpak et al.¡12¿] Kolpak, M. A., Jackson, J. M., Bania, T. M. & Dickey, J. M. The Radial Distribution of Cold Atomic Hydrogen in the Galaxy. Astrophys. J. 578, 868–876 (2002).
- [Corbel et al.¡13¿] Corbel, S., Wallyn, P., Dame, T. M., Durouchoux, P., Mahoney, W. A. et al. The Distance of the Soft Gamma Repeater SGR 1806-20. Astrophys. J. 478, 624 (1997).
- [Hartmann & Burton¡14¿] Hartmann, D. & Burton, W. B. Atlas of galactic neutral hydrogen. Cambridge University Press Cambridge; New York (1997).
- [Garwood & Dickey¡15¿] Garwood, R. W. & Dickey, J. M. Cold atomic gas in the inner Galaxy. Astrophys. J. 338, 841–861 (1989).
- [Figer, Najarro & Kudritzki¡16¿] Figer, D. F., Najarro, F. & Kudritzki, R. P. The Double-lined Spectrum of LBV 1806-20. Astrophys. J. 610, L109–L112 August 2004.
- [Nakar et al.¡17¿] Nakar, E., Gal-Yam, A., Piran, T. & Fox, D. B. The distances of short-hard GRBs and the SGR connection. astro-ph/0502148 (2005).
- [Fuchs et al.¡18¿] Fuchs, Y., Mirabel, F., Chaty, S., Claret, A., Cesarsky, C. J. et al. ISO observations of the environment of the soft gamma-ray repeater SGR 1806-20. Astr. Astrophys. 350, 891–899 (1999).
- [Gaensler et al.¡19¿] Gaensler, B. M., McClure-Griffiths, N. M., Oey, M. S., Haverkorn, M., Dickey, J. M. et al. A Stellar Wind Bubble Coincident with the Anomalous X-Ray Pulsar 1E 1048.1-5937: Are Magnetars Formed from Massive Progenitors? Astrophys. J. 620, L95–L98 February 2005.
- [Pacholczyk¡20¿] Pacholczyk, A. G. Radio astrophysics. Nonthermal processes in galactic and extragalactic sources. Series of Books in Astronomy and Astrophysics, San Francisco: Freeman, 1970 (1970).
- [Scott & Readhead¡21¿] Scott, M. A. & Readhead, A. C. S. The low-frequency structure of powerful radio sources and limits to departures from equipartition. Mon. Not. R. astr. Soc. 180, 539–550 September 1977.
- [Frail, Waxman & Kulkarni¡22¿] Frail, D. A., Waxman, E. & Kulkarni, S. R. A 450 Day Light Curve of the Radio Afterglow of GRB 970508: Fireball Calorimetry. Astrophys. J. 537, 191–204 (2000).
- [Cheng & Wang¡23¿] Cheng, K. S. & Wang, X. Y. The Radio Afterglow from the Giant Flare of SGR 1900+14: The Same Mechanism as Afterglows from Classic Gamma-Ray Bursts? Astrophys. J. 593, L85–L88 (2003).
- [Nakar, Piran & Sari¡24¿] Nakar, E., Piran, T. & Sari, R. Giant flares as mini gamma ray bursts. astro-ph/0502052 (2005).
- [Wang et al.¡25¿] Wang, X. Y., Wu, X. F., Fan, Y. Z., Dai, Z. G. & Zhang, B. An energetic blast wave from the december 27 giant flare of soft -ray repeater 180620. astro-ph/0502085 (2005).
- [Hjellming et al.¡26¿] Hjellming, R. M., Rupen, M. P., Hunstead, R. W., Campbell-Wilson, D., Mioduszewski, A. J. et al. Light Curves and Radio Structure of the 1999 September Transient Event in V4641 Sagittarii (=XTE J1819-254=SAX J1819.3-2525). Astrophys. J. 544, 977–992 (2000).
Supplementary Information accompanies the paper on www.nature.com/nature.
Acknowledgements
ATCA is funded by the Commonwealth of Australia for operation as a National Facility managed by CSIRO. We thank K. Newton-McGee and B. Gaensler for scheduling and performing observations with the ATCA. GMRT is run by the National Centre for Radio Astrophysics-Tata Institute of Fundamental Research, India. We thank the GMRT staff and in particular C. H. Ishwara-Chandra and D. V. Lal for help with observations and analysis. The VLA is a facility of the National Science Foundation operated under cooperative agreement by Associated Universities, Inc. NMA is a branch of the National Astronomical Observatory, National Institutes of Natural Sciences, Japan. IRAM is supported by INSU/CNRS (France), MPG (Germany) and IGN (Spain). We thank A. Weiss from IRAM for help with the observations. We gratefully acknowledge S. Corbel, S. S. Eikenberry and R. Sari for useful discussions. Our work is supported in part by the NSF and NASA.
Correspondence and requests for materials should be addressed to P.B.C. (pbc@astro.caltech.edu).
FIGURES & CAPTIONS
Table 1: Flux density measurements of the transient radio counterpart to
SGR 180620 from the VLA, GMRT, NMA, and ATCA as a function of frequency
and time. The reported errors are 1-. In addition to these
measurements, we obtained IRAM-30m observations on 8 and 9 January
2005 using MAMBO-2 at 250 GHz which show no detection with a value
of mJy at the position of the radio source. Finally,
we detect linearly polarized emission from the source at the 1.5%
to 2.5% level. See the Supplemental Information for observational
details.
a The epoch of the flare, , was 27.90 December
2004.
b ATCA observations in this column have a frequency of
8.6 GHz.
c These values represent 2 upper limits.
d The frequency is 1.06 GHz for the 16.37 January 2005 and 4.01
February 2005 GMRT observations.
Figure 1: Broadband temporal behavior of the transient radio source coincident with SGR 180620. The abscissa indicates days elapsed since the giant flare on 27.90 December 2004. The displayed flux density measurements (denoted with symbols) were obtained in six frequency bands with the VLA, GMRT, and ATCA (Table 1). The error bars denote 1- uncertainties. With the exception of the 6.1 GHz data (which is insufficiently sampled at early and late times and is not shown), the light curves with GHz are best fit by power-law models (shown as lines, ) with two breaks at days and days (see the Supplemental Information for exact values). The temporal index varies chromatically in the time before and after the first break (denoted by regions A and B respectively). The exponent value ranges from and ; here the subscript identifies the region of interest. After day (region C) the source decay flattens to at these frequencies which persists until day 51. Region B, the period of steep light curve decline, is shaded gray. The light curves with GHz do not show these temporal breaks or late time flattening Apparently a single power law decay model with (0.24 GHz) and (0.61 GHz) provides a good statistical description of the data.
Our substantial frequency coverage (over three decades) allows
an excellent characterization of the spectrum. The spectrum
is consistent with a single power law slope ()
at all epochs. On day 7, before the first temporal break, we find . The spectrum steepens to a value of (day 15), reaching (days 21–51).
Table 2: Source size measurements and 95% confidence limits of the radio source as measured with the VLA at 8.46 GHz. The source is clearly resolved at all VLA epochs. The best constraints on the source size come from the observations which occurred closest to the transit of the source on Jan 3rd and Jan 6th. The result is a source with size mas with an axial ratio of and a position angle (PA) of 60 degrees (measured clockwise from the North). The flux centroid did not change position within the limits of our astrometric accuracy ( 100 mas).
The best fit model is consistent with no expansion,
() with a
with 4 degrees of freedom.
Sedov-Taylor () and free expansion () model were also fit, and
yield and , respectively. These fits
have five
degrees of freedom.
See the Supplemental Information for the details of the source size
measurements.
Figure 2: Cold atomic and molecular hydrogen spectra toward SGR 180620. These spectra were used to derive a distance estimate for SGR 180620.
(Top Panel). HI emission
(upper curve, thick line) in the direction of SGR 180620, determined
by averaging two adjacent spectra taken by Hartmann &
Burton[Hartmann & Burton¡14¿] at =(10.0∘,0.0∘) and
=(10.0∘,). The lower curve (thin line)
is the 12CO(10) spectrum (from ref. ?).
For display purposes the brightness temperature has been
scaled up by a factor of 11.4.
(Second Panel).
The HI absorption spectrum taken toward SGR 180620.
The two horizontal bars illustrate the radial velocity
measurements[Figer, Najarro & Kudritzki¡16¿, Corbel & Eikenberry¡11¿] of the nearby star LBV 180620
(3610 km s-1 and 10 20 km s-1).
The absorption spectra were
made with the Very Large Array on 4 January 2005, using a 1.56
MHz bandwidth in both hands of polarization centered 50
km s-1 with respect to the local standard of rest. The bandwidth
was divided into 256 channels each 6.1 kHz in width, or a velocity
resolution of 1.3 km s-1 covering a velocity range of 115
km s-1 to 215 km s-1.
(Third Panel). The distance as a function of radial velocity adopting a
simple Galactic rotation curve with a circular velocity
km s-1 and a galactic center distance
R∘=8.5 kpc.
(Bottom Panel). The HI absorption spectrum
of nearby extragalactic source J18112055 at
=(9.8∘,).
The lower limit to the distance is firmly established by the 95 km s-1 absorption feature from MC94 (see Text). An upper limit to the distance of the SGR is suggested by the absence of strong absorption at +120 km s-1, seen toward J18112055 and several other extragalactic radio sources in this direction[Garwood & Dickey¡15¿]. One could argue that the 120 km s-1 cold cloud is small and not present along the line-of-sight to the SGR 180620. However, this hypothesis also requires the absence of any other cloud between 95 km s-1 (distance of 6.4 kpc) and 86 km s-1 (distance of 10.6 kpc). The mean absorption coefficient drops in the inner Galaxy () kpc, giving a mean free path between clouds of 2.3 kpc[Garwood & Dickey¡15¿]. The distance interval from 6.4 kpc to 10.6 kpc corresponds to mean free paths. So, the probability of finding no clouds in this gap is 16%. Thus our upper limit of 9.8 kpc is not a certainty but quite likely.
| S0.24 | S0.610 | S1.46 | S2.4 | S4.86 | S6.1 | S | S102 | |||
|---|---|---|---|---|---|---|---|---|---|---|
| Epoch | Telescope | (days) | (mJy) | (mJy) | (mJy) | (mJy) | (mJy) | (mJy) | (mJy) | (mJy) |
| 3.84 Jan 2005 | VLA | 6.94 | — | — | 178 4 | — | 79 2 | — | 53 1 | — |
| 4.17 Jan 2005 | NMA | 7.27 | — | — | — | — | — | — | — | 16.3 5.6 |
| 4.41 Jan 2005 | GMRT | 7.51 | 466 28 | 224 13 | — | — | — | — | — | — |
| 4.59 Jan 2005 | VLA | 7.69 | — | — | 161 4 | — | 66 2 | — | 44 1 | — |
| 5.26 Jan 2005 | ATCA | 8.36 | — | — | 127 3 | 80 2 | — | — | — | — |
| 5.66 Jan 2005 | VLA | 8.76 | — | — | — | — | 55 1 | — | 33 1 | — |
| 5.85 Jan 2005 | ATCA | 8.93 | — | — | 113 3 | 63 2 | 53 2 | — | 30 1 | — |
| 6.26 Jan 2005 | ATCA | 9.36 | — | — | 96 3 | 73 2 | 45 2 | — | 23 1 | — |
| 6.38 Jan 2005 | GMRT | 9.48 | 462 29 | 142 8 | — | — | — | — | — | — |
| 6.77 Jan 2005 | VLA | 9.87 | — | — | 93 2 | — | 38 1 | — | 23.5 0.5 | — |
| 6.77 Jan 2005 | ATCA | 9.87 | — | — | 85 3 | 67 2 | 40 1 | 32 1 | — | — |
| 7.20 Jan 2005 | ATCA | 10.30 | — | — | 88 2 | 55 1 | — | — | — | — |
| 7.25 Jan 2005 | GMRT | 10.35 | 231 20 | 125 9 | — | — | — | — | — | — |
| 7.90 Jan 2005 | VLA | 11.00 | — | — | 71 2 | — | 26 1 | — | 16.5 0.5 | — |
| 8.19 Jan 2005 | ATCA | 11.29 | — | — | 67 3 | 38 2 | 24 1 | 20 1 | — | — |
| 8.24 Jan 2005 | GMRT | 11.34 | 250 17 | 104 8 | — | — | — | — | — | — |
| 9.06 Jan 2005 | ATCA | 12.16 | — | — | 42 2 | 32 1.5 | 21 1 | — | 11.4 1 | — |
| 9.26 Jan 2005 | GMRT | 12.36 | 176 20 | 86 7 | — | — | — | — | — | — |
| 10.07 Jan 2005 | ATCA | 13.16 | — | — | 32 2 | 24 1 | 17 1 | — | 10 1 | — |
| 10.16 Jan 2005 | GMRT | 13.26 | 155 17 | 82 7 | — | — | — | — | — | — |
| 10.60 Jan 2005 | VLA | 13.70 | — | — | — | — | — | — | 8.7 0.4 | — |
| 12.00 Jan 2005 | NMA | 15.10 | — | — | — | — | — | — | — | 7.16c |
| 12.04 Jan 2005 | ATCA | 15.14 | — | — | 24 1.5 | 16 1 | 12 1 | 9.3 1 | 7.3 1 | — |
| 13.00 Jan 2005 | NMA | 16.10 | — | — | — | — | — | — | — | 5.50c |
| 14.04 Jan 2005 | ATCA | 17.14 | — | — | 23 1 | 15 1 | 9.7 1 | 7.3 1 | 5.5 1 | — |
| 16.25 Jan 2005 | GMRT | 19.35 | 96 23 | 31 5 | — | — | — | — | — | — |
| 16.37 Jan 2005 | GMRT | 19.47 | — | — | 20 2d | — | — | — | — | — |
| 18.01 Jan 2005 | ATCA | 21.11 | — | — | 24 1.5 | 17 1 | 6.2 1 | 4.7 1 | 3.8 1 | — |
| 20.10 Jan 2005 | ATCA | 23.20 | — | — | 19 1.5 | 10 1.5 | 5 1 | — | 3.2 1 | — |
| 22.07 Jan 2005 | ATCA | 25.17 | — | — | 18 1 | 11 1 | 5 1 | 4.3 1 | 2.0 1 | — |
| 23.84 Jan 2005 | ATCA | 26.94 | — | — | 12 1 | 7.9 1 | 5.6 1 | 3.7 1 | 3.6 1 | — |
| 24.85 Jan 2005 | ATCA | 27.95 | — | — | 12 1 | 11 1 | 4.2 1 | 5.1 1 | 3.6 1 | — |
| 26.26 Jan 2005 | GMRT | 29.36 | 104 31 | 19 6 | — | — | — | — | — | — |
| 4.01 Feb 2005 | GMRT | 38.14 | — | — | 10c,d | — | — | — | — | — |
| 16.87 Feb 2005 | ATCA | 50.97 | — | — | 10 1 | 6.3 1 | 3.3 0.4 | — | 2.1 0.3 | — |
| 24.01 Feb 2005 | GMRT | 58.11 | 28.2 9 | 6.6 1.4 | — | — | — | — | — | — |
| Epoch | Beam | Beam PA | Fit Major Axis | Axial Ratio | Fit PA |
|---|---|---|---|---|---|
| (mas) | (degrees) | (mas) | (degrees) | ||
| 03 Jan 2005 | 11.8 | 78.2 | 0.34 | 54.6 | |
| 04 Jan 2005 | 72.4 | 0.00 | 69 | ||
| 05 Jan 2005 | 55 | 0.66 | 74 | ||
| 06 Jan 2005 | 75.7 | 0.48 | 51.8 | ||
| 07 Jan 2005 | 40.4 | 78 | 0.60 | 69 | |
| 10 Jan 2005 | 112 | 0.34 | 18 |

SUPPLEMENTAL INFORMATION
Observational Details: For the VLA observations we used the standard continuum mode with 2 50 MHz bands, with
the exception of the 1.46 GHz observation of 4 January 2005, which was taken in spectral line mode with 8 channels of
width 3.1 MHz. We used the extragalactic source 3C 286 (J1331+305) for flux calibration,
while the phase was monitored with J1820-254, J1751253, and J1811209.
The listed flux densities and uncertainties were measured from the resulting maps by fitting an
elliptical Gaussian model to the afterglow emission.
The GMRT observations were performed in dual frequency mode with 16 MHz bandwidth divided into a
total of 128 frequency channels for 610 MHz observations,
and 6 MHz of bandwidth divided into 64 channels for the 235 MHz observations.
The observations at 1060 MHz at GMRT were carried out with a
bandwidth of 32 MHz.
3C 48 (J0137+331) and 3C 286 were used as flux calibrators, and J1822096 was used as the phase calibrator.
These sources were also used for bandpass calibration.
We obtained the flux densities of the source by fitting a Gaussian with a background level plus a slope and
removed the contribution from a nearby weak source.
Because of the high density of radio sources in the galactic plane
in which SGR 180620 is located, the antenna system noise temperature
has notable contributions from the sky within the telescope beam.
This reduces the signal to noise ratio and an appropriate correction must be
made to the observed flux (especially at low frequencies), since the
flux calibrators which establish the flux scale lie well outside the
galactic plane and are in an environment of less sky temperature.
We applied a correction factor for 3C 48 of 3.88 and 1.93, and for 3C 286 of 3.87 and 1.8, for the
235 MHz and 610 MHz, respectively.
Both the VLA and GMRT data were reduced and analyzed using the Astronomical Image Processing System.
The ATCA observations were performed in snapshot mode with 100MHz of effective bandwidth.
The amplitude calibrator was J1934638, whereas J1711251, J1817254, and
J1811209 where used as phase calibrators.
The last of these was observed in a rapid (3 minute) cycle mode to compensate for its poor phase stability.
The flux densities were determined by performing a local parabolic fit to the peak closest to the known position of the source.
The NMA observations were performed at 102 GHz in D-configuration (the most compact configuration) on 4 January 2005, and in
AB configuration (longest baseline configuration) on 12, 13 January 2005.
We used NRAO530 for the phase calibration, and assumed it to have a flux density of 2.3 Jy.
Details of Source Size Measurements: The source sizes were measured by modeling the calibrated
visibilities with the model-fitting procedure in DIFMAP. This
procedure employs the Levenberg-Marquardt non-linear least
squares minimization technique while fitting a 6 parameter elliptical Gaussian to
the visibilities.
The errors were determined with DIFWRAP using the following scheme:
the source size parameters were stepped in small increments around
their best-fitted value to form a grid of values. At each grid point
the source size parameters were held fixed while the other model
parameters were allowed to ’relax’ with 4 model-fitting rounds.
The 95% confidence limits were determined by those models that had a
as measured from the best-fit total
(Press, W. H., Teukolsky, S. A., Vetterling, W. T. and Flannery, B. P.
Numerical Recipies in C. The art of scientific computing.
Cambridge: University Press, 2nd ed. 1992).
As a check we used phase only
self-calibration as well as phase and amplitude self-calibration,
both of which give consistent source size measurements. We also
used 30 second time-averaged data sets (to reduce the number of
degrees of freedom), and found the best fit model parameters agreed
to within the errors.
| Frequency | |||||
|---|---|---|---|---|---|
| (GHz) | (days) | (days) | |||
| 0.240 | — | — | — | — | |
| 0.61 | — | — | — | — | |
| 1.4 | |||||
| 2.4 | |||||
| 4.9 | |||||
| 6.1 | — | — | — | — | |
| 8.5 |
Table Acknowledgements: Summary of temporal indices and breaks in the light curve of SGR 180620 in 7 frequency bands. The fits represent minimums in subject to the conditions that the two power-law slopes are continuous at the break point and disagree by more than 1-. The first and second break points are denoted by and , respectively. The temporal decay indices () are for , for , and for .