Broad-band spectra of Cyg X-1 and correlations between spectral characteristics
Abstract
We present the results of spectral analysis of 42 simultaneous broad-band Ginga–OSSE and RXTE–OSSE observations of Cyg X-1 carried out in 1991 and 1996–1999. The broad-band spectra from 3 to keV can be well described by thermal Comptonization model with reflection from the cold disc, with an additional soft component visible below 10 keV. The relative contribution of this component to the total energy flux appears to be higher in the spectra with larger reflection amplitude and steeper photon index of the thermal Comptonized component. We consider a number of physically realistic models to describe the shape of the keV excess. The additional soft component can result from thermal Comptonization by electrons with a low Compton parameter, or can be a part of a nonthermal, power-law like emission extending above 1 MeV.
We study correlations between parameters obtained from the spectral fits with different models. We confirm a general correlation between the photon index and the amplitude of reflection . We find that simple phenomenological models (like power-law plus Compton reflection) applied to the narrow band (3–20 keV) data overestimated the values of and , although the simple models did rank correctly the spectra according to and , as it was demonstrated in the original publications on this subject.
The dynamic corona model provides a satisfactory description of the observed correlation, while the hot inner disc models have problems in reproducing it quantitatively. On the other hand, in the context of the dynamic corona model it is difficult to understand correlations with the timing characteristics, which seems natural in the hot disc scenario. We do not find significant correlation between the electron temperature and other spectral parameters, while the optical depth of the hot medium seems to decrease when the spectrum becomes softer. It is also shown that spectral parameters are well correlated with the timing characteristics of the source.
keywords:
accretion, accretion discs – black hole physics – gamma-rays: observations – stars: individual: Cygnus X-1 – X-rays: binaries1 INTRODUCTION
Matter accreting onto a black hole, whether supermassive in Seyfert galaxies or stellar mass in Galactic X-ray binaries, releases most of its gravitational energy in the form of X-rays deep in the potential well. Accretion may proceed in a number of regimes. The accreting gas can approach the black hole in a disc-like configuration (Shakura & Sunyaev, 1973) if the gravitational energy is effectively transported away in the form of radiation, or in a form of an almost spherical flow if the energy exchange mechanism between protons (carrying most of the energy) and electrons is inefficient (Shapiro, Lightman & Eardley, 1976; Ichimaru, 1977; Narayan, Mahadevan & Quataert, 1998). Magnetic fields can play an important role transporting large fraction of the total available energy and dissipating it in a rarefied medium (corona) above the disc (Galeev, Rosner & Vaiana, 1979; Tout & Pringle, 1992; Svensson & Zdziarski, 1994; Beloborodov, 1999a; Miller & Stone, 2000). However, every model is based on a number of assumptions that include prescriptions for the viscosity, the vertical distribution of the energy release through the flow, the energy transport mechanisms, etc. Given the difficulties in the accretion physics, observations should help in choosing among the different possibilities as well as guide theoreticians in the right direction.
Cygnus X-1, one of the best studied black hole binaries (BHB), served as an accretion disc laboratory since the end of the 1960’s. The most dramatic observed phenomena are the spectral state transitions occurring every few years, when the source, typically emitting most of its energy at about 100 keV in the hard state, switches to a soft state consisting of a prominent keV black-body and a power-law-like tail. The hard state spectrum was believed to originate from thermal Comptonization in a hot electron cloud (Shapiro, Lightman & Eardley, 1976; Ichimaru, 1977; Sunyaev & Trümper, 1979; Sunyaev & Titarchuk, 1980). The black-body looking soft-state spectrum was associated with the optically thick accretion disc (Shakura & Sunyaev, 1973), while the origin of keV emission in that state was not discussed much, because the detailed spectrum was not available.
During the last decade, the quality of the X/-spectra increased dramatically improving our knowledge as well as producing many new questions. In the hard state, the spectrum turns out to be rather complicated containing a number of components. Thanks to the broad-band coverage by Ginga and CGRO (and later by ASCA, RXTE and BeppoSAX), and advances in modelling of Comptonization at mildly relativistic temperatures (Coppi, 1992; Poutanen & Svensson, 1996), the parameters of the electron cloud where Comptonization takes place were determined to a high accuracy. In Cyg X-1, the electron temperature of keV and Thomson optical depth of were found to be typical (Zdziarski et al., 1996, 1997; Gierliński et al., 1997; Poutanen, 1998; Di Salvo et al., 2001; Frontera et al., 2001; Zdziarski & Gierliński, 2004). Compton reflection bump, a signature of the presence of cold matter in the vicinity of the X-ray emitting source, was discovered (Done et al., 1992; Ebisawa et al., 1996; Gierliński et al., 1997). The black body associated with the cooler accretion disc (Bałucińska & Hasinger, 1991; Bałucińska-Church et al., 1995; Ebisawa et al., 1996) and an additional soft excess at a few keV of unknown origin further complicate spectral decomposition (Di Salvo et al., 2001; Frontera et al., 2001). A high energy excess at keV discovered by CGRO (McConnell et al., 1994; Ling et al., 1997) gives some clues about presence of nonthermal particles in the source.
The X/-ray soft state spectrum has been studied extensively by simultaneous observations with ASCA, RXTE, BeppoSAX, and CGRO during summer 1996. In addition to the dominating black-body, a long power-law like tail extending up to 10 MeV was discovered (McConnell et al., 2002). The high-energy spectrum could be well described by single Compton scattering off electrons having a nearly power-law distribution (Poutanen & Coppi 1998; Poutanen 1998; Gierliński et al. 1999, hereafter G99; Frontera et al. 2001). The Compton reflection was stronger than in the hard state, which was interpreted as a change in the geometry of the system, from the hot inner flow in the hard state to the standard Shakura-Sunyaev disc with a nonthermal corona in the soft state (Bisnovatyi-Kogan & Blinnikov 1977; Ichimaru 1977; Poutanen, Krolik & Ryde 1997; Li & Miller 1997; Esin et al. 1998; Poutanen & Coppi 1998). Evaporation and condensation of the gas can provide a physical basis for the change of the transition radius between standard disc and hot inner flow (Meyer, Liu & Meyer-Hofmeister, 2000; Różańska & Czerny, 2000). A smaller reflection fraction in the hard state, however, can be explained by a beaming of the primary emission away from the disc due to mildly relativistic motion of the emitting plasma (ejection model, see Beloborodov 1999a, b; Malzac, Beloborodov & Poutanen 2001, hereafter MBP01). In order to distinguish among different possibilities, one needs to compare model predictions with other observational facts.
A few, well separated in time, broad-band spectra do not give us a good picture about relations between different components such as, for example, Comptonized continuum and the reflection bump. One can study these relations on a larger data set in a narrower energy band. Zdziarski, Lubiński & Smith (1999) (hereafter ZLS99) and Gilfanov, Churazov & Revnivtsev (1999) (hereafter GCR99) analyzing data from Ginga and RXTE, respectively, showed that the photon spectral slope of the Comptonized emission, , is strongly correlated with the amplitude of Compton reflection component, , where is the solid angle the cool material covers as viewed from the source of primary X-rays. This correlation exists for individual BHBs and Seyfert galaxies as well as in a sample of sources (see also Gilfanov, Churazov & Revnivtsev, 2000; Revnivtsev, Gilfanov & Churazov, 2001). Zdziarski et al. (2003) studied possible statistical and systematic effects and concluded that the correlation exists beyond any reasonable doubts. Similar correlation also exists for Fourier-frequency resolved spectra, i.e., those corresponding to the variability in a given range of Fourier frequencies (Revnivtsev, Gilfanov & Churazov, 1999).
The observed correlation provides extremely important clues to the geometry of the accreting material and can be used for testing theoretical model. The fact that and are correlated is a natural consequence of co-existence of the cold media (accretion disc) and a hot Comptonizing gas in the vicinity of the black hole. The cold material acts as a source of seed photons for Comptonization and, at the same time, reflects and reprocesses the hard radiation produced in the hot gas.
The cold disc with the hot inner flow model naturally produces the correlation if there is an overlap between hot and cold phases (Poutanen et al. 1997; ZLS99). However, the – dependence observed in BHBs can be quantitatively reproduced only if the ratio of the seed photon temperature, , to the electron temperature is about (ZLS99; Gilfanov et al. 2000). For keV this gives eV which is an order of magnitude smaller than the disc temperature in BHBs and closer to that expected from Seyferts. For eV, the spectra are too hard for the given reflection fraction. In this model, the spectral slope is an extremely steep function of the overlap between the corona and the disc, while the reflection varies very little (Beloborodov, 2001). Intrinsic dissipation in the disc can make spectra softer for the given reflection, but then the spectral slope will be even steeper function of the overlap. Values of reflection larger than sometimes observed in Seyferts also cannot be explained. On the other hand, all the data can be well described by the ejection model with the correct (Beloborodov 1999a, b; MBP01).
The problem is that theoretical models try to reproduce the best-fitting and which are subject to a number of systematic effects. The photon index and, especially, the strength of the Compton reflection depend crucially on the spectral shape of the underlying continuum and description of the reflection physics (see detailed discussion in Zdziarski et al. 2003). All the papers above, where this correlation was studies, assumed the underlying spectrum to be a power-law. Since the Comptonization spectrum has a cut-off at high energies it gives fewer incident photons that are available for reflection (Weaver, Krolik & Pier, 1998; Perola et al., 2002; Malzac & Petrucci, 2002), and thus the fitted would be larger. Fitting an exponentially cut-off power-law to the broad-band data (e.g. Matt 2001; Perola et al. 2002) does not improve the situation, since this model does not reproduce well the shape of the Comptonization continuum (Malzac & Petrucci, 2002; Zdziarski et al., 2003). Approximate treatment of ionization could be another source of errors.
As we discussed above, the spectra of BHBs are rather complex having number of components, and it is not possible to resolve different spectral components (e.g. thermal Comptonization and soft excess) in the narrow energy range of an instrument such as RXTE/PCA or Ginga/LAC. There is a danger that different components overlap in that energy band producing effectively a power-law of one index while in reality the slope of the primary emission could be rather different. The resulting reflection amplitude could be also influenced significantly. Thus, in order to obtain actual and to be used in theoretical models, analysis of broad-band data with physical models (such as Comptonization) is absolutely necessary.
Additional sources of information are the width of the fluorescent Fe K line at 6.4 keV and the frequencies of the quasi-periodic oscillations that were also observed to correlate with the reflection fraction and the spectral slope (Gilfanov et al., 2000, GCR99). This seems to be consistent with the variations of the inner cold disc radius. Not much data exist on the variability of the electron temperature and Thomson optical depth of the Comptonizing source which can provide information about the nature of the emitting plasma (electron-proton or electron-positron). It would be of interest to determine how the optical depth changes with the bolometric flux, because this can help in distinguishing the accretion mode the flow is in.
In this paper, we analyze a large set of simultaneous broad-band spectra. Four observations of Cyg X-1 by Ginga/LAC and CGRO/OSSE from 1991 as well as 38 observations by RXTE/PCA, RXTE/HEXTE and CGRO/OSSE from 1996 – 1999 are studied in details. For the spectral analysis, we use physically motivated Comptonization models and study correlations between model parameters such as spectral slope of the primary Comptonization continuum, reflection amplitude, the width of the Fe line, electron temperature of the hot gas, and its Thomson optical depth.
2 OBSERVATIONS AND DATA ANALYSIS
The observation log is presented in Table 1. Data reduction for RXTE has been carried out using LHEASOFT 5.3.1 software; PCA responses were generated using pcarsp v. 10.1 and HEXTE responses were used from 2000 May 26. In PCA data reduction, all 5 PCUs were taken into account, when possible. If not all PCUs were turned on, we use PCUs 0, 2 and 3. Judging from the Crab data, these two PCU configurations produce similar spectral slopes. Systematic errors of 0.5% were added in quadrature to the PCA data. CGRO/OSSE spectra were prepared by adding per-orbit data (average exposure 2–5 ksec), with total exposure up to 12 hours and contemporary PCA observation in the middle of the period. The systematic error in OSSE spectra varies from 3% at 50 keV to 0.3% at 300 keV. Stability of OSSE spectra was checked using hardness ratios (154–282/52–154 keV) for per-orbit spectra being added. If orbital spectra within 12 hours were apparently different, we lowered the total integration time to include only similar data.
We used PCA data from 3 to 20 keV, HEXTE data from 20-25 to 200 keV and OSSE data from 50 to 1000 keV. In addition, four Ginga/LAC and OSSE simultaneous observations from 1991, previously studied by Gierliński et al. (1997), were also analyzed. The Ginga/LAC data are available from 1.7 keV, but we decided to use exactly the same energy interval as covered by the PCA. For the spectral analysis, we use XSPEC 11.3.1k (Arnaud, 1996).
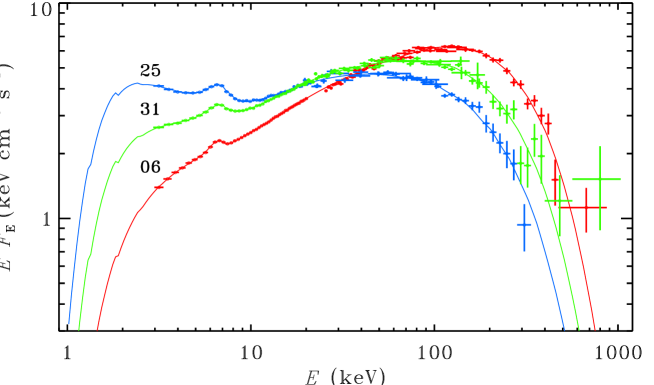
The spectra may be separated into two groups based on the difference of their photon index (see Fig. 1). Spectra from 1991 and 1997, represented by observation 6, have (usual for the hard state) and ones from 1999 (observations 25 and 31) have –2.2, and hereafter we call the corresponding state flat (because the spectrum is nearly flat in the plot). The spectra from 1996 and 1998 are close to the hardest ones from 1999. We do not consider here the broad-band soft state spectra, for which the similar analysis has been performed by G99 and Frontera et al. (2001).
| No | RXTE | Ginga or PCA | HEXTE | Date | Time [UT] | CGRO | OSSE | Time [UT] |
| ObsID | exposurea [s] | Exposureb [s] | VP | exposure [s] | ||||
| 1991 hard state | ||||||||
| G1 | 2304 | June 6 | 00:18–02:10 | 02 | 4121 | 00:03–02:11 | ||
| G2 | 888 | June 6 | 04:43–06:29 | 02 | 4040 | 04:29–06:51 | ||
| G3 | 2828 | June 6 | 11:03–14:25 | 02 | 5975 | 10:43–14:32 | ||
| G4 | 1272 | June 6 | 20:22–20:44 | 02 | 1629 | 20:02–20:33 | ||
| 1996 flat state | ||||||||
| 1 | 10238-01-08-000 | 14592 | 5083 | March 26 | 10:12–17:36 | 516.5 | 17538 | 07:22–20:01 |
| 2 | 10238-01-07-000 | 8446 | 2922 | March 27 | 23:06–05:20 | 516.5 | 23018 | 20:20–07:47 |
| 3 | 10238-01-06-00 | 11455 | 3713 | March 29 | 11:43–17:33 | 516.5 | 21868 | 08:24–21:06 |
| 4 | 10238-01-05-000 | 10397 | 3524 | March 30 | 19:54–01:58c | 516.5 | 24153 | 16:51–04:12c |
| 1997 hard state | ||||||||
| 5 | 10239-01-01-00 | 9095 | – | Feb 2 | 20:13–02:03 | 612.5 | 47864 | 16:53–04:52c |
| 6 | 10238-01-03-00 | 6441 | 1938 | Feb 3 | 19:30–22:06 | 612.5 | 44530 | 14:38–02:36c |
| 7 | 30158-01-01-00 | 1175 | 809 | Dec 10 | 07:08–08:30 | 705 | 7552 | 02:55–12:46 |
| 8 | 30158-01-02-00 | 2012 | 823 | Dec 11 | 07:06–08:45 | 705 | 12004 | 04:11–14:05 |
| 9 | 30158-01-03-00 | 2027 | 706 | Dec 14 | 08:48–10:20 | 705 | 11599 | 03:09–11:35 |
| 10 | 30158-01-05-00 | 2614 | 901 | Dec 15 | 05:26–07:09 | 705 | 16721 | 23:31–11:18c |
| 11 | 30158-01-06-00 | 3210 | 941 | Dec 17 | 00:40–02:05 | 706 | 13017 | 20:13–07:32d |
| 12 | 30157-01-02-00 | 2309 | 784 | Dec 18 | 07:07–08:16 | 706 | 9924 | 01:49–08:46 |
| 13 | 30158-01-07-00 | 2275 | 766 | Dec 20 | 07:11–08:29 | 706 | 11847 | 02:46–12:52 |
| 14 | 30158-01-08-00 | 2581 | 878 | Dec 21 | 05:28–07:05 | 706 | 14924 | 00:51–12:31c |
| 15 | 30157-01-03-00 | 2846 | 860 | Dec 24 | 21:24–23:03 | 707 | 10127 | 21:36–03:18c |
| 16 | 30161-01-01-000 | 13244 | 4136 | Dec 28 | 13:56–21:03 | 707 | 13717 | 11:33–00:24c |
| 17 | 30158-01-12-00 | 2836 | 916 | Dec 30 | 03:52–05:00 | 707 | 8979 | 23:49–07:57d |
| 1998 flat state | ||||||||
| 18 | 30155-01-01-020 | 10027 | 3897 | Dec 23 | 00:07–05:58 | 804 | 2957 | 21:52–09:00d |
| 19 | 30155-01-02-00 | 9625 | 3399 | Dec 28 | 01:40–07:09 | 804 | 5124 | 23:14–10:29d |
| 20 | 30161-01-03-01 | 9863 | 3371 | Dec 28 | 13:08–18:37 | 804 | 5289 | 11:50–21:31 |
| 21 | 40100-01-04-00 | 8472 | – | Dec 29 | 01:37–05:57 | 804 | 5476 | 22:51–10:08d |
| 22 | 40100-01-05-00 | 8476 | – | Dec 30 | 01:38–05:57 | 804 | 5288 | 22:30–09:46d |
| 23 | 40100-01-06-00 | 7245 | – | Dec 31 | 03:12–07:11 | 804 | 5552 | 23:44–11:00d |
| 1999 flat state | ||||||||
| 24 | 40101-01-09-00 | 2405 | 665 | Oct 5 | 18:39–19:45 | 831.5 | 29605 | 15:04–01:12c |
| 25 | 40101-01-11-00 | 731 | 165 | Oct 6 | 19:22–20:03 | 831.5 | 25960 | 14:39–00:50c |
| 26 | 40101-01-12-00 | 865 | – | Oct 7 | 07:10–07:40 | 831.5 | 28389 | 03:08–12:55 |
| 27 | 40101-01-15-00 | 741 | 218 | Oct 8 | 08:07–08:48 | 831.5 | 31014 | 04:20–14:35 |
| 28 | 40101-01-16-00 | 757 | 215 | Oct 9 | 09:41–10:22 | 831.5 | 33770 | 03:55–15:48 |
| 29 | 40099-01-20-01 | 1228 | 354 | Oct 12 | 17:33–19:56 | 831.5 | 37186 | 12:11–01:23c |
| 30 | 40100-01-11-01 | 4300 | – | Oct 28 | 10:46–15:12 | 832 | 19559 | 06:16–17:46 |
| 31 | 40099-01-22-00 | 1444 | 520 | Nov 8 | 14:44–15:25 | 832 | 17504 | 09:52–21:28 |
| 32 | 40099-01-23-01 | 3084 | 1453 | Nov 23 | 15:26–17:32 | 834.5 | 8734 | 15:14–21:54 |
| 33 | 40100-01-13-01 | 770 | – | Nov 24 | 20:08–20:59 | 834.5 | 19652 | 14:51–02:13c |
| 34 | 40100-01-14-02 | 479 | – | Nov 25 | 20:05–20:56 | 834.5 | 16683 | 14:24–01:47c |
| 35 | 40100-01-15-03 | 1729 | – | Nov 26 | 21:40–22:32 | 834.5 | 24372 | 17:11–04:33c |
| 36 | 40100-01-16-02 | 1448 | – | Nov 27 | 19:59–20:50 | 834.5 | 19063 | 15:13–02:34c |
| 37 | 40100-01-17-03 | 1902 | – | Nov 28 | 21:32–22:27 | 834.5 | 10309 | 19:19–00:28c |
| 38 | 40100-01-18-03 | 1961 | – | Nov 29 | 21:29–22:25 | 834.5 | 19999 | 16:03–03:19c |
| a The deadtime-corrected exposure. | ||||||||
| b HEXTE cluster 0 exposure. Symbol ’–’ means that no HEXTE data are available. | ||||||||
| c The observation finished on the following day. | ||||||||
| d The observation started on the previous day. | ||||||||
3 SPECTRAL ANALYSIS
In order to describe the observed broad-band spectra we use the following models:
(0) Power-law (without or with an exponential cutoff) and Compton reflection (pexrav model, Magdziarz & Zdziarski 1995);
(1) two thermal Comptonization models and reflection, with the soft excess also modelled by thermal Comptonization;
(2) thermal Comptonization with reflection plus a nonthermal Comptonization corresponding to the soft state spectrum.
We use the eqpair code (Coppi 1999; G99) for modeling thermal and nonthermal Comptonization. All models include also a Gaussian line at 6.4 keV and interstellar absorption with column density which we find often larger than the value of cm-2 (derived from the reddening towards the companion star, see Bałucińska-Church et al. 1995). To avoid unreasonably low values of this parameter, its low limit was set to cm-2. The presented uncertainties are given at a 90 per cent confidence level for a single parameter (). Fluxes, unless stated otherwise, correspond to the range covering all the model emission.
3.1 The power-law and reflection model in the 3–20 keV data
The spectra of Cyg X-1 clearly show correlations between reflection amplitude and the spectral index (GCR99, ZLS99). Detailed analysis confirms (Zdziarski et al., 2003) that the extend of correlation is much larger than typical errors in the best-fitting parameters. However, since the PCA spectrum falls in a quite narrow energy interval and it is difficult to distinguish between various spectral components that may form an “effective” power-law. Therefore, it is not certain that the values for and obtained from the simple power-law/reflection fits indeed correspond to the actual physical situation.
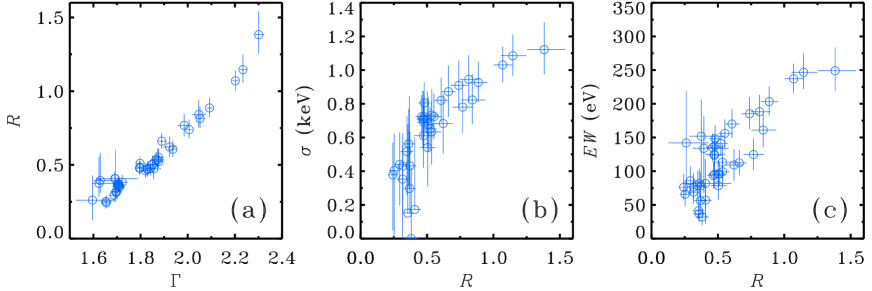
Still, in order to compare our results with those of previous analysis, we have performed fits similar to those presented in ZLS99 and GCR99. We later compare them to the results obtained with more physical models (see Sect. 4.4). We use the XSPEC model phabs*(pexrav+gaussian) (model 0), i.e., a power law with the photon index, , and Compton reflection with the relative strength, (Magdziarz & Zdziarski, 1995), accompanied by a Gaussian fluorescence Fe K line (characterized by the relativistic smearing width and the equivalent width ), all absorbed by interstellar material of column density . Hereafter, we assume the disc inclination of and neutral reflector.
The fit results are presented in Table 2. Only the low-energy 3–20 keV (RXTE/PCA and Ginga/LAC) data were fitted, and therefore we did not apply any high-energy cutoff to the power law. We find that the correlations between spectral parameters (see Fig. 2) are similar to GCR99 results.
As shown in Sect. 3.2 below, there is a likely overlap of different spectral components in the PCA energy range. Therefore, the model 0 cannot represent a good approach for physical interpretations for the spectra. Taking into account also the OSSE data and including an exponential cutoff in the model, we can model the joint data only very roughly, with /dof . This is likely to be due to the the shape of the exponential cutoff (which is assumed in pexrav) being substantially different from the shape of the cutoff of thermal Comptonization (see e.g. Zdziarski et al. 2003). This provides an argument against utilizing simple phenomenological models in the analysis of BHB spectra.
| No. | [ cm-2] | [keV] | [eV] | |||
|---|---|---|---|---|---|---|
| 1991 | ||||||
| G1 | 3/11 | |||||
| G2 | 4/11 | |||||
| G3 | 3/11 | |||||
| G4 | 5/12 | |||||
| 1996 | ||||||
| 01 | 24/43 | |||||
| 02 | 20/43 | |||||
| 03 | 20/43 | |||||
| 04 | 24/43 | |||||
| 1997 | ||||||
| 05 | 19/39 | |||||
| 06 | 27/39 | |||||
| 07 | 16/39 | |||||
| 08 | 35/39 | |||||
| 09 | 26/39 | |||||
| 10 | 22/39 | |||||
| 11 | 15/39 | |||||
| 12 | 23/39 | |||||
| 13 | 21/39 | |||||
| 14 | 21/39 | |||||
| 15 | 17/39 | |||||
| 16 | 22/39 | |||||
| 17 | 19/39 | |||||
| 1998 | ||||||
| 18 | 19/39 | |||||
| 19 | 19/39 | |||||
| 20 | 17/39 | |||||
| 21 | 14/39 | |||||
| 22 | 20/39 | |||||
| 23 | 17/39 | |||||
| 1999 | ||||||
| 24 | 28/33 | |||||
| 25 | 48/33 | |||||
| 26 | 43/33 | |||||
| 27 | 14/33 | |||||
| 28 | 32/33 | |||||
| 29 | 22/33 | |||||
| 30 | 27/33 | |||||
| 31 | 25/33 | |||||
| 32 | 20/33 | |||||
| 33 | 30/33 | |||||
| 34 | 14/33 | |||||
| 35 | 25/33 | |||||
| 36 | 25/33 | |||||
| 37 | 27/33 | |||||
| 38 | 39/33 | |||||
3.2 Comptonization model and broad-band spectra
The hard state spectra are well described by thermal Comptonization (Gierliński et al., 1997; Poutanen, 1998; Frontera et al., 2001), with a weak soft excess. To describe Comptonization we use the XSPEC model eqpair (see Coppi 1999; G99). The spectrum of seed photons is from a pseudo-Newtonian accretion disc, see G99. Parameters of emission are expressed through the compactness,
| (1) |
where is the source luminosity, is the radius of the emitting spherical cloud, and is the Thomson cross section. We consider here thermal plasma. The model is characterized by the following parameters: – the compactness of soft seed photons (assumed here to be 1); – the ratio of the dimensionless energy dissipation rate in a hot cloud to ; – the maximal colour temperature of the disc (at 9.5 gravitational radii, , or at the inner radius of the disc, if it is cut off at larger value); – the Thomson optical depth corresponding to the ions; – the reflection amplitude. Since there are large (25% at ) errors on , we decided to fix it at the common value of 200 eV. The model computes the coronal temperature, , and the total optical depth, , from the background electrons and produced pairs self-consistently from the energy and pair balance. For the assumed compactness, pair production is negligible for all considered spectra, and thus the resulting total optical depth . In the fits, we assume the inner disc radius of (this parameter has only effect on the relativistic smearing of the reflected component, that could be hardly resolved with present energy resolution).
The normalization of eqpair, corresponding to the disc component, is , where is the covering factor, is the black hole mass in units of the solar mass, is the distance to the source in units of kpc, and is the ratio of the colour temperature to the effective one.
At low energies the effect of the interstellar absorption is clearly visible. The addition of a additional soft component leads to further improvement of the fits. Such soft excesses were observed in both the hard state by Di Salvo et al. (2001) and in a flat state (similar to that analyzed here) by Frontera et al. (2001) in BeppoSAX data. This component, that nature we address below, however, is relatively weak in case of 1991 and 1997 (observations G1–G4, 05–17) hard state data. The spectra observed in 1996, 1998 and 1999 (observations 1–4, 18–38) appear similar in the overall shape to those of hard state, but are significantly softer (see Fig. 2). The soft excess in the flat state is stronger.
We stress that the requirement of an additional soft excess is implied only by the joint PCA/HEXTE/OSSE data, since the PCA data cover a too narrow energy range. Even if the actual spectrum in the PCA 3–20 keV band is not a power-law but is e.g. concave, a good fit with a power law plus reflection (model 0) can be still achieved. However, the real strength of Compton reflection can be significantly different.
Since the data require an additional component only in a relatively narrow, 3–10 keV, range, the parameters of the soft excess cannot be constrained accurately. Below we consider a number of physically realistic scenarios of its nature. In each of the considered models, we restrict the parameters controlling its spectral shape to values that makes its flux significant only at low energies, and we fit only its normalization. These fits allow us to completely describe the broad-band spectra and to constrain the parameters of main continuum.
| Obs. | ||||||||||||
| G1 | 5.32 | 0.11 | 90 | 1.62 | 49/73 | |||||||
| G2 | 7.24 | 0.24 | 82 | 1.59 | 58/74 | |||||||
| G3 | 4.18 | 0 | 94 | 1.62 | 53/73 | |||||||
| G4 | 3.83 | 0.14 | 90 | 1.63 | 53/73 | |||||||
| 01 | 7.32 | 1.26 | 86 | 1.68 | 501/478 | |||||||
| 02 | 8.83 | 1.56 | 83 | 1.69 | 531/493 | |||||||
| 03 | 8.04 | 1.49 | 75 | 1.68 | 542/506 | |||||||
| 04 | 10.0 | 2.44 | 77 | 1.71 | 529/493 | |||||||
| 05 | 4.46 | 0.08 | 110 | 1.65 | 61/73 | |||||||
| 06 | 3.99 | 0.19 | 95 | 1.64 | 374/402 | |||||||
| 07 | 5.80 | 0.52 | 96 | 1.65 | 367/415 | |||||||
| 08 | 5.43 | 0.46 | 84 | 1.65 | 404/415 | |||||||
| 09 | 5.98 | 0.62 | 84 | 1.65 | 350/415 | |||||||
| 10 | 4.92 | 0.25 | 99 | 1.66 | 301/334 | |||||||
| 11 | 5.72 | 0.58 | 99 | 1.65 | 193/236 | |||||||
| 12 | 5.77 | 0.61 | 99 | 1.65 | 202/238 | |||||||
| 13 | 5.74 | 0.47 | 83 | 1.63 | 369/411 | |||||||
| 14 | 6.25 | 0.63 | 90 | 1.64 | 397/415 | |||||||
| 15 | 5.51 | 0.57 | 99 | 1.62 | 201/244 | |||||||
| 16 | 6.53 | 0.76 | 76 | 1.62 | 446/402 | |||||||
| 17 | 5.12 | 0.55 | 92 | 1.63 | 345/415 | |||||||
| 18 | 7.09 | 1.41 | 84 | 1.73 | 512/489 | |||||||
| 19 | 5.87 | 1.29 | 66 | 1.69 | 457/502 | |||||||
| 20 | 6.11 | 1.29 | 73 | 1.70 | 472/502 | |||||||
| 21 | 6.52 | 1.28 | 81 | 1.68 | 46/73 | |||||||
| 22 | 6.86 | 1.21 | 90 | 1.71 | 45/73 | |||||||
| 23 | 6.57 | 1.10 | 81 | 1.72 | 43/73 | |||||||
| 24 | 4.71 | 1.46 | 83 | 1.82 | 389/409 | |||||||
| 25 | 6.51 | 2.71 | 81 | 1.85 | 355/409 | |||||||
| 26 | 5.44 | 1.92 | 90 | 1.89 | 48/67 | |||||||
| 27 | 5.92 | 1.81 | 84 | 1.80 | 386/409 | |||||||
| 28 | 4.71 | 1.52 | 75 | 1.81 | 389/409 | |||||||
| 29 | 5.06 | 1.28 | 85 | 1.80 | 394/409 | |||||||
| 30 | 5.67 | 1.46 | 141† | 1.93 | 52/67 | |||||||
| 31 | 5.10 | 1.12 | 89 | 1.77 | 390/409 | |||||||
| 32 | 5.08 | 1.01 | 79 | 1.70 | 393/409 | |||||||
| 33 | 5.76 | 1.16 | 84 | 1.73 | 62/67 | |||||||
| 34 | 4.64 | 0.67 | 92 | 1.76 | 43/67 | |||||||
| 35 | 5.26 | 0.85 | 91 | 1.76 | 40/67 | |||||||
| 36 | 5.35 | 0.96 | 94 | 1.75 | 62/64 | |||||||
| 37 | 5.53 | 1.39 | 92 | 1.78 | 40/62 | |||||||
| 38 | 6.33 | 1.80 | 98 | 1.78 | 41/62 | |||||||
| a Hydrogen column density, in units cm-2. | ||||||||||||
| b Normalization of the eqpair model component. | ||||||||||||
| c The unabsorbed total model flux, in units of erg cm-2 s-1. | ||||||||||||
| d The unabsorbed model flux of the comptt component, in units of erg cm-2 s-1. | ||||||||||||
| e Temperature of the emitting plasma in keV (for the eqpair component). | ||||||||||||
| f Photon spectral index of the eqpair component in the 2–10 keV range. | ||||||||||||
3.2.1 High temperature of the optically-thick disc
The additional component may, in principle, be emitted by the hottest part of the optically-thick disc provided its temperature is high enough. We find that the spectra of the observations 1–4, 18–38 can be well fitted with keV. But Di Salvo et al. (2001) showed that the spectral decomposition of the BeppoSAX data of Cyg X-1 in the hard state requires the presence of both the soft blackbody disc photons (with –0.2 keV, and an additional soft excess component. Therefore, we consider this model to be not appropriate.
3.2.2 Hybrid model
We also tried to apply hybrid thermal+nonthermal eqpair model to the spectra. Most of the data require nearly nonthermal injection and the resulting spectrum becomes a power-law directed by PCA part of the spectrum. Because the observed hard tail is not power-law, large reflection appears to mimic the cutoff region, but it is still not enough to describe both the soft excess below 10 keV and the hard tail, in which the systematic difference between the data and the model remains. Therefore, we ruled out this model.
3.2.3 Two thermal Comptonization components
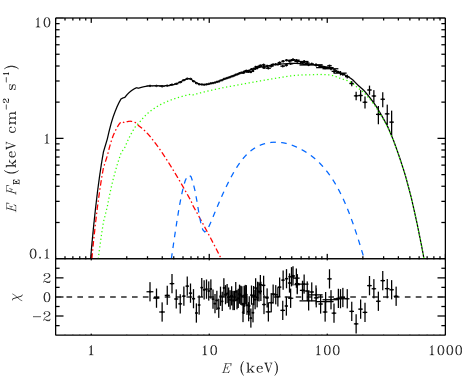
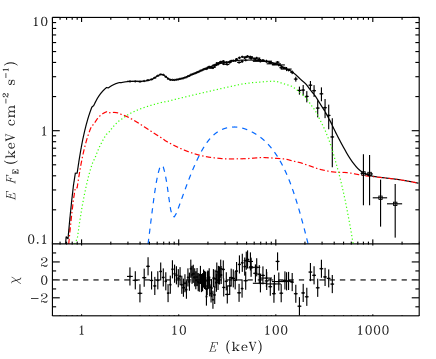
The soft component can be described by additional thermal Comptonization (Frontera et al., 2001; Di Salvo et al., 2001). We use the model 1, phabs(comptt+eqpair+gaussian), where eqpair gives the main Comptonization and comptt (Titarchuk, 1994) – the additional soft component. Since the parameters of the soft excess are rather weakly constrained by our data, we fixed the parameters of comptt at keV and . Such a model produces a soft power law that does not extend to very high energies. This model fitted to the data of the observation 24 is shown in Fig. 3. In spite of its simplicity, it yields a relatively good description of the data.
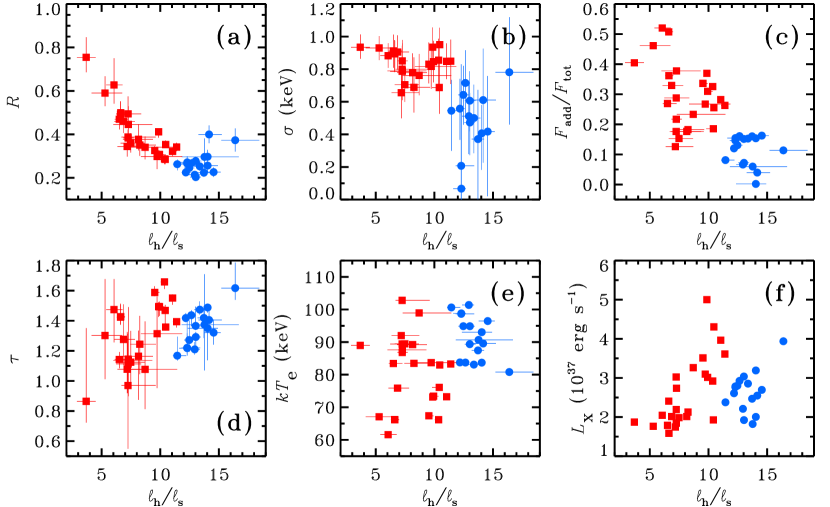
The fit parameters are given in Table 3, and the dependencies between various model parameters are shown in Fig. 4. We also quote the values of the spectral index of the power law obtained from the least-square fitting of the logarithm of the intrinsic model flux at a logarithmic energy grid in the 2–10 keV range (chosen to enable comparison with results of other papers).
The meaning of the normalization of eqpair is described in Sect. 3.2 above. Substituting , , , kpc (see references in G99, Frontera et al. 2001) and (Shimura & Takahara, 1995), we expect the normalization of 1.92. The lower normalization of the obtained fits (see Table 3), is caused either by a larger –1.98 or by a smaller covering factor . A slightly smaller, than the assumed disc temperature of 200 eV, can also reduce the normalization. On the other hand, some flat state normalizations are larger than the expected value of 1.92. This cannot be explained by changing (smaller covering factor can only reduce the normalization), but could be a result of somewhat larger inner disc radius or larger temperature. The largest observed normalizations correspond to eV.
We see that there is a clear anti-correlation between the strength of the soft component and hardness of spectrum expressed in terms of . There is also a correlation between and . The reflection amplitude is correlated with the Fe line equivalent width and anti-correlated with (while at high values of the anti-correlation possibly breaks down).
The electron temperature is a calculated parameter and no errors on it can be obtained from fitting. However, we estimated its limits using its extremal values within the uncertainties of the parameters controlling spectral shape, i.e., and . This estimation gives us a possible conservative error on of about 15 keV for both models 1 and 2. Taking this into account, no correlations between –flux and are apparent.
3.2.4 Thermal continuum and nonthermal Comptonization component
As an alternative to the second thermal-Compton component, we consider here addition of a nonthermal Comptonization component. We find that such a nonthermal component can describe both the soft excess and the MeV nonthermal tail observed in hard states by COMPTEL (McConnell et al., 2002), while neither of these components can be described by the main thermal-Compton emission. This model fitted to the spectrum 24 is shown in Fig. 5. Note that the COMPTEL data are shown for illustration only and were not taken into account in the fitting. The used model 2 consists of phabs(eqpair+eqpair+gaussian), in which the second eqpair component produces the nonthermal spectrum. In eqpair, the available power is supplied in part into heating electrons and in part into their acceleration, with the resulting steady-state electron distribution calculated self-consistently. The compactness corresponding to the acceleration is hereafter denoted as . Then the relative fraction of the input power going into the nonthermal acceleration is , where (as before) corresponds to the total rate of energy dissipation in the plasma.
For that additional component, we assumed that all the available power goes into nonthermal acceleration, i.e., . Note that the resulting self-consistent electron distribution is not purely nonthermal but hybrid, i.e., it does contain a low-energy Maxwellian heated by Compton and Coulomb interactions. We further assume , the power-law index of the accelerated electrons of (see McConnell et al. 2002; G99; Frontera et al. 2001; Poutanen & Coppi 1998), the minimum and maximum Lorentz factors of the power law of and , respectively, equal to that of the main component, , and . No pair production is required, and is found to be equal to .
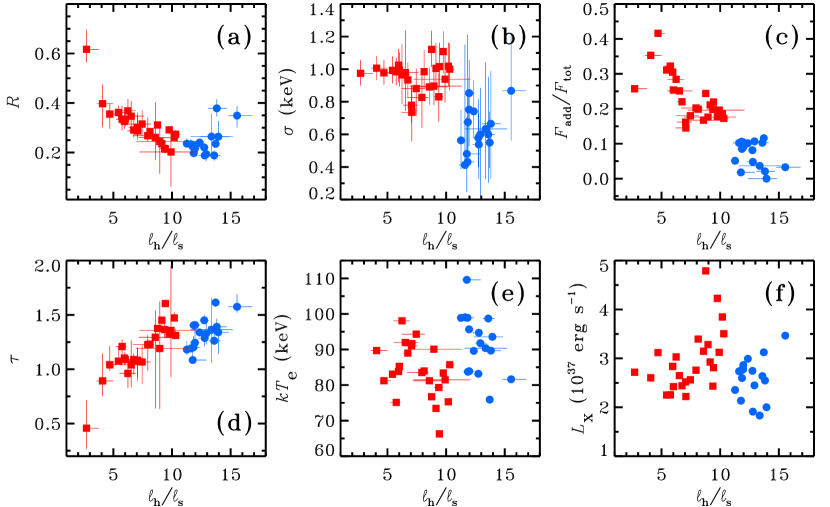
The best-fit parameters are presented in Table 4 and correlations between them are shown in Figs. 6 and 11. The normalization of the thermal eqpair component corresponds to –, the values similar to those obtained with model 1. The strength of the additional (non-thermal) component is again clearly anti-correlated with the spectral hardness. The anti-correlation between and is apparent and corresponds to the correlation that we discuss in Sect. 4.4. The values of and the Fe line equivalent width are well correlated and can be approximated by a linear function passing through zero (see Fig. 11c). Again, there is a correlation between and . The electron temperature does not seemingly depend on the hardness, but the spread becomes smaller at larger where keV.
| Obs. | ||||||||||||
| G1 | 5.32 | 0.21 | 90 | 1.62 | 49/73 | |||||||
| G2 | 8.23 | 0.93 | 81 | 1.58 | 56/74 | |||||||
| G3 | 4.19 | 0.01 | 93 | 1.62 | 53/73 | |||||||
| G4 | 3.81 | 0.23 | 91 | 1.62 | 53/73 | |||||||
| 01 | 7.55 | 1.98 | 83 | 1.66 | 498/478 | |||||||
| 02 | 9.00 | 2.30 | 83 | 1.67 | 528/493 | |||||||
| 03 | 8.28 | 2.34 | 73 | 1.66 | 527/506 | |||||||
| 04 | 10.45 | 3.86 | 73 | 1.69 | 515/493 | |||||||
| 05 | 4.62 | 0.31 | 101 | 1.63 | 60/73 | |||||||
| 06 | 4.02 | 0.29 | 95 | 1.63 | 372/402 | |||||||
| 07 | 5.85 | 0.76 | 95 | 1.64 | 366/415 | |||||||
| 08 | 5.45 | 0.65 | 84 | 1.64 | 401/415 | |||||||
| 09 | 6.11 | 0.98 | 84 | 1.64 | 348/415 | |||||||
| 10 | 4.97 | 0.40 | 101 | 1.66 | 301/334 | |||||||
| 11 | 5.82 | 0.90 | 99 | 1.64 | 193/236 | |||||||
| 12 | 5.78 | 0.85 | 99 | 1.64 | 201/238 | |||||||
| 13 | 5.96 | 0.91 | 83 | 1.62 | 365/411 | |||||||
| 14 | 6.35 | 0.96 | 89 | 1.63 | 391/415 | |||||||
| 15 | 5.63 | 0.92 | 96 | 1.61 | 198/244 | |||||||
| 16 | 6.67 | 1.02 | 84 | 1.62 | 436/402 | |||||||
| 17 | 5.16 | 0.83 | 87 | 1.62 | 342/415 | |||||||
| 18 | 7.34 | 2.47 | 67 | 1.69 | 481/489 | |||||||
| 19 | 6.10 | 1.99 | 66 | 1.67 | 455/502 | |||||||
| 20 | 6.30 | 1.95 | 73 | 1.69 | 467/502 | |||||||
| 21 | 6.47 | 1.73 | 84 | 1.69 | 47/73 | |||||||
| 22 | 6.82 | 1.59 | 99 | 1.71 | 44/73 | |||||||
| 23 | 6.32 | 1.11 | 103 | 1.75 | 43/73 | |||||||
| 24 | 5.03 | 2.55 | 66 | 1.78 | 379/409 | |||||||
| 25 | 4.28 | 2.22 | 62 | 1.80 | 354/409 | |||||||
| 26 | 3.69 | 1.70 | 67 | 1.83 | 52/67 | |||||||
| 27 | 4.21 | 1.39 | 76 | 1.77 | 380/409 | |||||||
| 28 | 3.31 | 1.20 | 66 | 1.78 | 379/409 | |||||||
| 29 | 3.74 | 1.01 | 83 | 1.78 | 388/409 | |||||||
| 30 | 3.91 | 1.58 | 89 | 1.91 | 49/67 | |||||||
| 31 | 3.86 | 0.84 | 87 | 1.75 | 388/409 | |||||||
| 32 | 4.03 | 0.75 | 76 | 1.67 | 388/409 | |||||||
| 33 | 4.44 | 0.81 | 83 | 1.72 | 62/67 | |||||||
| 34 | 3.65 | 0.46 | 92 | 1.75 | 42/67 | |||||||
| 35 | 4.15 | 0.63 | 89 | 1.75 | 41/67 | |||||||
| 36 | 4.21 | 0.74 | 89 | 1.73 | 58/64 | |||||||
| 37 | 5.72 | 2.16 | 88 | 1.75 | 41/62 | |||||||
| 38 | 4.58 | 1.32 | 89 | 1.75 | 45/62 | |||||||
| a Hydrogen column density, in units cm-2. | ||||||||||||
| b Normalization of the thermal eqpair model component. | ||||||||||||
| c The unabsorbed total model flux (without reflection) in units of erg cm-2 s-1. | ||||||||||||
| d The unabsorbed model flux from the nonthermal component, in units of erg cm-2 s-1. | ||||||||||||
| e Temperature of the emitting plasma in keV (for the thermal eqpair component). | ||||||||||||
| f Photon spectral index of the thermal eqpair component in the 2–10 keV range. | ||||||||||||
4 Discussion
4.1 Absorption
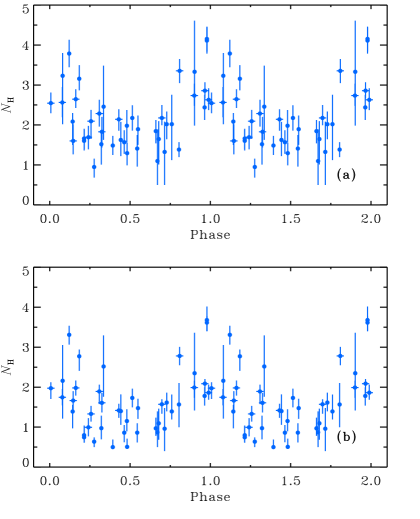
As noted in Sect. 3, the hydrogen column density was free in our fits. We find that our data require absorption significantly larger than cm-2 which is derived from the reddening towards the companion star (Bałucińska-Church et al., 1995).
Cyg X-1 is known to show X-ray dips in its light curve, caused by obscuration by the stellar wind from the companion star. During dips the absorption increases up to cm-2. The absorption shows strong orbital phase dependence with maximal column density around phase 0, when companion star is in front of the black hole (Feng & Cui, 2002; Bałucińska-Church et al., 2000). We plotted the fitted values of versus Cyg X-1 orbital phase (see Fig. 7), using the ephemeris with the time of the primary minimum at MJD and the period of days (Brocksopp et al., 1999; LaSala et al., 1998). We see a good correlation of with the orbital phase, which indicates that variable absorption indeed can be caused by the companion’s wind obscuring the X-rays from the black hole.
We note that since our models are relatively complicated in the range of 3–10 keV (consisting of absorption, Comptonization together with the seed photon emission and a soft excess), and also, the PCA energy range is affected by absorption rather weakly, it is difficult to determine the exact values of . Even though, the derived values of the parameter are in the range quoted by other authors and its relative changes are quite remarkable.
4.2 Spectral variability patterns
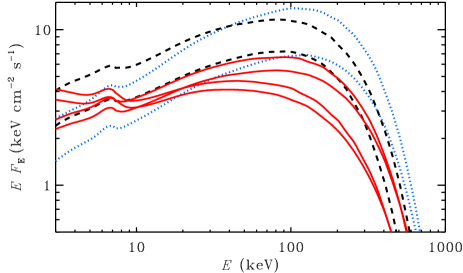
Using CGRO/BATSE and RXTE/ASM data, Zdziarski et al. (2002) showed that Cyg X-1 has two types of variability – changes of flux without spectral slope change and pivoting at 50 keV which produces anti-correlation of the fluxes in the soft and hard part of the spectrum. However, those instruments do not provide detailed spectral information giving fluxes only in some energy intervals. The effective photon spectral indices using fluxes in two energy bands and calculated in the wide (20-300 keV) energy interval, where real spectra experience a cutoff, should be treated with caution. Now we have a possibility to check the results of Zdziarski et al. (2002) using our set of observations, on which we have a detailed spectral information in the wide energy range. For this purpose we are using the model spectra obtained from model 1.
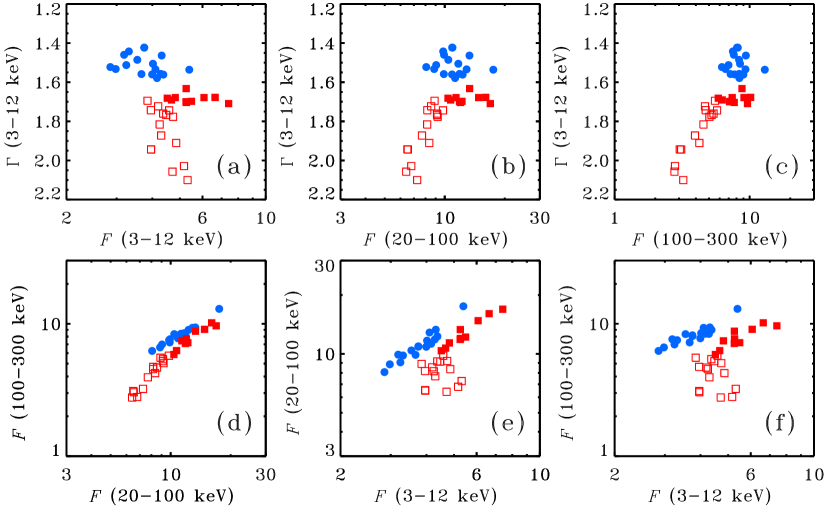
In Fig. 8 we present the spectra related to different time periods. It is possible to see that 1991, 1996 – 1998 spectra only change their normalization. However, spectral slope is different for various years and forms two groups: 1991+1997 spectra and 1996+1998 ones. In the 1999 data, we again can see normalization changes (see pairs of red solid curves) as well as pivoting behaviour.
The –flux correlations are shown on Fig. 9. It is clearly seen that the 1991 and 1996–1998 data do not show dependence between flux and . The 1999 data show clear anti-correlation between and flux on low energies (3–12 keV) and correlation on high energies (20-100, 100-300 keV), that indicates the pivoting behaviour with the pivot energy between 12 and 50 keV. On Fig. 9d (see also fig. 8 in Zdziarski et al. 2002), it can be seen that spectra from 1996 and 1998 are somewhat softer at high energies than the hard state spectra from 1991 and 1997, but the fluxes in all energy intervals generally correlate with each other. The 1999 spectra show clearly different dependence: the high energy fluxes are correlated, but there is a clear anti-correlation between 3–12 keV and 100–300 keV fluxes due to pivoting. The timing behaviour has also changed its nature in late 1998, as was pointed out by Pottschmidt et al. (2003).
4.3 QPO frequencies
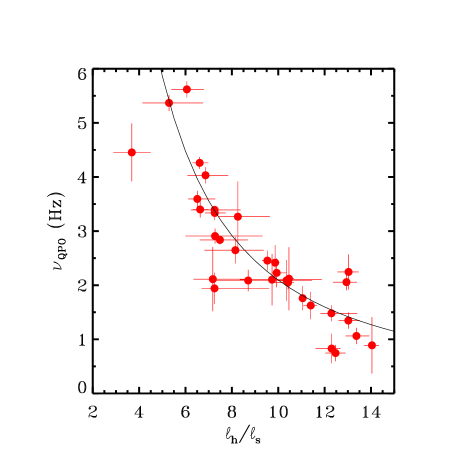
Among the data sets we have studied, there are timing data for 33 observations available from the recent paper by Axelsson, Borgonovo & Larsson (2005). This allows us to check the relation between the characteristic frequencies in the power density spectra and the spectral parameters. In the work of Axelsson et al. (2005), several values of QPO frequencies might be determined during one observation, and for these data points we assume the averaged middle frequency and consider the uncertainty from lower to higher of obtained values. In agreement with earlier results of GCR99, we find a clear anti-correlation between the characteristic frequencies of the aperiodic variability and (Fig. 10), indicating an apparent connection between QPO frequencies and the parameters of the Comptonizing region. This provides an argument (but not a proof) in favour of the presence of a hot inner corona and a variable inner radius of the surrounding disc.
4.4 Comparison between phenomenological and physical spectral models and correlation
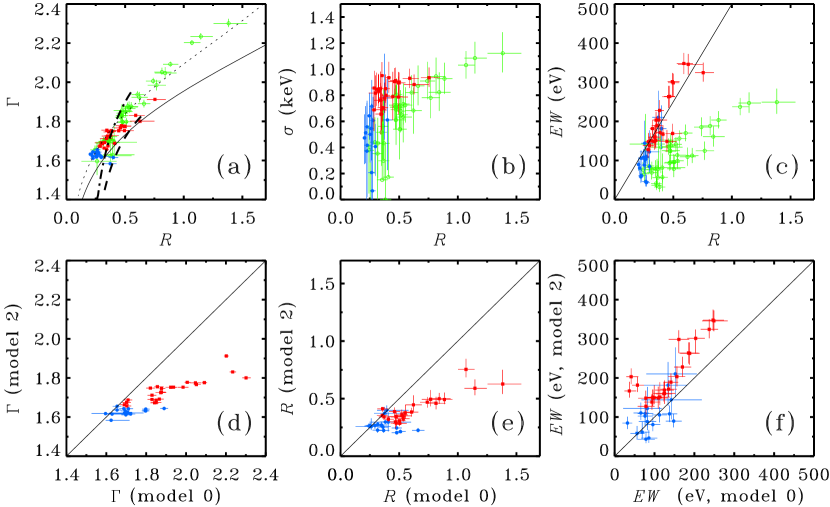
Fig. 11 compares the results obtained with the simple phenomenological model of power law + reflection in the 3–20 keV energy range (model 0) with those from our model 2 applied to the 3–1000 keV range. More elaborate and physically justified models utilizing the full energy range of our data do not change the picture qualitatively. On the quantitative level we find that the simple power law + reflection spectral fits to the 3–20 keV data overestimated the amplitude of the reflected component and the slope of the primary Comptonization continuum. We confirm, however, that the simple models did rank correctly the spectra according to the strength of the reflected component and slope of the Comptonized radiation, as it was demonstrated in the original publications on this subject (ZLS99; GCR99). It is also illustrated by the lower three panels of Fig. 11. The difference of the obtained parameters comes from the fact, that for wide-energy observations the main thermal Comptonization component that describes well the hard energy tail may lie well below the observed flux in the 2–10 keV range (see Fig. 3 and 5) and has a different slope in this band. The difference is largest for 1996, 1998 and 1999 data, while in the 1991 and 1997 cases the soft excess is weak and parameters obtained with the physical models are similar to those obtained with the phenomenological ones.
On Fig. 11a, we see a clear correlation between and . For comparison, we also show the dependencies predicted by the plasma ejection model of Beloborodov (1999a, b) and MBP01 (cylindrical geometry with ), using the geometric parameter of that model of and 0.5, , albedo of the reflecting medium of 0.15 and . We used the dependence between the amplification factor of Comptonization and from MBP01. We also compared our data with the dependence expected in the model of ZLS99, assuming the black body temperature of 0.2 keV, appropriate for Cyg X-1, with one minor change. In the original paper, all the reflection luminosity was assumed to reach the observer. Reflection amplitude is an integral that consists of two parts, from the disc inside the corona and from the outer part of it. We multiplied the part of luminosity coming from the former part by , to approximately take into account scattering of radiation in the corona ( was chosen). We see that this model cannot quantitatively describe the presented data. Moreover, taking into account intrinsic dissipation in the disc (see Appendix A for details) will further increase the slope of the dependence making the discrepancy larger. Intrinsic dissipation becomes important for a small inner disc radius (when reflection is relatively large) and the increase of soft seed photon flux in that case makes the spectrum softer (see Beloborodov 2001).
4.5 Physical scenario
The hard spectral state of black hole binaries is commonly defined as the state in which the spectrum is dominated by the hard Comptonization component, without significant contribution of the blackbody-type emission from the optically thick accretion disc. Naturally, the hard state is not characterized by a single, uniquely defined spectrum, but rather includes a continuum of spectral shapes with the major spectral parameters vary in a rather broad range. The diversity of the hard state spectra reflects the position of the source with respect to the “bottom hard” state and the soft state. Quantitatively, this position can be characterized by the strength of the reflected component (reflection scaling factor or Fe line equivalent width ) or properties of the main Comptonized component (Comptonization parameter, or Compton amplification factor , or the photon index in the low energy limit) or characteristic frequencies of the aperiodic variability. Existence of good correlations between all these quantities suggests that they all are an equally good measure of the source position within the hard state. The results found in earlier work (ZLS99; GCR99; Gilfanov et al. 2000; Gilfanov, Churazov & Revnivtsev 2004) and presented in the previous sections of this paper suggest the following pattern of spectral and temporal variability. Increase of the strength of the reflected component is accompanied by the increase of the width of the Fe line, increase of the characteristic QPO frequencies and softening of the Comptonized component observed as increase of its photon index in the low energy limit.
We find from our spectral analysis that in the “bottom hard” state the broad band spectrum (3-1000 keV) is mostly described by the single thermal Comptonization spectrum with superimposed component due to reflection of the primary emission from relatively cool and neutral, or partly ionized, optically thick matter (the accretion disc), with an additional relatively weak soft component. As the source moves towards the soft state, the strength of the reflected component increases, and the soft component becomes more significant. Considering the 3–1000 keV energy range covered by our data, this spectral component reveals itself most clearly in the keV energy domain as the “soft excess”. Another independent indication of spectral complexity is the gamma-ray power-law tail detected at MeV energies by the COMPTEL telescope (McConnell et al., 2002).
From the point of view of the formal fit quality, the keV excess can be described equally well by an additional thermal Comptonization component due to low temperature, low Comptonization parameter plasma or by non-thermal Comptonization with the power law index of accelerated electrons . Owing to the complex shape of the continuum at these energies defined by the superposition of several spectral components, these two possibilities can not be easily discriminated based solely on the low energy data. The task is further complicated by the rather limited low energy coverage provided by the PCA instrument, keV. However the above possibilities predict very different behaviour in the MeV energy domain, where the main thermal Comptonization component diminishes and the power law tail due to the non-thermal Comptonization should reveal itself. As the OSSE sensitivity and energy range are insufficient to probe existence of the MeV tail correlated with the keV excess, we can not, strictly speaking, give preference to either of these two models.
There are however several additional considerations to be taken into account: (1) COMPTEL detected a weak MeV tail in the averaged hard state data for Cyg X-1 (McConnell et al., 2002). The slope and amplitude of this tail is qualitatively consistent with the extrapolation of the non-thermal Comptonized component, required to explain the keV excess (Fig.5); (2) in the soft state the non-thermal power law is the dominant (the only) high energy component; (3) the keV excess is more pronounced in the spectra characterized by large reflection and rather steep slope of the main Comptonized component, i.e. in those sufficiently close to the soft state. Its strength seems to increase with increase of the reflection. These arguments suggest that the non-thermal origin of the keV excess is more plausible. We note, that the 1991 and 1997 data show much weaker excess. This may be explained by the lower relative luminosity of the non-thermal Comptonization component which therefore reveals itself at lower energies, below the keV threshold of the PCA instrument, but can be detected by instruments which have response at lower energies, i.e. BeppoSAX (see Frontera et al. 2001; Di Salvo et al. 2001).
The overall qualitative picture can be outlined as follows. The overall geometry of the accretion flow is adequately represented by the truncated disc model with the inner radius of the standard optically thick geometrically thin disc varying from to several tens . Inside this radius the accretion flow proceeds via quasi-spherical optically thin hot flow. The plausible mechanism governing the transition from the disc accretion to the coronal flow is the disc evaporation process as proposed by Meyer & Meyer-Hofmeister (1994). The geometrically thin disc gives rise to the soft black body type component. In addition, due to dynamo, solar-type magnetic flares can be produced above the accretion disc (Galeev et al., 1979). The electrons there can be accelerated and form non-thermal distribution. Comptonization of the disc emission on these electrons results in the power law-like Comptonized emission. The inner optically thin flow gives rise to the thermal Comptonization component. The relative contributions of non-thermal and thermal Comptonized components are defined by the fractions of the gravitational energy released in the disc (i.e. outside ) and in the inner hot flow (inside ). The position of the transition radius is defined by the mass accretion rate and is modified by the irradiation-related effects. The transition radius decreases as the mass accretion rate increases.
The QPOs are due to some processes in the transition region near and approximately scale with the Keplerian frequency and other characteristic time scales of the coronal flow and standard accretion disc in the transition region.
The configuration with the large inner disc radius, probably , corresponds to the classical hard state. The main features of this “bottom hard” state are low strength of the reflected continuum, relatively narrow fluorescent Fe line of small equivalent width, large Comptonization parameter of the thermal Comptonized component (hard spectra with the low energy photon index ), low frequencies of QPOs. As only small fraction of the gravitational energy is released in the disc, the contribution of the non-thermal component is small and the spectrum is adequately described by thermal Comptonization.
As the mass accretion rate increases, the transition radius decreases, the disc moves towards the compact object. This results in increase of the reflection, broader fluorescent Fe line, larger QPO frequencies, smaller , i.e. smaller Comptonization parameter in the inner hot flow. The contribution of the non-thermal component increases. The optical depth of the thermal plasma of the inner flow decreases due the shrinking of the inner hot flow as the disc extends towards the compact object.
The classical soft state (we ignore all the complications and sub-states here) corresponds to the accretion disc extending all the way towards the last stable orbit or very close to it. Correspondingly the inner hot flow disappears and the dominant or the only hard component is the one due to non-thermal Comptonization of the disc emission on the non-thermal electrons accelerated in the magnetic loops/flares above the disc.
The behaviour of the temperature of the thermal Comptonization component is unclear. It seems relatively constant, which suggests of possible presence of electron-positron pairs (see MBP01).
The physical scenario qualitatively outlined above is based on the truncated disc picture and on the assumption that the spectral evolution is governed by the change of the transition radius between the standard accretion disc and the hot inner flow. In this picture many of the observed correlations can be explained naturally. However, the correlation is significantly better quantitatively explained by the non-stationary corona model (MBP01), in which the governing parameter is the velocity of the blobs of emitting plasma relative to the accretion disc. We note that both models are geometrical in their nature and the predicted qualitative relations between the physical parameters are obtained with a number of simplifying assumptions. Therefore results of quantitative comparison of the model predictions with the observed pattern of the spectral variability should be interpreted with caution and any conclusions regarding validity of either model based on such a comparison would be premature.
5 Conclusions
Based on the broad band (3–1000 keV) data from simultaneous observations by Ginga and CGRO/OSSE in 1991 and PCA and HEXTE instruments aboard RXTE and OSSE in 1996–1999 we studied the spectral variability of Cyg X-1.
-
1.
We confirm earlier results on correlation. Considering the 3–20 keV data we find very tight one-parameter relations between reflection, spectral index and the width of the Fe line.
-
2.
More elaborate and physically justified models utilizing the full energy range of our data do not change the picture qualitatively. On the quantitative level we find that the simple power law + reflection spectral fits to the 3–20 keV data overestimated the amplitude of the reflected component and the slope of the primary Comptonization continuum. We confirm, however, that the simple models did rank correctly the spectra according to the strength of the reflected component and slope of the Comptonized radiation, as it was demonstrated in the original publications on this subject (ZLS99; GCR99).
-
3.
Based on the analysis of the broad band data we found that the spectra in our sample can be adequately described by the thermal Comptonized component with superposed reflection from the optically thick disc and a soft excess. This excess is relatively weak in case of hardest spectra of our sample (). As the strength of the reflection increases, the excess becomes much more significant. Presence of this excess was the primary reason for the simple spectral approximations of the 3–20 keV data to overestimate both and . The nature of this excess cannot be unambiguously determined from our data. Based on the circumstantial evidence we suggest that it is the lower energy part of the non-thermal Comptonized component with the power law index of accelerated electrons . At higher energies this non-thermal component reveals itself as a power law detected by COMPTEL at MeV energies in the average hard state spectrum of Cyg X-1.
-
4.
We note the variability of the absorption correlated with the phase of binary system. These results confirm previous findings of the X-ray dips in the source.
-
5.
The overall pattern of spectral and temporal variability can be summarized as follows. Increase of the strength of the reflected component is accompanied by the increase of the width of the Fe line, increase of the characteristic QPO frequencies and softening of the Comptonized component observed as increase of its photon index in the low energy limit or, equivalently, decrease of the Compton amplification factor . Simultaneously, the optical depth of the thermal Comptonization decreases and the fractional contribution of the non-thermal component to the total energy flux increases. The exact behaviour of the electron temperature in the hot inner flow is not constrained by our data.
-
6.
We suggest a qualitative physical scenario naturally explaining the observed behaviour. In this scenario the evolution of the spectral parameters is governed by the value of the transition radius between the standard optically thick accretion disc and the inner quasi-spherical hot flow. The thermal Comptonized component originates in the inner hot flow as a result of Comptonization of the soft photons emitted by the accretion disc. The origin of the non-thermal component is related to the optically thick disc, for example it can be produced due to non-thermal electrons accelerated near the surface of the optically thick disc in the solar-type magnetic flares. The relative contributions of non-thermal and thermal components to the total energy flux depends on the fractions of the gravitational energy of accreting matter released in the optically thick disc and in the hot inner flow.
Acknowledgments
We are grateful to Bryan Irby (NASA/GSFC) for help with converting the Ginga data, and to Magnus Axelsson for sharing the results of the timing analysis. This work was supported by the Centre for International Mobility and the Väisälä foundation (AI), the Academy of Finland grants 201079 and 204600 and the Wihuri Foundation (JP), and the NORDITA Nordic project in High Energy Astrophysics. AI was also supported by RFFI 02-02-17174 and presidential program for support of leading scientific schools NSH-1789.2003.2. AAZ was supported by KBN grants PBZ-KBN-054/P03/2001, 1P03D01827 and 4T12E04727.
References
- Arnaud (1996) Arnaud K. A., 1996, in Jakoby G. H., Barnes J., eds, ASP Conf. Ser. Vol. 101, Astronomical Data Analysis Software and Systems V. Astron. Soc. Pac., San Francisco, p. 17
- Axelsson et al. (2005) Axelsson M., Borgonovo L., Larsson S., 2005, A&A, submitted (astro-ph/0504446)
- Bałucińska & Hasinger (1991) Bałucińska M., Hasinger G., 1991, A&A, 241, 439
- Bałucińska-Church et al. (1995) Bałucińska-Church M., Belloni T., Church M. J., Hasinger G., 1995, A&A, 302, L5
- Bałucińska-Church et al. (2000) Bałucińska-Church M., et al., 2000, MNRAS, 311, 861
- Beloborodov (1999a) Beloborodov A., 1999a, ApJ, 510, L123
- Beloborodov (1999b) Beloborodov A., 1999b, in Poutanen J., Svensson R., eds, ASP Conf. Ser. Vol. 161, High Energy Processes in Accreting Black Holes. Astron. Soc. Pas., San Francisco, p. 295
- Beloborodov (2001) Beloborodov A., 2001, Adv. Space Res, 28, 411
- Bisnovatyi-Kogan & Blinnikov (1977) Bisnovatyi-Kogan G. S., Blinnikov S. I., 1977, A&A, 59, 111
- Brocksopp et al. (1999) Brocksopp C., Tarasov A.E., Lyuty V.M., Roche P., 1999, A&A, 343, 861
- Coppi (1992) Coppi P. S., 1992, ApJ, 258, 657
- Coppi (1999) Coppi P.S., 1999, in Poutanen J., Svensson R., eds, ASP Conf. Ser. Vol. 161, High Energy Processes in Accreting Black Holes. Astron. Soc. Pas., San Francisco, p. 375
- Di Salvo et al. (2001) Di Salvo T., Done C., Zycki P. T., Burderi L., Robba N. R., 2001, ApJ, 547, 1024
- Done et al. (1992) Done C., Mulchaey J. S., Mushotzky R. F., Arnaud K., 1992, ApJ, 395, 275
- Ebisawa et al. (1996) Ebisawa K., Ueda Y., Inoue H., Tanaka Y., White N. E., 1996, ApJ, 467, 419
- Esin et al. (1998) Esin A. A., Narayan R., Cui W., Grove E. C., Zhang, S.-N., 1998, ApJ, 505, 854
- Feng & Cui (2002) Feng Y. X., Cui W., 2002, ApJ, 564, 953
- Frontera et al. (2001) Frontera F. et al., 2001, ApJ, 546, 1027
- Galeev et al. (1979) Galeev A. A., Rosner R., Vaiana G. S., 1979, ApJ, 229, 318
- Gierliński & Done (2003) Gierliński M., Done C., 2003, MNRAS, 342, 1083
- Gierliński & Zdziarski (2003) Gierliński M., Zdziarski A. A., 2003, MNRAS, 343, L84
- Gierliński et al. (1997) Gierliński M., Zdziarski A. A., Done C., Johnson W. N., Ebisawa K., Ueda Y., Haardt F., Phlips B. F., 1997, MNRAS, 288, 958
- Gierliński et al. (1999) Gierliński M., Zdziarski A. A., Poutanen J., Coppi P. S., Ebisawa K., Johnson W. N., 1999, MNRAS, 309, 496 (G99)
- Gilfanov et al. (1999) Gilfanov M., Churazov E., Revnivtsev M., 1999, A&A, 352, 182 (GCR99)
- LaSala et al. (1998) LaSala J., Charles P.A., Smith R.A.D., Balucinska-Church M., Church M.J., 1998, MNRAS, 301, 285
- Gilfanov et al. (2000) Gilfanov M., Churazov E., Revnivtsev M., 2000, in Gang Zhao, Jun-Jie Wang, Hong Mei Qiu, Boerner G., eds, SGSC Conference Series, vol.1, Proceedings of 5-th Sino-German workshop on Astrophysics. p. 114 (astro-ph/0002415)
- Gilfanov et al. (2004) Gilfanov M., Churazov E., Revnivtsev M., 2004, in Kaaret P., Lamb F. K., Swank J. H., eds, AIP Conf. Proc. 714, X-ray Timing: Rossi and Beyond. AIP, Melville, p. 97
- Ichimaru (1977) Ichimaru S., 1977, ApJ, 214, 840
- Li & Miller (1997) Li H., Miller J. A., 1997, ApJ, 478, L67
- Ling et al. (1997) Ling J. C., et al., 1997, ApJ, 484, 375
- Magdziarz & Zdziarski (1995) Magdziarz P., Zdziarski A. A., 1995, MNRAS, 273, 837
- Malzac & Petrucci (2002) Malzac J., Petrucci P.-O., 2002, MNRAS, 336, 1209
- Malzac et al. (2001) Malzac J., Beloborodov A., Poutanen J., 2001, MNRAS, 326, 417 (MBP01)
- Matt (2001) Matt G., 2001, in White N. E., Malaguti G., Palumbo G. G. C., eds, AIP Conf. Proc. 599, X-ray Astronomy. Stellar Endpoints, AGNs and the Diffuse X-ray Background. AIP, Melville, p. 209
- McConnell et al. (1994) McConnell M. L. et al., 1994, ApJ, 424, 933
- McConnell et al. (2002) McConnell M. L. et al., 2002, ApJ, 572, 984
- Meyer et al. (2000) Meyer F., Liu B. F., Meyer-Hofmeister E., 2000, A&A, 354, L67
- Meyer & Meyer-Hofmeister (1994) Meyer F., Meyer-Hofmeister E., 1994, A&A, 288, 175
- Miller & Stone (2000) Miller K. A., Stone J. M., 2000, ApJ, 534, 398
- Narayan et al. (1998) Narayan R., Mahadevan R., Quataert E., 1999, in Abramowicz M. A., Björnsson G., Pringle J., eds, Theory of Black Hole Accretion Discs. Cambridge Univ. Press, Cambridge, p. 148
- Nowak et al. (2002) Nowak M. A., Wilms J., Dove J. B., 2002, MNRAS, 332, 856
- Perola et al. (2002) Perola G. C., Matt G., Cappi M., Fiore F., Guainazzi M., Maraschi L., Petrucci P.-O., Piro L., 2002, A&A, 389, 802
- Pottschmidt et al. (2003) Pottschmidt K. et al., 2003, A&A, 407, 1039
- Poutanen (1998) Poutanen J., 1998, in Abramowicz M., Björnsson G., Pringle J., eds, Theory of Black Hole Accretion Discs. Cambridge Univ. Press, Cambridge, p. 100
- Poutanen & Coppi (1998) Poutanen J., Coppi P., 1998, Physica Scripta, T77, 57
- Poutanen & Svensson (1996) Poutanen J., Svensson R., 1996, ApJ, 470, 249
- Poutanen et al. (1997) Poutanen J., Krolik J. H., Ryde F., 1997, MNRAS, 292, L21
- Revnivtsev et al. (1999) Revnivtsev M., Gilfanov M., Churazov E., 1999, A&A, 347, L23
- Revnivtsev et al. (2001) Revnivtsev M., Gilfanov M., Churazov E., 2001, A&A, 380, 520
- Różańska & Czerny (2000) Różańska A., Czerny B., 2000, A&A, 360, 1170
- Shakura & Sunyaev (1973) Shakura N. I., Sunyaev R. A., 1973, A&A, 24, 337
- Shapiro et al. (1976) Shapiro S. L., Lightman A. P., & Eardley D. M., 1976, ApJ, 204, 187
- Shimura & Takahara (1995) Shimura T., Takahara F., 1995, ApJ, 445, 780
- Sunyaev & Trümper (1979) Sunyaev R. A., Trümper J., 1979, Nat, 279, 506
- Sunyaev & Titarchuk (1980) Sunyaev R. A., Titarchuk L. G., 1980, A&A, 86, 121
- Svensson & Zdziarski (1994) Svensson R., Zdziarski A. A., 1994, ApJ, 436, 599
- Titarchuk (1994) Titarchuk L. 1994, ApJ, 434, 570
- Tout & Pringle (1992) Tout C. A., Pringle J. E., 1992, MNRAS, 259, 604
- Weaver et al. (1998) Weaver K. A., Krolik J. H., Pier E. A., 1998, ApJ, 498, 213
- Zdziarski et al. (1996) Zdziarski A. A., Gierliński M., Gondek D., Magdziarz P., 1996, A&AS, 120C, 553
- Zdziarski et al. (1997) Zdziarski A. A., Johnson W. N., Poutanen J., Magdziarz P., Gierliński M., 1997, in Winkler C., Courvoisier T. J.-L., Durouchoux Ph., eds, SP-382, The Transparent Universe, Proc. 2nd INTEGRAL Workshop. ESA, Noordwijk, p. 373
- Zdziarski et al. (1999) Zdziarski A. A., Lubiński P., Smith D. A., 1999, MNRAS, 303, L11 (ZLS99)
- Zdziarski et al. (2002) Zdziarski A. A., Poutanen J., Paciesas W. S., Wen L., 2002, ApJ, 578, 357
- Zdziarski et al. (2003) Zdziarski A. A., Lubiński P., Gilfanov M., Revnivtsev M., 2003, MNRAS, 342, 355
- Zdziarski & Gierliński (2004) Zdziarski A. A., Gierliński M., 2004, Progr. Theor. Phys. Suppl., 155, 99
Appendix A Dissipation and attenuation in the disc-hot flow model
ZLS99 have considered an idealized geometrical model for thermal Comptonization, reprocessing and reflection in an accretion flow consisting of a central hot sphere surrounded by a flat cold disc, see fig. 2 in ZLS99. The sphere has a unit radius, and the inner radius of the disc can assume any value, . For , there is an overlap between the two components. The hot sphere Comptonizes soft seed photons emitted by the disc. In the original model of ZLS99, the disc reprocesses and reemits only the photons emitted by the sphere incident on the disc.
Here, we generalize that model to include intrinsic dissipation in the cold disc (as expected in an accretion flow). Also, we take into account scattering of the Compton-reflected photons in the hot sphere, which was neglected in ZLS99. For completeness, we give here the full set of relevant equations, but refer the reader to ZLS99 for details of the derivation.
The hot sphere has a unit luminosity and emits isotropically. The total flux incident on the disc at a radius, , is then given by (ZLS99),
| (2) |
where
| (3) | |||||
where and are complete elliptic integrals. The luminosity of the disc due to reemission of photons incident on it is
| (4) |
This can be divided into the contributions to the integral from the parts of the disc at and , , where the first term is nonzero only for .
Then, the relative strength of Compton reflection can be identified (ZLS99) with the ratio of the luminosity of the disc due to irradiation to the fraction of the sphere luminosity that is not incident on the disc. However, we correct here for attenuation of the reflection from the parts of the disc with because of scattering by the hot electrons in the sphere. For the radial optical depth of the sphere , we can then write
| (5) |
Another effect not included in the treatment of ZLS99 is the intrinsic dissipation in the disc. Far away from the center (so any effect of the inner boundary condition is negligible), the dissipated flux per unit area is , and we assume it for . On the other hand, the dissipation in the part of the disc inside the hot sphere, , is reduced due to the transfer of the power to the hot plasma. We assume here that dissipation either to be null or constant matching that of the outside disk,
| (6) |
where we parametrized the relative intrinsic dissipation by the dimensionless factor, , defined as the intrinsic luminosity of the disc extending from to infinity (regardless of the actual value of ).
The power in seed photons scattered in the sphere from both the reprocessing and the intrinsic dissipation (assuming ) is then
| (7) | |||||
where is the albedo and the term given by the second line of equation (7) appears only in the case of the nonzero dissipation within the sphere and when .
The amplification factor of the process of thermal Comptonization is then . It can be related to the spectral index of the power-law part of the Comptonization spectrum using e.g. the formula of MBP01
| (8) |
where and for BHB with keV.