The OH 1612 MHz maser pump rates of stellar, interstellar and post-AGB OH masers.
Abstract
(Pseudo) radiative pumprate of OH 1612 MHz masers is defined for a sample of 44 OH/IR sources (infrared sources with OH 1612 MHz maser), irrespective of the real maser pumping mechanisms. The correlation between the (pseudo) maser pumprates and the evolutionary status of the maser sources reveals that the radiative pumprates of stellar OH masers are nearly fixed, which agrees with the theoretical prediction for radiatively pumped OH maser. The (pseudo) radiative pumprates of interstellar OH masers are not only very small but also varying broadly over two orders of magnitude, which is argued to be the manifestation of varying number of quiet absorbing OH cloudlets and/or various OH maser pumping mechanisms and/or competitive gain between mainline and 1612 MHz OH masers and/or anisotropy of the maser emission. The radiative pumprates of post-AGB OH masers very possibly decrease with increasing IRAS C32 color indices and distribute in an interim region between the stellar and interstellar OH masers in the pumprate-color diagram.
keywords:
Masers , Stars: AGB and post AGB stars , (Stars):circumstellar matter , ISM: H II regions1 Introduction
OH 1612 MHz masers have been found in different kinds of objects, such as OH Miras, OH/IR stars, Proto-Planetary Nebulae (PPNe), Planetary Nebulae (PNe), Red Supergiants (RSGs), H II regions (H IIs), molecular clouds, and so on (Elitzur, [1992]). The OH masers appearing in H IIs or molecular clouds, are called interstellar OH masers while those appearing in all other types of sources are called stellar OH masers, depending on whether the masing molecules originate from interstellar space (by accretion) or from the central star (by stellar wind). Because the OH masers in post-AGB sources, such as post-AGB stars, PPNe and PNe, show peculiar properties, as we will see below in the discussions of this paper, I would like to separate them from the stellar OH maser group to form a third group: post-AGB OH masers. Up till now, three different pumping mechanisms have been proposed for the OH 1612 MHz masers arising in different astronomical environments: radiative pumping, collisional pumping and chemical pumping. According to the recent developments in the maser pumping theory, more physical effects such as local and non-local line overlap (e.g., Pavlakis and Kylafis [1996a], [1996b]) were recognized to be playing important roles in certain cases. But little effort has been made to directly compare in observations the different pumping mechanisms of the OH 1612 MHz masers that occur in different kind of objects.
Among the different kinds of objects showing OH 1612 MHz maser, late type stars such as OH Miras, OH/IR stars and RSGs are believed to have their OH masers radiatively pumped. Most of these objects have a huge spherical, although perhaps clumpy, circumstellar dust-gas envelope. The OH 1612 MHz maser is formed in the outer part of the huge envelope and is pumped mainly by absorbing the 34.6 and 53.3 m photons. The physical environments in the three kinds of objects are a little different. For example, OH Miras often have optically thin dust envelope while OH/IR stars are usually embedded in very optically thick dust shell; RSGs have much higher luminosity and their dusty envelopes are harsher than that of OH Miras and OH/IR stars.
PPNe and PNe are objects immediately following the AGB evolutionary stage. The OH 1612 MHz maser inherited from their precursors can still survive for about 1000 years (Sun and Kwok [1987]). But due to the evident changes of the envelope, the survived OH 1612 MHz masers in PPNe or PNe are often found not in a spherical shell but in a circumstellar disk or bipolar outflow (e.g., Zijlstra et al. [2001]). The pump mechanism of these remanent OH masers is thought to be mainly radiative one too. However, for PPNe or PNe that show bipolar outflows, the OH masers can also appear in the interaction region between the outflow and the ambient interstellar material (Likkel and Morris [1988]) and, in this case, the OH masers may be pumped by collision.
OH 1612 MHz masers have been found in some H IIs in Star formation Regions (SFRs). They are often found accompanying with the OH main line masers (Caswell [1999], Szymczak and Gerard [2004]). The physical environment in SFRs is much more complicated than that in the circumstellar envelope of late type stars. The expanding ionized hydrogen sphere creates a geometrically thin but dense layer compressed by shock waves in the inner edge of the huge outer in-falling dust-gas envelope. The OH masers were believed to arise just in the shock compressed layer (Cochran and Ostriker [1977]). Additionally, high velocity bipolar outflow have been found in many SFRs (e.g., Campbell [1986], Shepherd [1996]), but it is not clear whether the OH 1612 MHz masers can be stimulated in the interaction region between the outflow and the ambient interstellar material.
The difference in physical environments results in different OH maser-pumping mechanisms at work. However, it is not easy to directly discriminate the different maser pumping mechanisms from observational aspects. In our previous two papers (He et al. [2004a] and He & Chen [2004b], hereafter Paper I and Paper II, respectively), we systematically analyzed the 34.6 and 53.3 m pumping lines in all Infrared Space Observatory (ISO) Short Wavelength Spectrometer (SWS) and Long Wavelength Spectrometer (LWS) spectra of known OH/IR sources (infrared sources showing OH 1612 MHz maser) and found that the (pseudo) radiative pumprates of OH masers arising in different environments are quite different. This paper continues to discuss another important problem: how the different kinds of 1612 MHz maser sources obey or violate the principle that the input of pumping photons should be proportional to the maser output for a radiatively pumped maser? Although similar job had been done in the past decades by other authors using IR photometrical data (e.g., Le Bertre et al. [1984], Dickinson [1987], Silva et al. [1993]), the available IR spectral data from ISO enable one to perform a more powerful analysis of the OH 1612 MHz maser pump rate by directly comparing the emission of maser photons to the absorption of IR photons. The potential of ISO spectra is dug out to the utmost to constrain the value or a reasonable range of the (pseudo) radiative maser pumprate for all OH/IR sample sources. In section 2, the data sets are organized and described. Some sources with ambiguous source types are re-identified based on literature information in section 3. The discussion of the (pseudo) radiative pumprates of different types of OH maser is given in section 4. Some related topics are discussed in Section 5. Section 6 briefly summarizes the main conclusions.
2 Observational data
Although not all OH 1612 MHz masers considered here are radiatively pumped, a pseudo radiative pumprate can be defined by temporarily assuming they are all radiatively pumped. This pseudo pumprate is defined as the integrated 1612 MHz OH maser photon flux divided by the sum of the integrated infrared absorption line photon fluxes at both wavelength: 34.6 and 53.3 m. As we demonstrated in paper I and II, this (pseudo) pumprate has the advantage to effectively distinguish OH masers arising in different physical environments and/or pumped by different mechanisms.
According to Paper I and II, six OH/IR sources have both the 34.6 and 53.3 m pumping lines detected by ISO; their (pseudo) maser pumprates that is defined as integrated line photon flux ratio had already been derived therein. Here the pumprates of the six sources are reproduced in Table 1 and these sources compose the ‘Sample 1’ of this paper. Also given in the table are the source type mainly given by SIMBAD database (http://simbad.u-strasbg.fr/sim-fid.pl) and the IRAS color C32=log(F60/F25), where in the case that no reliable IRAS fluxes are available for defining the color indices ISO spectra are used to derive equivalent IRAS fluxes using the IRAS photometrical filter templates in ISAP.111The ISO Spectral Analysis Package (ISAP) is a joint development by the LWS and SWS Instrument Teams and Data Centers. Contributing institutes are CESR, IAS, IPAC, MPE, RAL and SRON. (More remarks are given upon the derivation of equivalent IRAS fluxes in the last paragraph of this section.)
| Name | Type | C32 | Pumprate† |
|---|---|---|---|
| (1) | (2) | (3) | (4) |
| 072092540 | RSG | -0.66 | 0.079 |
| 174242859 | Sgr A* | 0.56 | 3.56e-6 |
| 174412822 | Sgr B2 | 2.28 | 1.56e-5 |
| 192441115 | RSG | -0.51 | 0.054 |
| Arp 220 | Mega | 1.11 | 0.32 |
| NML Cyg | RSG | -0.33@ | 0.041 |
-
:
The pumprates are defined as integrated line photon flux ratio and taken from paper II.
-
@:
No reliable IRAS fluxes are available to make IRAS color index C32, ISO spectra are used to derive equivalent IRAS fluxes.
There are 9 sources in paper I and II showing the 53.3 m absorption line in the ISO LWS spectra but with their 34.6 m lines not observed or not detected. They compose the ‘Sample 2’ in this paper. Among them, seven ones have 34.6 m ISO SWS spectra but the absorption line is too weak to be detected. In this case, 3 times of the standard deviation ( noise) of the continuum can be used to estimate an upper limit of the integrated line flux for these missing absorption lines when the line width (FWHM) has been estimated. (See how to estimate the line width in spectra of different resolutions in Appendix.) If all these missing 34.6 m lines are assumed to be in absorption, no matter how weak they are, the lower limit of the integrated line fluxes should be 0 W/cm2. The other two sources in sample 2 are not observed by ISO SWS at 34.6 m. In this case, the integrated photon flux of the 53.3 m line alone can be considered as a lower limit of the total integrated photon flux of both infrared pumping lines, because the missing 34.6 m line can be assumed to be in absorption. These upper and lower limits of the integrated infrared absorption line fluxes can then be transformed respectively into lower and upper limits of the (pseudo) maser pumprate. The derived pumprates are listed in Table 2 in which column (1) is IRAS name of the sources; column (2) is the source type; column (3) is IRAS color indices C32, where in the case that no reliable IRAS fluxes are available for defining the color indices ISO spectra are used to derive equivalent IRAS fluxes (See more remarks in the last paragraph of this section); column (4) is the integrated 53.3 m line flux (from paper II); column (5) to (7) are the ISO SWS spectrum name, standard deviation of 34.6 m continuum and the estimated lower and upper limits of the integrated 34.6 m line flux respectively (when more than one ISO SWS spectra are available for a source, the one with the lowest noise among the brightest ones are used); column (8) is the integrated flux of the OH 1612 MHz maser from literature; column (9) is the estimated upper and/or lower limit of the pumprate while column (10) gives the reference information and some notes for the OH maser flux data. The source types in column (2) are mainly from SIMBAD database while that of the two sources: IRAS 06319+0415 and IRAS 17431-2846 are re-identified by this paper (see the details in the next section). Note that, for the red supergiant IRAS 03507+1115, the pumprate is estimated to be in a pair of separated regions: ‘’ and ‘’. The reason for this strange situation is that the filling emission feature in the 53.3 m line profile of this source is so strong that the total flux integrated over the whole line profile becomes net emission! The same curious thing also happens for another red supergiant IRAS 07209-2540, but the difference is that the 34.6 m line of this latter source is detected to be very strong absorption, which effectively compensates the net emission in 53.3 m line when calculating maser pumprate. How the strong filling emission in the 53.3 m OH absorption line arises is an interesting question to answer, but it is not the task of this paper. Eventually, the positive region ‘’ is chosen for IRAS 03507+1115 in further analysis because negative pumprate is impossible for a radiatively pumped OH maser.
| Name | Type# | C32 | F | ISO34.6 | F | F | Pumprate | Notes∗ | |
|---|---|---|---|---|---|---|---|---|---|
| (1) | (2) | (3) | (4) | (5) | (6) | (7) | (8) | (9) | (10) |
| 035071115 | AGB | -0.85 | 1.37 | 80900805 | 6.91 | 3.24 | 0.004/-0.0008 | AOc | |
| 063190415 | PPN/PN | 0.41 | -0.83 | 0.118 | 4.96e-5 | AOa(1p) | |||
| 163423814 | pAGB | 0.16 | -5.39 | 45801328 | 5.61 | 25.11 | 1.101.62E-3 | LC96(fig.) | |
| 174242852 | H II | 0.99 | -50.34 | 1.64 | 1.14e-5 | SLW98∗1 | |||
| 174302848 | Cluster | 0.40@ | -21.72 | 84101302 | 9.48 | 1.81 | 2.632.91E-5 | LWH92 | |
| 174312846 | IR | 0.60@ | -31.6 | 67700503 | 19.8 | 1.86 | 1.592.06E-5 | SLW98∗2 | |
| 175742403 | H II | 0.77 | -93.2 | 09901027 | 51.9 | 41.7 | 1.201.56E-4 | BAU79 | |
| 183480526 | Mira | -0.14 | -2.82 | 47201016 | 2.19 | 550 | 0.0590.068 | AJG74(2p) | |
| 202553712 | H II | 0.61 | -26.52 | 13400330 | 22.8 | 0.113 | 1.271.49E-6 | AOe(1p) |
-
Note:
Although IRAS 06053-0622 was included in paper I and II, it is removed from this paper, because Dr. Peter te Lintel Hekkert recently confirmed (by private communication) that the detection of the 1612MHz maser towards this infrared source is untrustworthy.
-
*:
Reference codes: AJG74: Andersson et al. ([1974]); AOa: Chengalur et al. ([1993]); AOc: Lewis et al. ([1990]); AOe: Lewis ([1994]); BAU79: Baud et al. ([1979a]); LC96: te Lintel Hekkert & Chapman ([1996]); LWH92: Lindqvist et al. ([1992]); SLW98: Sjouwerman et al. ([1998]). (1p) means only one maser peak was observed; (2p) means it is a double peak feature but the literature only give the total integrated maser flux. (fig) means the integrated 1612 MHz OH maser fluxes are derived by measuring from the figure published in the relevant literature.
-
*1:
For IRAS 17424-2852, the closest OH maser used in the paper is OH0.06-0.018, but the maser position is about 2.34 arcmin away from the SIMBAD position of this infrared source!
-
*2:
The OH maser OH0.178-0.055 is identified for this IRAS source.
-
#:
Most of the object types come from SIMBAD database while that of 06319+0415 and 17431-2846 are re-identified in this paper (see the detail in the text).
-
@:
No reliable IRAS fluxes are available to make IRAS color index C32, ISO spectra are used to derive equivalent IRAS fluxes.
Many OH/IR sources in paper I and II were observed by both ISO SWS and LWS spectrometers but failed to have either of the two maser pumping lines detected. These sources (29 ones) compose the ‘Sample 3’ in this paper. The noise level of the 34.6 and 53.3 m continuum spectra can supply an estimate of the upper limit of the line-center depth of the two absorption lines, if they do exist but are buried by noise. Once the width (FWHM) of the two doublets are estimated (see how to estimate them in Appendix), the upper limit of the integrated line fluxes can be calculated. These upper limits can again be transformed into lower limits of the (pseudo) maser pumprates when the integrated 1612 MHz maser fluxes are known. The derived pumprate lower limits are listed in Table 3 in which column (1) is IRAS name of the sources; column (2) is the source type; column (3) is IRAS color indices C32, where in the case that no reliable IRAS fluxes are available for defining the color indices, ISO spectra are used to derive equivalent IRAS fluxes (See more remarks in next paragraph); column (4) to (6) are the ISO SWS spectrum name, the 34.6 m continuum flux and the relevant standard deviation respectively (when more than one ISO SWS spectra are available for a source, the one with the lowest noise among the brightest ones are used); column (7) to (9) are the ISO LWS spectrum name, the 53.3 m continuum flux and the relevant standard deviation respectively (when more than one ISO LWS spectra are available for a source, the one with the spectral resolution power not lower than 1500 and with the best quality are used); column (10) is the integrated flux of the OH 1612 MHz maser from literature; column (11) is the estimated lower limit of the pumprate while column (12) gives the reference information and some notes for the OH maser flux data. The source types in column (2) are mainly from SIMBAD database while that of 7 sources: 10197-5750, 18050-2213, 18498-0017, 19343+2926, 20077-0625, 22036+5306 and 22177+5936, are re-identified by this paper (see the details below).
Here I would like to discuss a little more about how the equivalent IRAS fluxes are derived from ISO spectra. Both ISO SWS and LWS spectra are composed of several wavelength sub-regions. The last 5 SWS wavelength sub-regions and the first 5 LWS wavelength sub-regions are needed for deriving IRAS 25 and 60 m photometrical fluxes. Five sources in the paper need to determine their IRAS color from ISO spectra (see sources whose C32 are marked by ‘@’ in Table 1, 2 and 3). It is found that the SWS and LWS spectra that are taken under different instrumental settings agree well with each other in the overlap wavelength region around 45 m for three sources: IRAS 18498-0017, IRAS 19039+0809 and NML Cyg. However, LWS spectra are found to be several times brighter than SWS spectra in the overlap region for the other two sources: IRAS 17430-2848 and IRAS 17431-2846. The large discrepancies are mainly due to three facts: both sources lie in the galactic center, the pointing directions of SWS and LWS observations are not strictly the same, and the apertures of the SWS and LWS spectrometers are different. The aperture of LWS (diameter of ) is more than 8 times larger than that of SWS (). Although I tried to choose SWS and LWS observations pointing as closely as possible, the difference in pointing directions between SWS and LWS is still large: for IRAS 17431-2846 and for IRAS 17430-2848. The galactic center is crowed with all kinds of infrared sources, hence the differences in aperture size and pointing mean that the pair of SWS and LWS spectra do not strictly belong to the same source. Therefore, the IRAS fluxes derived in such a way for the two galactic center sources should be treated with caution. The IRAS 25 and 60 m fluxes derived are: 120 and 299 Jy for IRAS 17430-2848, 361 and 1430 Jy for IRAS 17431-2846, 88.8 and 187 Jy for IRAS 18498-0017, 190 and 73 Jy for IRAS 19039+0809, 5605 and 2608 Jy for NML Cyg, while the corresponding IRAS color C32 (=log(F60/F25) ) is 0.40, 0.60, 0.32, -0.41 and -0.33, respectively.
3 Source type identification
Most of the source types listed in column (2) of Table 1, 2, 3 are from SIMBAD database. But sometimes the source classification in SIMBAD is not clear or not clearly related to the evolutionary status of the source (e.g., ‘variable star’, ‘emission line star’, ‘infrared source’, and so on). In order to make clear the evolutionary status of the embedded stars associated with these OH masers, identification work is performed below on the basis of literature analysis for several ambiguous sources:
| Name | Type# | C32 | ISO34.6 | F | ISO53.3 | F | F | Pumprate | Notes∗ | ||
|---|---|---|---|---|---|---|---|---|---|---|---|
| (1) | (2) | (3) | (4) | (5) | (6) | (7) | (8) | (9) | (10) | (11) | (12) |
| 010371219 | OH/IR | -0.65 | 57700828 | 432.6 | 1.72 | 57701103 | 170.4 | 2.4 | 72.48 | 1.56E-2 | AOb |
| 013046211 | Mira | -0.37 | 78800604 | 268.2 | 3.99 | 61300914 | 141.8 | 3.4 | 98.68 | 9.63E-3 | B78(fig) |
| 055062414 | HH | 0.21 | 69901113 | 88.2 | 1.99 | 83901512 | 112.3 | 2.5 | 0.43 | 16.86E-5 | AOa |
| 070277934 | PN | -0.29 | 73501035 | 92.9 | 1.69 | 56700908 | 29.2 | 2.3 | 39.01 | 8.05E-3 | tL-H(fig) |
| 101975750 | PPN/PN | -0.27 | 25400259 | 470 | 5.81 | 10300135 | 634.7 | 5.1 | 198.99 | 8.74E-3 | SAP93(fig)∗1 |
| 105801803 | SRb | -0.79 | 22800918 | 130 | 1.14 | 22800816 | 78.7 | 4.4 | 0.036 | 4.99E-6 | ELG03(fig) |
| 154525459 | pAGB | 0.05 | 45900615 | 342.2 | 6.04 | 48800916 | 339.5 | 9.3 | 89.67 | 3.91E-3 | tL-H(fig) |
| 162804008 | PN | 0.36 | 28901214 | 63.7 | 1.77 | 08402635 | 107.2 | 4.6 | 0.225 | 2.92E-5 | LC96(fig) |
| 171033702 | PN | 0.4 | 28902017 | 456 | 4.84 | 48903704 | 846.5 | 4.4 | 1.88 | 2.42E-4 | ZLP89(fig) |
| 171503224 | pAGB | -0.08 | 28902214 | 408.8 | 5.94 | 32702239 | 294 | 5.1 | 2.25 | 1.13E-4 | ATCAb(fig,1p)∗2 |
| 174113154 | OH/IR | -0.3 | 13601695 | 2867.5 | 22.7 | 46901615 | 1382 | 5.0 | 659.2 | 1.76E-2 | GWW89(fig) |
| 174633700 | PN | -0.69 | 32400609 | 16.6 | 2.31 | 32400610 | 6.4 | 4.0 | 0.336 | 1.96E-5 | SIH95 |
| 180502213 | RSG | -0.72 | 09900171 | 709.9 | 8.33 | 33100802 | 290.5 | 4.4 | 430 | 2.97E-2 | MBD74(fig) |
| 181961331 | YSO | 0.92 | 12200841 | 1736.7 | 11.3 | 34000203 | 4476 | 13.1 | 2.65 | 9.87E-5 | LC96(fig)∗3 |
| 182720114 | OrV* | -0.47 | 51301128 | 43.5 | 2.04 | 14900719 | 93.7 | 3.1 | 0.026 | 4.74E-6 | AOe(1p) |
| 184980017 | OH/IR | 0.32@ | 32001560 | 173.1 | 3.64 | 32300501 | 173.7 | 4.6 | 0.55 | 4.76E-5 | AOa |
| 185600638 | Mira | -0.52 | 70900322 | 24.9 | 4.29 | 70900321 | 128.7 | 3.3 | 154.8 | 1.47E-2 | AOa |
| 185960315 | OH/IR | 0.2 | 32301106 | 30 | 2.30 | 49901207 | 32.5 | 1.4 | 34.86 | 5.87E-3 | AOa |
| 190390809 | Mira | -0.41@ | 48903803 | 132.8 | 1.60 | 31600514 | 45.6 | 1.68 | 103.0 | 3.44E-2 | SSF88 |
| 191140002 | pAGB | -0.1 | 32002241 | 765.6 | 2.94 | 52500806 | 660.4 | 2.7 | 119.3 | 2.51E-2 | L89 |
| 192190947 | PN | -0.34 | 32002529 | 44.7 | 1.01 | 54700310 | 44.7 | 2.9 | 11.14 | 2.33E-3 | ZLP89(fig)∗1 |
| 192552123 | PN | 0.22 | 17600529 | 44.1 | 1.96 | 17600528 | 48.6 | 2.4 | 2.39 | 3.63E-4 | B78(fig)∗1 |
| 193432926 | pAGB | 0.3 | 52000719 | 106.8 | 1.73 | 36701902 | 122.2 | 4.6 | 0.36 | 4.68E-5 | AOa |
| 200004954 | Mira | -0.8 | 37400126 | 27.4 | 3.13 | 26300417 | 2.2 | 1.8 | 2.89 | 3.64E-4 | OWMS |
| 200770625 | OH/IR | -0.69 | 17000529 | 60.7 | 3.56 | 34400719 | 207.8 | 9.1 | 15.9 | 8.81E-4 | WB72 |
| 220365306 | PPN/PN | 0.36 | 39500297 | 90.4 | 2.02 | 54800798 | 119 | 6.2 | 4.06 | 3.34E-4 | LC96(fig) |
| 221766303 | H II | 0.86 | 06401146 | 2738.2 | 16.6 | 82301123 | 11792 | 39.5 | 0.16 | 2.39E-6 | BLS90(fig,1p) |
| 221775936 | OH/IR | -0.4 | 28300921 | 158 | 2.90 | 28300920 | 94.2 | 3.0 | 134.2 | 1.50E-2 | BHMW |
| 234121533 | Mira | -0.91 | 18100530 | 202.8 | 3.02 | 20000913 | 67 | 2.74 | 0.04 | 4.99E-6 | ISH94 |
-
*:
Reference codes: AOa, AOe, LC96 are the same as in Table 2 while the others are: AOb: Eder et al. ([1988]); ATCAb: Sevenster et al. ([1997]); BHMW: Baud et al. ([1979b]); BLS90: Braz et al. ([1990]); B78: Bowers ([1978]); ELG03: Etoka et al. ([2003]); GWW89: Gaylard et al. ([1989]); ISH94: Ivison et al. ([1994]); L89: Likkel ([1989]); MBD74: Masheder et al. ([1974]); OWMS: Olnon et al. ([1980]); SAP93: Silva et al. ([1993]); SIH95: Seaquist et al. ([1995]); SSF88: Sivagnanam et al. ([1988]); tL-H: te Lintel Hekkert et al. ([1991]); WB72: Wilson & Barrett ([1972]); ZLP89: Zijlstra et al. ([1989]). (1p) means only one maser peak was observed; (fig) means the integrated 1612 MHz OH maser fluxes are derived by measuring from the figure published in the relevant literature.
-
*1:
No data for the red maser peak, so only the blue peak is used.
-
*2:
The maser OH353.844+02.984 is identified for 17150-3224.
-
*3:
For 18196-1331, the OH 1612 MHz maser show four peaks, here the sum of integrated maser fluxes of the two low velocity peaks and the sum of the two high velocity peaks are presented in column (10).
-
#:
Most of the object types come from SIMBAD database while that of 10197-5750, 18050-2213, 18498-0017, 20077-0625, 22036+5306 and 22177+5936 are re-identified in this paper (see the detail in the text).
-
@:
No reliable IRAS fluxes are available to make IRAS color index C32, ISO spectra are used to derive equivalent IRAS fluxes.
IRAS 06319+0415: SIMBAD assigned this source to be an unknown infrared source. Lada and Gautier ([1982]) studied the energetic molecular outflow of this source by millimeter-wave and infrared observations. They found that the source, which is located in the Rosette molecular cloud outside the solar circle, shows anisotropic high velocity outflow and radio continuum. They reviewed that this source, with no visible counterpart, might be a nonstellar object. But the very strong Br recombination line indicates that it is not a usual H II region. Lenzen et al. ([1984]) performed high resolution infrared imaging to this source and found that it is a double source with the main direction of its CO-mass outflow nearly perpendicular to the direction of the separation of the two components. Castelaz et al. ([1985]) also found from near infrared imaging that this source is composed of two parts: a compact H II region and a very young prestellar object. They suggested that it is very likely a binary system. Colin ([1998]) further pointed out from the image of multiple non-axially symmetric near-IR bow shocks around this source that both components of the binary system can produce actively driven outflow in different phases. Phelps and Lada ([1997]) obtained J, H, K near infrared image for the source with higher spatial resolution and identified it to be a cluster embedded in the Rosette Molecular Cloud. From these pre-existed studies, it can be concluded that this source is a peculiar H II region that shows active outflow and very possibly resides in a binary system or even in cluster.
IRAS 10197-5750: This source is classified as Wolf-Rayet (WR) star in SIMBAD, but the classification is wrong. Roberts ([1962]), for the purpose of statistical work, tentatively classified it as a WR star on the base of unpublished finding of widened H emission, and thereby it gained the popular name Roberts 22 from his catalogue. However, the signpost of WR star should be Helium emission line instead of H. Recent works such as that of Sahai et al. ([1999]) and Zijlstra et al. ([2001]) studied the morphology of this source by high resolution imaging with the Hubble Space Telescope and the Australia Telescope Compact Array and proved that it is a PPN with bipolar outflow and with OH maser points located on the edge of a torus-like disk. Dyer et al. ([2001]) reviewed the physical status of this source and concluded from the already known optical, OH maser and near infrared observations, and especially from the presence of Fe II absorption, the absence of He I and the weakness of the Balmer absorption lines that it might be a PPN with a hidden A2 Ie central star. They also demonstrated in an astrometric way that the OH masers arise in the equatorial waist of the optical bipolar outflow and the maser kinematics support the classification of PPN. Garcia-Hernandez et al. ([2002]) also demonstrated from the H2 emission from this source that it is a post AGB star. From these previous works, this source should be classified as an OH-PPN.
IRAS 17431-2846: This source is close to Galactic Center (GC). Many infrared sources crowd around the source position and both the IRAS and ISO SWS/LWS beams are large enough to include more than one IR sources. So it is difficult to associate the observed IRAS or ISO data to a single star. Therefore, in this paper, this source keeps the original classification from SIMBAD: infrared source. But its OH 1612 MHz maser is considered as interstellar OH maser in this paper, because it is very close to GC where a lot of interstellar OH masers exist.
IRAS 18050-2213: SIMBAD classifies this source as a Semi-Regular (SR) variable. Lockwood & Wing ([1982]) concluded from the multi-wavelength light variation and spectral type of this source that it is a cool supergiant. Further more, SiO and H2O masers have been found by Yu ([1992]), Greenhill et al. ([1995]) and Pashchenko & Rudnitskii ([1999]), which further confirms its late type star nature.
IRAS 18498-0017: SIMBAD classifies this source as a Mira variable. Nyman et al. ([1993]) did not detect SiO maser towards this source. But Palagi et al. ([1993]) did find H2O maser towards it. Groenewegen ([1994]) used the distance of 4.8 kpc to constrain a luminosity of 15800 L⊙ for it. Combining with a very long light variation period of 1539 days and a huge mass loss of M⊙/yr, Groenewegen identified this source to be an extreme OH/IR star. This identification also agrees to the lack of SiO maser and the finding of H2O maser, that is to say, it may be on the way leaving AGB.
IRAS 20077-0625: SIMBAD classifies this source as a Mira variable. Hashimoto & Izumiura ([1997]) reported that this source looks like a compact stellar source on the 60 and 90 m images. They also judged from the shape of the spectral energy distribution (SED) and very large mass loss rate (M⊙/yr) that it is an OH/IR star on the top of AGB.
IRAS 22036+5306: SIMBAD classifies this source as an OH/IR star. However, Sahai et al. ([2003]) argued that this is a PPN because they found that the central star belongs to F5 spectral type and shows optical Hα and Hβ emission and there exists an extended bipolar nebula around it. Zijlstra et al. ([2001]) confirmed that the OH maser occurs in a shell and a linear outflow and took it as a typical OH-PN. Therefore it should be an OH-PPN/PN rather than an OH/IR star.
IRAS 22177+5936: SIMBAD classifies this source as a variable star. Sylvester et al. ([1999]) observed the circumstellar dust radiation of this source by ISO and determined a mass loss rate of M⊙/yr together with a color temperature of 400K for the circumstellar envelope. The mass loss rate is typical for a Mira or OH/IR star of small mass. Maser observations resulted in the detections of SiO (Cernicharo et al. [1997]) and H2O (Gonzlez-Alfonso et al. [1998]) masers towards this source. Van Langevelde et al. ([1990]) derived a luminosity of L⊙ using the distance determined by OH maser phase lag method and an infrared variation period of 1460 day for the source, which demonstrated that the star can not be a Mira or a red supergiant but a small mass OH/IR star on or near the top of AGB. The fact that Jiang et al. ([1997]) tried but failed to identified the optical counterparts of the star up to 20 mag in V band and 19 mag in I bands also supports that it is a star with very thick circumstellar envelope: OH/IR star.
4 The OH maser pumprate of different types of source
One of the main tasks of this paper is to investigate whether the late type stars whose OH 1612 MHz masers are thought to be radiatively pumped show proportional relationship between the IR absorption and the maser emission (i.e., show fixed pumprate) and whether the H IIs whose OH 1612 MHz maser can be pumped by variety of mechanisms violate this relationship (i.e., show varying pumprates). The pumprates of sample 1 sources and the pumprate ranges of sample 2 sources are shown in Fig. 1. The distribution of the six sample 1 sources can be grouped obviously into 3 regions: the three RSGs lie in the upper left region, the two galactic center (GC) sources lie in the lower left region while the only megamaser Arp 220 lies high up in the middle top of the figure. The large differences in the (pseudo) radiative pumprates of different types of maser sources had already been addressed in paper I and II. Taking account the sample 2 sources, one can see in Fig. 1 that the separation of stellar OH masers (RSGs, Mira) from interstellar OH masers (H IIs, cluster, GC sources) still holds while two post-AGB sources (pAGB, PPN) lie between the two regions. One should note that the three RSGs and the Mira crowd tightly around the pumprate of about 0.06 while the interstellar OH masers distribute in a large area with their (pseudo) OH maser pumprates varying for almost two orders of magnitude.
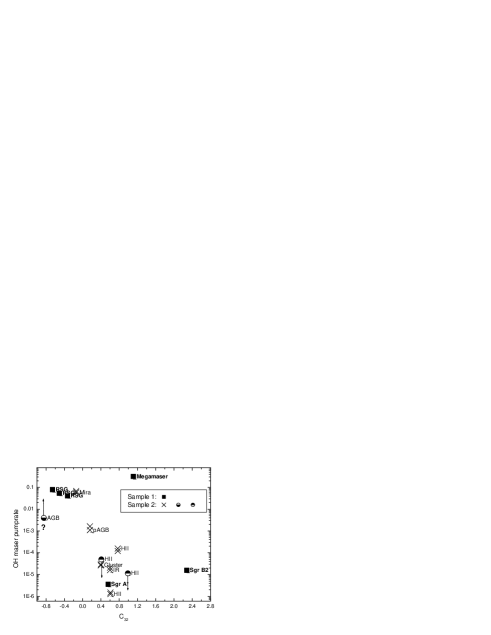
This difference in variation range of the OH maser pumprates sheds light on the maser pumping mechanisms of the sources. The nearly fixed pumprates of stellar OH 1612 MHz masers supports the argument that they are really mainly radiatively pumped, because the absorption of IR photons is proportional to the emission of maser photons. But the low value and large variation of maser pumprates of interstellar masers may be due to several possible reasons. Firstly, the most significant factor is the difference in physical environments. Compared with late type stars, SFRs usually have more extended, thicker and colder circumstellar envelope. The OH molecules can be produced not only in the inner edge of the dusty envelope by either high temperature stellar radiation or by shock waves, but also in the outer edge of the envelope by interstellar UV radiation (similar to that occurs around late type star). Maybe not all the OH molecular cloudlets in SFRs can successfully stimulate maser action. For example, Szymczak & Grard ([2004]) found 36 H II regions to show blue shifted OH main line absorption, and argued that these absorptions may be caused by the OH molecules formed in front of the central continuum sources. Lets call such non-maser OH cloudlets quiet OH cloudlets. Therefore, if a significant number of OH cloudlets in H IIs are quiet, the pseudo pump rate will become small and change with changing number of quiet OH cloudlets. Secondly, the difference in maser pumping mechanisms can also contribute to the large variation of the (pseudo) maser pumprates. The OH maser pumping mechanism in H IIs was incipiently considered collision because the masing OH molecules were believed to be produced in the shock compressed geometrically thin layer between the inner ionized hydrogen sphere and the outer dusty envelope (Elitzur [1992]). However, later works (e.g., Pavlakis & Kylafis [1996a], [1996b]) showed that the radiative OH maser pumping involving local and non-local line overlap effects are also possible for H IIs, because there usually exists a remarkable velocity field in the OH masing region therein. Further more, Thissen et al. ([1999]) and Liu et al. ([2004]) demonstrated by their dynamical calculations that the chemical pumping of OH masers is also possible in H IIs. It is evident that the quite different OH maser pumping mechanisms will involve quite different energy level transition schemes among the OH rotational levels, which may result in quite different (pseudo) maser pumprates, so as to explain the scattered distribution of interstellar OH masers in Fig. 1, 2 and 3. Thirdly, many interstellar OH masers are found to be strong mainline OH masers (e.g., Caswell & Haynes [1983]). Because the 1665 and 1667 MHz mainline maser transitions share the upper and lower energy levels with the 1612 MHz transition respectively, the strong mainline masers may weaken the 1612 MHz maser through the so-called competitive gain (Field [1985]), and hence result in very small 1612 MHz pump rate. Lastly, the anisotropy of the maser region may also play a role in the small and varying pump rates. Most interstellar OH masers are found to show irregular morphology, and sometimes bipolar morphology (e.g., Hutawarakorn et al. [2002]). OH maser is usually strongly beamed. If the strongest beam is not pointing to us, the observed maser flux can significantly decrease, and then results in very small pump rates and the pump rates will highly vary with varying maser beam pointing.
One may have noted that a post AGB star and a PPN in Fig. 1 lie between the two groups of masers: stellar OH masers and interstellar OH masers. This hints that the pumprates of these post AGB objects may form a bridge connecting the two typical kinds of OH masers due to some unknown reasons. This point will be confirmed below when the sample 3 sources are included in Fig. 2 and 3.
The sample 3 sources only have lower limit estimation of the (pseudo) OH maser pumprate. These lower limits are compared with the more accurate pumprates or pumprate ranges of the sources from sample 1 and 2 in Fig. 2. The distribution areas of interstellar OH masers, including those arising in H IIs, SFRs, Young Stellar Objects (YSOs), an Herbig-Haro object (HH), a stellar cluster near GC, an unknown infrared source near GC and the two GC sources, are shown with hatched squares in Fig. 2. One can see from the figure that, on the one hand, the interstellar OH masers are well separated from the stellar OH masers and show very small (pseudo) maser pumprates, on the other hand, these lower limits seem also to follow the decreasing trend from stellar OH masers in the upper left region to the interstellar OH masers in the lower right region. However, a few sources in the lower left corner have the typical IRAS C32 color of stellar OH maser but show abnormally small pumprate lower limits.
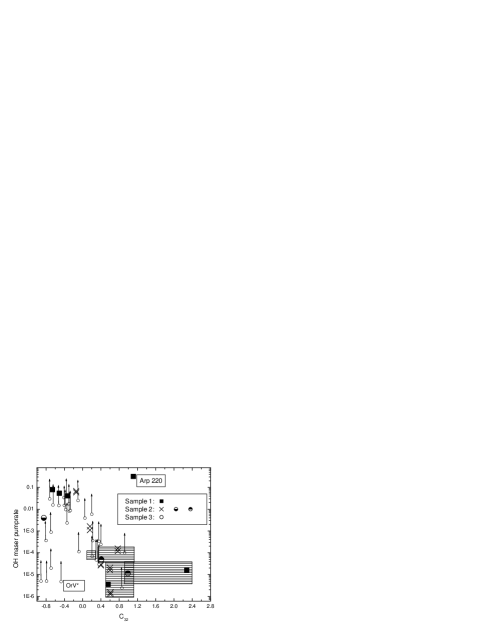
The behavior of the maser pumprate lower limit distribution in Fig. 2 is not only related to the nature of the different types of OH masers but also largely affected by the discrepancy between the maser pumprate lower limits and the true maser pumprates. However, this unknown discrepancy can be partly reflected by the signal to noise (S/N) ratio of the infrared spectra. The S/N ratio is defined for the 34.6 and 53.3 m continuum fluxes respectively using the noise listed in Table 3, and then a mean S/N ratio is defined as the mathematical average of the two. The S/N ratios of sample 3 sources turn out to be varying quite a lot (ranging from 4.4 to 252.5). One can find from Table 3 that the noise at the two wavelengths do not vary too much. The large variation of the S/N ratios mainly originates from the variation of the IR brightness of the sources. Therefore, the sources with lower S/N ratios are mainly those with lower IR brightness and hence with smaller OH absorption depths (if all sources are assumed to have approximately the same relative OH absorption depth). In such sense, the maser pumprate lower limits derived from spectra with higher S/N ratio are generally closer to the true maser pumprates while those derived from spectra with very poor S/N ratio is generally far smaller than the true maser pumprates.
To visualize the effect of the S/N ratios, Fig. 2 is re-drawn in Fig. 3 in which the sample 3 sources are shown in black balls with the ball size proportional to the S/N ratio while the sample 1 and 2 sources are all shown in open circles. One can easily see from this figure that the positions of the largest balls, i.e., those sample 3 sources with the maser pumprate lower limits most close to the true maser pumprates, are well coincident with the distribution regions of stellar and interstellar OH masers from sample 1 and 2, which confirms once again the difference in OH maser pumprates between the two typical kinds of OH masers. Those stellar-OH-maser mimics with unexpected too small maser pumprate lower limits (i.e., sources located in the dotted line circle in Fig. 3) are all sources with poor S/N ratios (with small ball sizes in the figure). That is to say, the too small maser pumprate lower limits of these sources should be blamed to the too weak apparent IR brightness and hence the too poor quality of the spectral data.
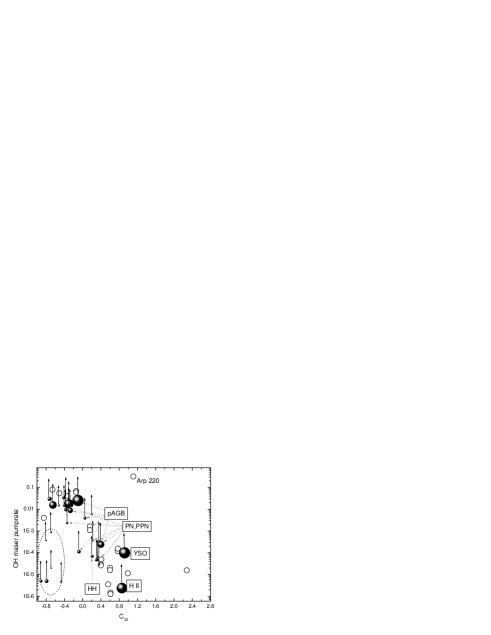
In Fig. 3, all post-AGB stars and PNe/PPNe are marked by gray dotted-line arrow. As one can see, these post AGB sources mainly occupy the region between the two regions of stellar and interstellar OH masers. This fact confirms the earlier guess that the post AGB sources may have intermediate pumprates to bridge the two typical kinds of OH masers. This transitional behavior of maser pumprate may be due to the physical changes happened in post AGB stars, e.g., the change of the envelope morphology, the detachment of the inner edge of the circumstellar envelope, which results in the sharp decrease of the amount of hot dust grains that are responsible to emit most of the infrared maser-pumping photons, and so on. However, this bridging phenomenon is mainly supported by the lower limit estimations of the maser pumprates of sample 3 sources, it is necessary to obtain more accurate OH maser pumprates for these sources in the future to further confirm this finding.
5 Discussion
OH 1612 MHz maser pump rates of stellar masers are found to be nearly constantly around 0.06 from this paper. The model of Elitzur et al. ([1976]) predicted that five to ten 34.6 m photons are needed to produce a maser photon (corresponding to a pump rate of ). Realizing that the pump rates derived in this paper have taken account the contribution of 53.3 m line, the derived pump rates basically agree with the theoretical prediction. If all energy level transition processes, such as collision, local and non-local line overlap, are taken account in the theoretical model and the maser pump rate can be defined in the same way as in this paper, it is reasonable to expect a better agreement between the theoretical and observed OH maser pump rates for stellar masers.
Previous statistical works usually defined the 1612 MHz maser pump rate using the 35 m photometrical data and the peak maser flux intensity. This definition is only a loose lower limit of the true pump rates, hence the derived ‘pump rates’ strongly varied from star to star. For example, both Silva et al. ([1993]) and Chen et al. ([2001]) used the definition . The former derived pump rates ranging from for a sample of OH/IR stars with very cool envelope, while the latter found that the pump rates were increasing with IRAS color log() and distributed in a broad range from 0.001 to 1 for a sample of OH/IR stars with type E or type A IRAS/LRS spectrum. Werner et al. ([1980]) used the same definition and found a pump rate range for five OH/IR stars with very thick envelope. The large variations among these ‘pump rates’ are mainly due to the fact that the ‘pump rate’ is only a coarse lower limit. One may note that the pump rates found by these authors are usually far larger than the value 0.06 found in this paper. This is because the pump rate is defined differently in this paper using integrated photon fluxes. Some authors also tried to defined pump rate with integrated line fluxes in an approximate way: . But the pump rate defined in this way also suffers large uncertainty and varies strongly. For example, Le Bertre et al. ([1984]) derived such pump rates of 0.05 for three type II OH/IR stars while David et al. ([1993]) found in similar way that the maser pump rates range from 0.0005 to 0.25 (note that these pump rates are defined by energy fluxes instead of photon fluxes). In this paper, the properly defined 1612 MHz maser pump rates shown for the four stellar OH masers in Fig. 1 distribute in a narrow range (), which forcefully confirms the radiative pumping nature of these stellar OH 1612 MHz masers. However, the lower limits of the pump rates of stellar OH masers (sources with small color indices in Fig. 2 and 3) still distribute in a broad range (), which demonstrates that the lower limit of OH 1612 MHz maser pump rate estimated using spectral noise level is already not reliable, not to mention those defined by photometrical data.
The fact that interstellar OH masers show smaller 1612 MHz maser pump rates had been addressed by other authors using the pump rate defined by IR photometrical data. Le Bertre et al. ([1984]) found that the maser pump rate defined as is larger than 0.01 for three type II OH/IR stars but smaller than 0.01 for a type I source. Dickinson ([1987]) used the definition and found that the pump rates range from about 0.07 to 0.2 for type II OH/IR stars but are about 0.02 for type I sources. However, these contrast between type I and type II OH/IR sources are not as prominent as that found in this paper. From Fig. 1, 2 and 3, one can see that the properly defined 1612 MHz maser pump rates vary across 5 orders of magnitude from stellar OH masers (type II OH/IR sources) to interstellar OH masers (type I OH/IR sources). As discussed in previous section, one of the possible explanations for the very low maser pump rates of interstellar OH masers is the so-called competitive gain between mainline and 1612 MHz OH masers. Here I would like to supply more observational proofs upon this point by comparing the peak strengths of the two competing kinds of masers.
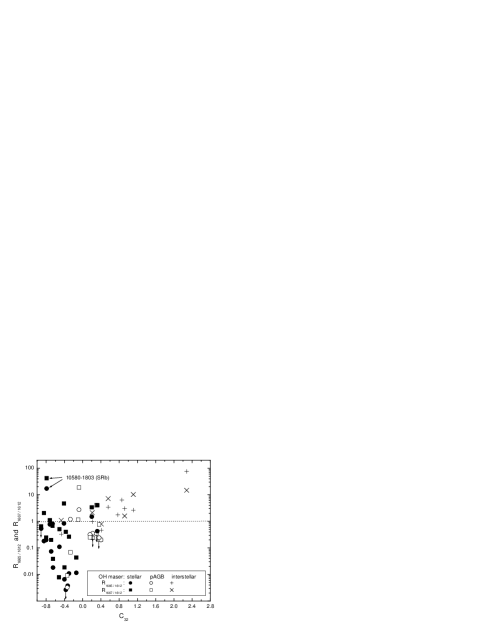
The interstellar OH masers are usually found to show stronger mainline OH masers than 1612 MHz maser. The 1665 and 1667 MHz mainline maser transitions share upper and lower energy levels with 1612 MHz transition respectively. Therefore, in the case that mainline OH masers are as strong as or even stronger than the 1612 MHz maser, the latter should has been significantly weakened by the former through competitive gain (Field [1985]), which eventually results in very small 1612 MHz pump rate. In order to verify that the interstellar OH masers in sample 1, 2 and 3 are really strong mainline masers, the peak intensities of strongest peak of mainline masers and low velocity peak of 1612 MHz masers are collected for most sample sources from literature (see in Table 4 in which the literature for the 1612 MHz peak flux data are the same as those from which the integrated maser fluxes are extracted). The mainline to 1612 MHz peak flux ratios are visualized in Fig. 4 in which the sources in different evolutionary status are differentiated by different symbols. As one can see, most stellar OH masers (filled circles and squares) have 1612 MHz maser stronger than mainline masers while it is reversed for interstellar masers (pluses and crosses). This confirms that the interstellar OH masers in the sample are really strong mainline emitters. Therefore, the competitive gain between mainline and 1612 MHz masers should be a rather reasonable explanation for the very small 1612 MHz pump rates of interstellar OH masers, although it is still not clear how the pumping process of the mainline masers affects the 34.6 and 53.3 m absorption lines. A special sources IRAS 10580-1803 should be noted. Although it is classified as stellar OH maser, it show much stronger mainline OH maser in Fig. 4. It is a SRb variable. The circumstellar envelope of SRb is believed to be even optically thinner than that of Mira variables, and hence it usually emits stronger mainline masers.
The last point to note is the role of filling emission that is found in 53.3 m absorption line profiles of both stellar and interstellar OH masers (He & Chen [2004b]). The 1612 MHz maser pump rates calculated in the paper have taken account the contribution of the filling emission feature. For two stellar masers, IRAS 03507+1115 and IRAS 07209-2540, the filling emission is so strong that the 53.3 m line becomes net emission. For the latter source, the very strong absorption at 34.6 m balanced the emission at 53.3 m and a 1612 MHz maser pump rate typical of stellar OH maser is found (0.079). However, for the former source, the estimated upper limit of the pump rate becomes negative due to the non-detection of the 34.6 m absorption (the noise of the 34.6 m continuum spectral flux is low). It seems that some unknown processes are at work not only in the pumping of the observed 1612 MHz maser but also in producing the strong filling emission in 53.3 m OH line. It is worthy of further maser pumping modeling work.
| Name | Ref | Name | Ref | ||||||
|---|---|---|---|---|---|---|---|---|---|
| Jy | Jy | Jy | Jy | Jy | Jy | ||||
| Sample 1 | 154525459 | 13.99 | |||||||
| 072092540 | 200 | 162 | 134 | BM82(fig) | 162804008 | 0.29 | 0.07 | 0.06 | LC96 |
| 174242859 | 0.36 | 1.23 | 2.57 | LC96 | 171033702 | 0.55 | 0.11 | 0.11 | PPT |
| 174412822 | 1.7 | 128 | 25 | CH83*1 | 171503224 | 1.35 | 3.7 | 25.2 | HTS |
| 192441115 | 45.6 | 5 | 23 | NB92(fig) | 174113154 | 134.9 | 1.47 | 35.54 | ELG04 |
| Arp 220 | 0.032 | 0.084 | 0.33 | BH87 | 174633700 | int*3 | Non | LDL | |
| NML Cyg | 638 | 2.4 | ED04 | 180502213 | 1.82 | 1.4 | 2 | CC86 | |
| Sample 2 | 181961331 | 0.6 | 1.8 | 0.95 | LC96 | ||||
| 035071115 | 2.29 | 0.41 | 4.69 | L97 | 182720114 | 0.068 | 0.022 | 0.074 | AOe |
| 063190415 | 0.082 | 0.038 | 0.065 | L97 | 184980017 | 0.38 | 0.16 | 1.52 | DT91 |
| 163423814 | 9 | 2.86 | 2.22 | LC96 | 185600638 | 70 | 0.55 | SHH | |
| 174242852 | 0.69 | 185960315 | 0.37 | 0.54 | 1.23 | L97 | |||
| 174302848 | 0.96 | 190390809 | 7.82 | 6.5 | 36.69 | EL00 | |||
| 174312846 | 0.66 | 191140002 | 43.8 | 50 | SG04 | ||||
| 175742403 | 34.7 | 60.85 | FC99*2 | 192190947 | 5 | 0.016 | 0.046 | AOe | |
| 183480526 | 400 | 4.6 | 17.38 | ELG04 | 192552123 | 1.7 | 0.6 | 0.4 | ESWW |
| 202553712 | 0.19 | -1.15 | -1.66 | AOe | 193432926 | 0.29 | 0.1 | 1.18 | STZW |
| Sample 3 | 200004954 | 2.37 | 0.47 | 0.58 | OWMS(fig) | ||||
| 010371219 | 60.4 | 1.09 | 2.35 | L97 | 200770625 | 35.3 | 2.6 | 7 | OWMS(fig) |
| 013046211 | 32.1 | 0.085 | 12.9 | L89 | 220365306 | 0.83 | 0.2 | 0.63 | LC96 |
| 055062414 | 0.18 | 0.17 | 0.38 | L97 | 221766303 | 0.34 | 2.16 | Non | BLS90 |
| 070277934 | 8.62 | 221775936 | 41.3 | 0.27 | 0.76 | ELG04 | |||
| 101975750 | 42.2 | 50.1 | 2.88 | DGK | 234121533 | 0.06 | 0.032 | 0.039 | NHWA |
| 105801803 | 0.18 | 3.12 | 7.62 | ELG03 | |||||
-
Note:
Blank means no data available. ‘Non’ means non-detection and no upper limit is provided by literature. Upper limits are noise for non-detections.
-
*1:
The mainline OH maser OH 0.66-0.04 is identified for IRAS 17441-2822
-
*2:
Totally 53 OH 1665 MHz maser spots are found in the H II region IRAS 17574-2403 by Forster and Caswell ([1999]). The beam size of the 1612 MHz maser observation by Baud et al. ([1979a]) is much larger than that of the mainline maser observations. The 1612 MHz maser should correspond to the whole 53 mainline maser spots. Therefore the sum of the 53 mainline maser peak fluxes is presented in the table.
-
*3:
Only integrated mainline maser flux is available and no maser profile figure was published.
-
(fig):
The flux is derived by measuring directly from the maser line profile figure in literature.
-
Reference codes:
(The literature are for mainline data. The 1612 MHz data are for low velocity peak and come from the same literature from which the integrated fluxes are extracted.) BH87: Baan et al. ([1987]); BLS90: Braz et al. ([1990]); BM82: Benson et al. ([1982]); CC86: Chapman et al. ([1986]); CH83: Caswell et al. ([1983]); DGK: Dyer et al. ([2001]); DT91: Dickinson et al. ([1991]); ED04: Etoka & Diamond ([2004]); EL00: Etoka et al. ([2000]); ELG04: Etoka et al. ([2004]); ELG03: Etoka et al. ([2003]); EN79: Engels D. ([1979]); ESWW: Engels et al. ([1985]); FC99: Forster et al. ([1999]); HTS: Hu et al. ([1994]); L89: Likkel ([1989]); L97: Lewis ([1997]); LC96: te Lintel Hekkert et al. ([1996]); LDL: Lewis et al. ([1995]); NB92: Nedoluha et al. ([1992]); NHWA: Norris et al. ([1984]); OWMS: Olnon et al. ([1980]); PPT: Payne et al. ([1988]); SG04: Szymczak et al. ([2004]); SHH: Slootmaker et al. ([1985]); STZW: Silverglate et al. ([1979]);
6 Summary
The paper estimated (pseudo) OH 1612 MHz maser pumprates or pumprate ranges for all OH/IR sources with at least one of the two OH 1612 MHz maser IR pumping lines detected by ISO and all sources with ISO spectral observations at both pumping-line wavelengths (non-detections of both pumping lines). The correlation between (pseudo) maser pumprate or pumprate distribution and maser source types reveals three facts: (1) OH 1612 MHz masers in late type stars show nearly fixed radiative pumprate, which agrees to the general thought that they are mainly radiatively pumped and hence the IR pumping-line flux should be proportional to the maser flux; (2) OH 1612 MHz masers occurring in interstellar material show very small and largely varying (pseudo) radiative pumprates, which should be explained by four alternative scenarios or their combinations: absorption by quiet OH cloudlets, different OH maser pump mechanism, competitive gain between mainline and 1612 MHz masers, anisotropy of the maser emission; (3) it is very likely that post-AGB stars, OH-PPNe and OH-PNe have their OH maser pumprates between that of typical stellar and interstellar OH masers.
Appendix:
Line width of a doublet in low resolution spectrum
Generally, the width of a line feature depends on many factors, such as natural width of energy levels, gas temperature, turbulence distribution, global expansion or contraction velocity distribution, instrumental resolution and all kinds of noise. But in this paper, the very low spectral resolution and the doublet nature of the line features allow one to only consider the instrumental resolution and separation of the doublet components when estimating the line width.
The 34.6 and 53.3 m OH absorption lines are both quadruple lines. But the four sub-lines of each feature can usually be divided into two groups, with two sub-lines in each group. The two sub-lines in each group is much closer to each other than to the lines in the other group. For 34.6 m line, the distance between the two sub-lines in each group is not larger than 0.0001 m, while the distance between the two groups is about 0.026 m. Further more, the widths of the four sub-lines are mainly controlled by the expansion velocity of the circumstellar shell from which it arises, i.e., typically equal to about 20 km/s (equivalent to 0.0023 m at 34.6 m). Therefore, the 34.6 m quadruple can be considered as a doublet with two narrow components. For 53.3 m, the situation is similar. The four sub-lines can be divided into two groups with the separation of the two sub-lines within each group (not larger than 0.0004 m) much smaller than the distance between the two groups (about 0.09 m). Therefore it can also be considered as a doublet with narrow components.
The resolution of the ISO SWS/LWS is low. The SWS resolving power varies from 400 to 2250 (Although Fabry-Prot (FP) spectra can attain a resolution of 30000, none of the spectra that need to estimate their line width in the paper were obtained by FP), which is equivalent to resolution varying from 0.112 to 0.041 m. The LWS resolution varies from 0.035 to 0.28 m. Comparing the resolution with the widths of each component of the 34.6 and 53.3 m doublets (0.0023 m, as stated above), it is seen that the components can be approximated as infinitely narrow lines when convolving with the ISO instrumental profiles (assumed as gaussian profile with the FWHM equals to spectral resolution). Thus, convolving the gaussian instrumental profile with the doublet, one can get a double-gaussian profile in which the two gaussian components peak at the wavelengths of the two doublet components and the FWHMs of both gaussian components equal to the spectral resolution. Assuming the strengths of the two doublet components are equal, the FWHM of the double-gaussian line profile can be approximately (not accurately!) expressed as:
for 34.6 m line; and
for 53.3 m line, where R is the spectral resolution expressed in unit m and 0.026 m and 0.09 m are the separation between the two components of the 34.6 and 53.3m doublets respectively.
References
- [1974] Andersson C., Johansson L.E.B., Goss W.M., Winnberg A., Ngugen-Quang-Rieu, 1974, A&A 30, 475 (AJG74)
- [1987] Baan W.A., Haschick A.D., 1987, ApJ 318, 139 (BH87)
- [1979a] Baud B., Habing H.J., Matthews H.E., Winnberg A., 1979a, A&AS 35, 179 (BAU79)
- [1979b] Baud B., Habing H.J., Matthews H.E., Winnberg A., 1979b, A&AS 36, 193 (BHMW)
- [1982] Benson J.M., Mutel R.L., 1982, ApJ 253, 199 (BM82)
- [1978] Bowers P.F., 1978, A&AS 31, 127 (B78)
- [1990] Braz M.A., Lpin J.R.D., Sivagnanam P., Le Squeren A.M., 1990, A&A 236, 479 (BLS90)
- [1986] Campbell B., Persson S.E., McGregor P.J., 1986, ApJ 305, 336
- [1985] Castelaz M.W., Grasdalen G.L., Hackwell J.A., Capps R.W., Thompson D., 1985, AJ 90, 1113
- [1999] Caswell J.L., 1999, MNRAS 308, 683
- [1983] Caswell J.L., Haynes R.F., 1983, AuJPh 36, 361 (CH83)
- [1997] Cernicharo J., Alcolea J., Baudry A., Gonzlez-Alfonso E., 1997, A&A 319, 607
- [1986] Chapman J.M., Cohen R.J., 1986, MNRAS 220, 513 (CC86)
- [2001] Chen P.S., Szczerba R., Kwok S., Volk K., 2001, A&A 368, 1006
- [1993] Chengalur J.N., Lewis B.M., Eder J., et al., 1993, ApJS 89, 189 (AOa)
- [1977] Cochran W.D., Ostriker J.P., 1977, ApJ 211, 392
- [1998] Colin A., 1998, A&A 335, 1040
- [1993] David P., Le Squeren A.M., Sivagnanam P., 1993, A&A 277, 453
- [1987] Dickinson D.F., 1987, ApJ 313, 408
- [1991] Dickinson D.F., Turner B.E., 1991, ApJS 75, 1323 (DT91)
- [2001] Dyer K.K., Goss W.M., Kemball A.J., 2001, AJ 121, 2743 (DGK)
- [1988] Eder J., Lewis B.M., Terzian Y., 1988, ApJS 66, 183 (AOb)
- [1992] Elitzur M., 1992, Astronomical Masers (book), Kluwer
- [1976] Elitzur M., Goldreich P., Scoville N., 1976, ApJ 205, 384
- [1979] Engels D., 1979, A&AS 36, 337 (EN79)
- [1985] Engels D., Schmid-Burgk J., Walmsley C.M., Winnberg A., 1985, A&A 148, 344 (ESWW)
- [2004] Etoka S., Diamond P., 2004, MNRAS 348, 34 (ED04)
- [2000] Etoka S., Le Squeren A.M., 2000, A&AS 146, 179 (EL00)
- [2003] Etoka S., Le Squeren A.M., Gerard E., 2003, A&A 403, L51 (ELG03)
- [2004] Etoka S., Le Squeren A.M., Gerard E., 2003, A&A 420, 217 (ELG04)
- [1985] Field D., 1985, MNRAS 217, 1
- [1999] Forster J.R., Caswell J.L., 1999, A&AS 137, 43 (FC99)
- [2002] Garcia-Hernandez D.A., Manchado A., Garcia-Lario P., et al., 2002, A&A 387, 955
- [1989] Gaylard M.J., West M.E., Whitelock P.A., Cohen R.J., 1989, MNRAS 236, 247 (GWW89)
- [1998] Gonzlez-Alfonso E., Cernicharo J., Alcolea J., Orlandi M.A., 1998, A&A 334, 1016
- [1995] Greenhill L.J., Colomer F., Moran J.M., et al., 1995, ApJ 449, 365
- [1994] Groenewegen M.A.T., 1994, A&A 290, 544
- [1997] Hashimoto O., Izumiura H., 1997, Ap&SS 251, 207
- [2004b] He J.H., Chen P.S., 2004, NewA 9, 545 (paper II)
- [2004a] He J.H., Szczerba R., Chen P.S., Sobolev A.M., Stasinska G., 2004, (accepted by A&A, paper I)
- [1994] Hu J.Y., Te Lintel Hekkert P., Slijkhuis F., et al., 1994, A&AS 103, 301 (HTS)
- [2002] Hutawarakorn B., Cohen R.J., Brebner G.C., 2002, MNRAS 330, 349
- [1994] Ivison R.J., Seaquist E.R., Hall P.J., 1994, MNRAS 269, 218 (ISH94)
- [1997] Jiang B.W., Deguchi S., Hu J.Y., Yamashita T., Nishihara E., Matsumoto S., Nakada Y., 1997, AJ 113, 1315
- [1982] Lada C.J., Gautier T.N. III, 1982, ApJ 261, 161
- [1984] Le Bertre T., Epchtein N., Gispert R., Nguyen-Q-Rieu, Truong-Bach, 1984, A&A 132, 75
- [1984] Lenzen R., Hodapp K.-W., Reddmann T., 1984, A&A 137, L365
- [1994] Lewis B.M., 1994, ApJS 93, 549 (AOe)
- [1997] Lewis B.M., 1997, ApJS 109, 489 (L97)
- [1995] Lewis B.M., David P., Le Squeren A.M., 1995, A&AS 111, 237 (LDL)
- [1990] Lewis B.M., Eder J., Terzian Y., 1990, ApJ 362, 634 (AOc)
- [1988] Likkel L., Morris M., 1988, ApJ 329, 914
- [1989] Likkel L., 1989, ApJ 344, 350 (L89)
- [1992] Lindqvist M., Winnberg A., Habing H.J., et al., 1992, A&AS 92, 43 (LWH92)
- [2004] Liu H.P., Sun J., Thissen T., 2004, Ap&SS 289, 147
- [1982] Lockwood G.W., Wing R.F., 1982, MNRAS 198, 385
- [1974] Masheder M.R.W., Booth R.S., Davies R.D., 1974, MNRAS 166, 561 (MBD74)
- [1992] Nedoluha G.E., Bowers P.F., 1992, ApJ 392, 249 (NB92)
- [1984] Norris R.P., Haynes R.F., Wright A.E., Allen D.A., 1984, PASAu 5, 562 (NHWA)
- [1993] Nyman L.-A., Hall P.J., Le Bertre T., 1993, A&A 280, 551
- [1980] Olnon F.M., Winnberg A., Matthews H.E., Schultz G.V., 1980, A&AS 42, 119 (OWMS)
- [1993] Palagi F., Cesaroni R., Comoretto G., Felli M., Natale V., 1993, A&AS 101, 153
- [1999] Pashchenko M.I., Rudnitskii G.M., 1999, Astronomy Reports, 43, 311
- [1996a] Pavlakis K.G., Kylafis N.D., 1996a, ApJ 467, 300
- [1996b] Pavlakis K.G., Kylafis N.D., 1996b, ApJ 467, 309
- [1988] Payne H.E., Phillips J.A., Terzian Yervant, 1988, ApJ 326, 368 (PPT)
- [1997] Phelps R.L., Lada E.A., 1997, ApJ 477, 176
- [1962] Roberts M.S., 1962, AJ 67, 79
- [1999] Sahai R., Zijlstra A., Bujarrabal V., Te Lintel Hekkert P., 1999, AJ 117, 1408
- [2003] Sahai R., Zijlstra A., Snchez Contreras C., Morris M., 2003, ApJ 586, L81
- [1995] Seaquist E.R., Ivison R.J., Hall P.J., 1995, MNRAS 276, 867 (SIH95)
- [1997] Sevenster M.N., Chapman J.M., Habing H.J., et al., 1997, A&AS 122, 79 (ATCAb)
- [1996] Shepherd D.S., Churchwell E., 1996, ApJ 472, 225
- [1993] Silva A.M., Azcrate I.N., Pppel W.G.L., Likkel L., 1993, A&A 275, 510 (SAP93)
- [1979] Silverglate P., Terzian Y., Zuckerman B., Wolff M., 1979, AJ 84, 345 (STZW)
- [1988] Sivagnanam P., Le Squeren A.M., Foy F., 1988, A&A 206, 285 (SSF88)
- [1998] Sjouwerman L.O., van Langevelde H.J., Winnberg A., Habing H.J., 1998, A&AS 128, 35 (SLW98)
- [1985] Slootmaker A., Habing H.J., Herman J., 1985, A&AS 59, 465 (SHH)
- [1987] Sun J., Kwok S., 1987, A&A 185, 258
- [1999] Sylvester R.J., Kemper F., Barlow M.J., et al., 1999, A&A 352, 587
- [2004] Szymczak M., Grard E., 2004, A&A 414, 235
- [2004] Szymczak M., Grard E., 2004, A&A 423, 209 (SG04)
- [1991] te Lintel Hekkert P., Caswell J.L., Habing H.J., et al., 1991, A&AS 90, 327 (tL-H)
- [1996] te Lintel Hekkert P., Chapman J.M., 1996, A&AS 119, 459 (LC96)
- [1999] Thissen T., Spiecker H., Andresen P., 1999, A&AS 137, 323
- [1990] van Langevelde H.J., van der Heiden R., van schooleveld C., 1990, A&A 239, 193
- [1980] Werner, M. W., Beckwith, S., Gatley, I., et al., 1980, ApJ 239, 540
- [1972] Wilson W.J., Barrett A.H., 1972, A&A 17, 385
- [1992] Yu Z.-Y., 1992, Ap&SS 192, 53
- [1989] Zijlstra A.A., te Lintel Hekkert P., Pottasch S.R., et al., 1989, A&A 217, 157 (ZLP89)
- [2001] Zijlstra A.A., Chapman J.M., te Lintel Hekkert P., et al., 2001, MNRAS 322, 280