Radio astronomical probes of cosmic reionization and the first luminous sources: probing the ’twilight zone’
Abstract
The epoch of reionization (EoR) corresponds to a ’cosmic phase transition’, when the neutral intergalactic medium (IGM) becomes ionized by the first stars and/or AGN. While the discoveries of Gunn-Peterson (GP) absorption troughs in the spectra of the highest redshift QSOs, and large scale polarization of the CMB, have set the first hard constraints on the EoR, the redshift and process of reionization, and the nature of the first luminous objects, remain two of the paramount questions in cosmic structure formation. Moreover, the GP effect is such that observations of objects during this epoch will be difficult at wavelengths shorter than about 1 micron. Hence, cosmic reionization, and the formation of the first luminous objects, occurs in a ’twilight zone’, observable only at radio through near-IR wavelengths. In this talk I explore studies of the EoR at meter through submillimeter wavelengths. I present recent observations of the dust, molecular gas, and star formation activity in the host galaxies of the highest redshift QSOs. These results have interesting implications on the timescale for metal and dust enrichment, on the possibility of co-eval formation of SMBHs and galaxies, and on the process of reionization. I then discuss future capabilities of low frequency radio astronomy to study the neutral IGM via the HI 21cm line, including imaging and power spectral analyses of large scale structure in emission, and absorption studies toward the first radio loud sources. I conclude with a summary of the VLA-VHF system to study cosmic Stromgren spheres associated with the highest redshift SDSS QSOs in the HI 21cm line at 190 MHz.
NRAO PO Box O Socorro NM USA
1. Introduction
Cosmic reionization corresponds to the epoch when the neutral intergalactic medium (IGM) is reionized by the first luminous sources (stars or accreting black holes), after having coasted in a neutral state from the time of recombination. The existence of a neutral IGM prior to the formation of the first luminous objects is perhaps the last major phase of cosmic evolution that remains to be verified. Also, discovery of the epoch of reionization (EoR) provides a fundamental benchmark in cosmic structure formation, indicating the formation of the first luminous objects (Loeb & Barkana 2000).
The last few years have seen the first direct observational constraints on cosmic reionization. First, discovery of Gunn-Peterson absorption troughs in the spectra of the highest redshift QSOs, corresponding to Ly- absorption by the neutral IGM, suggest an increase in the cosmic neutral fraction from f(HI) at , to f(HI) at (Fan et al. 2003; White et al. 2003). Relatively late reionization is supported by study of the thermal state of the IGM at through QSO absorption lines (Hui & Haiman 2003). On the other hand, the large scale polarization signal of the CMB detected by WMAP, resulting from Thomson scattering during the EoR, suggests a significant ionization fraction for the IGM (f(HI)) out to high redshift (; Kogut et al. 2003). It has also been argued that the discovery of Ly emitting galaxies at implies a significantly ionized IGM (Stern et al. 2005; Malhotra & Rhoades 2004), although source clustering may alleviate this requirement (Furlanetto et al. 2004; Haiman 2002).
Overall, these first observational constraints on the EoR suggest that reionization may be a complex process extending from down to . As an example of models being considered, perhaps the simplest is the ’double reionization’ model of Cen (2002), in which the universe is reionized at by massive pop III stars associated with the first non-linear objects exceeding the cosmic Jean’s mass (mini-halos M⊙). This process is self-limiting, since the Pop III stars will both disrupt the host galaxies when they go supernovae (Abel et al. 2002), as well as warm the IGM, thereby increase the Jean’s mass. Once the sources are turned off, the IGM density at is high enough that the universe has time to recombine (although cf. Furlanetto & Loeb 2004). A second reionization occurs at to 7 due to normal star formation in galaxies with masses M⊙.
These first observational constraints on the EoR represent major advances on our understanding of cosmic structure formation. However, each has its limitations. Considering the GP effect, spectra in the 0.8 to 1 m range are severely contaminated by night sky OH lines, and the conclusions depend on an extrapolation of QSO UV spectra below Ly. Most importantly, the universe becomes opaque at fairly low neutral fractions (f(HI) ), and hence the technique loses diagnostic capability. Indeed, Songaila (2004) has recently challenge the turn-up in the opacity at , suggesting a more gradual rise. The WMAP large scale polarization measurement is effectively an integrated measure of the universal Thomson optical depth, and hence can be fit by myriad physical models for reionization (Gnedin 2005). Also, there are significant uncertainties involved in subtracting the (possibly) polarized foregrounds (eg. the Galaxy) on the large scale being considered (10’s of degrees).
The coming years should see considerable effort in improving the observational constraints on the EoR, and in reconciling these measurements with physical models for cosmic structure formation. In this talk I summarize radio astronomical constraints on cosmic reionization, excluding the CMB (see also Carilli et al. 2004a). These constraints include: (i) observations at cm through (sub)mm wavelengths of emission from the dust, gas, and star formation, in the highest redshift objects, and (ii) study of the neutral IGM through observations of the HI 21cm line with future large area low frequency radio telescopes.
2. Radio studies of objects within the ’twilight zone’
The onset of the GP effect at implies that the universe becomes opaque at (observed) optical wavelengths. Hence, cosmic reionization, and the formation of the first luminous objects, occurs in a ’twilight zone’, observable only at radio through near-IR wavelengths (m), and in the hard Xrays.
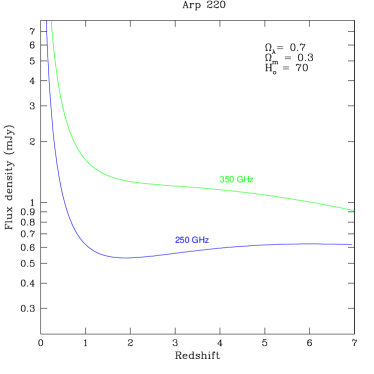
What is the ’magic’ of (sub)mm observations of the high redshift universe? Figure 1a shows the radio through far-IR (FIR) spectrum of the starburst galaxy Arp 220. The cm emission corresponds to non-thermal (synchrotron) emission from relativistic electrons accelerated in SNR shocks, while the mm-FIR emission corresponds to thermal emission from warm dust heated by the interstellar radiation field. The fact that both emission mechanisms (non-thermal and thermal) are driven by (massive) star formation leads to the well known linear correlation between the radio and FIR luminosities of star forming galaxies (Yun et al. 2001). The (sub)mm spectral range also includes myriad spectral lines from rotational transitions of common interstellar molecules, as well as low excitation electronic fine structure lines from common elements.
Figure 1b shows the flux density of Arp 220 as a function of redshift at observing frequencies of 250 and 350 GHz. The large ’inverse-K’ correction due to the rapid rise on the Rayleigh-Jeans side of the gray body spectrum leads to a roughly constant flux density from to 8 for a star forming galaxy. Hence, (sub)mm observations provide a uniquely distance independent method for studying objects throughout the universe.

2.1. High redshift QSOs
QSO host galaxies have long been targets for studies of high dust and molecular line emission, because of the fact that optical redshifts are easily measured, as compared to submm galaxy samples, for which obtaining optical redshifts has been notoriously difficult (Blain et al. 2002).
The past decade has seen a revolution in our understanding of high redshift QSOs in three ways. First, surveys such as the SDSS and DPOSS have revealed large samples of QSOs to the highest redshifts, with close to 1000 beyond , and 8 beyond (Fan et al. 2003; Djorgovski et al. 2001). Due to sensitivity limits, these QSOs are all extreme luminosity sources, with M, and bolometric luminosities (dominated by the ’big blue bump’) L⊙. Eddington limited accretion implies black hole masses M⊙.
Second, study of QSO host galaxies at lower redshifts has revealed a correlation between the mass of the black hole and the velocity dispersion of the host spheroidal galaxy (Ferrarese & Merritt 2000; Gebhardt et al. 2000). This relation implies that most (all?) spheroidal galaxies contain supermassive black holes, and that the hole mass correlates with the mass of the host galaxy: , leading Gebhard et al. (2000) to hypothesize a ’causal relationship’ between the formation of supermassive black holes and spheroidal galaxies. This correlation also implies that the highest redshift QSOs are associated with massive host galaxies ( M⊙), if the relationship holds to .
And third is the discovery that roughly 1/3 of optically selected QSOs are detected at (sub)mm wavelengths in surveys with mJy sensitivity (Beelen 2005; Omont et al. 2003; Carilli et al. 2004c), and that this fraction remains constant out to the highest redshifts (Bertoldi et al. 2004). Beelen shows that the FIR luminosity correlates weakly with the bolometric luminosity of the QSO. Studies of the radio-through-FIR SEDs of these sources show that most follow the radio-FIR correlation established by low redshift star forming galaxies (Petric et al. 2004; Carilli et al. 2004b), while VLBI observations of the radio continuum emission show brightness temperatures K, again consistent with starburst galaxies (Momjian et al 2004; Beelen et al. 2004). On the other hand, the FIR luminosity is typically only 10 of the bolometric luminosity, such that dust heating by the AGN cannot be precluded (Andreani et al. 2003).
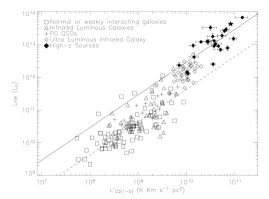

Figure 2a shows the relationship between FIR luminosity and CO luminosity for a large sample of low galaxies, and for the high redshift sample, comprised mostly of QSO host galaxies. It is well known that low galaxies follow a tight, but non-linear, correlation between LFIR and L, consistent with a powerlaw of index = 1.7 (Gao & Solomon 2004). The FIR luminosity can be interpreted as a measure of star formation rate: , with LFIR in L⊙. The CO luminosity has been used as a empirical diagnostic of molecular (H2) gas mass: , with X in M⊙ (K km s-1 pc2)-1. For Galactic GMCs the empirical value of X = 4.6 (Dame et al. 1987), while for starburst galaxies X = 0.8 (Downes & Solomon 1998). The non-linear relationship between LFIR and L has been interpreted as an increasing ’star formation efficiency’ (= SFR/gas mass) with increasing gas mass (Gao & Solomon 2004). The fact that the high redshift sources follow the same (non-linear) relationship between LFIR and L suggests a similar dust heating mechanism in each, and in the low galaxies the dust heating mechanism is known to be star formation.
The CO molecule has a low dipole moment, and hence a fairly low critical density for excitation ( cm-3). Hence CO emission traces both diffuse and dense molecule clouds. The next strongest molecular emission line from starburst galaxies is that from HCN. Figure 2b shows the relationship between LFIR and L (Gao & Solomon 2004). HCN is a high dipole moment molecule, with a critical density for excitation cm-3. Hence HCN traces only dense gas associated with actively star forming molecular clouds. Again, a correlation is seen for low star forming galaxies, but in this case the relationship is linear (power law index = 1), consistent with the idea that HCN traces only the densest gas directly associated with star forming clouds (Gao & Solomon 2004). The different powerlaw indices for the correlations of CO and HCN with FIR luminosity also imply that the HCN/CO luminosity ratio increases with FIR luminosity, from a few at FIR L⊙ up to 10 to 20 for L⊙.
Figure 2b shows that the high QSO host galaxies roughly follow this linear trend between HCN and FIR luminosity, consistent with star forming clouds (Carilli et al. 2005). However, we should point out that many of the measurements for the QSO hosts are upper limits in HCN, and that in all cases the points (or limits) fall on the low-side of the curve with respect to L. This could be used to argue for a contribution to dust heating by the AGN.
Searches have also been made for low order atomic fine structure lines from QSO host galaxies, known to be the dominant cooling lines in the ISM. Thus far the results have been disappointing, with limits to the line luminosities of eg. the [CII] 158 m line falling well below the expected value extrapolated from the FIR luminosity (van der Werf 1991). However, a similar under-luminosity for these atomic submm lines has been seen in low ultra-luminous IR galaxies (Dale et al. 2004). This under-luminosity has been interpreted as resulting from a decreased efficient for photoelectric heating by charged dust grains in starburst environments.
Recently Pety et al. (2005) have detected the [CI] 609m line at from the gravitationally lensed FIR-luminous QSO PSS 2322+1944. They conclude that the ISM of the QSO host galaxy must have roughly solar metalicity.
Overall, cm and mm observations of high QSO host galaxies in the dust continuum emission, molecular lines, fine structure lines, and non-thermal radio continuum, are consistent with starbursts in the host galaxies concurrent with the AGN activity. If the dust heating is by star formation, the star formation rates are of order M⊙ year-1, such that a large spheroidal galaxy could form over a dynamical timescale of 108 years.
2.2. J1148+5251: the highest redshift QSO
The highest redshift QSO known is SDSS J1148+5251 at (Fan et al. 2003). The bolometric luminosity of this source is L⊙, with a supermassive black hole of a few M⊙ (Willott et al. 2004). J1148+5251 is also one of the 30 of the high QSOs that is also FIR luminous, being detected at 250 GHz with MAMBO with an implied FIR luminosity L⊙, and a dust mass of M⊙ (Bertoldi et al. 2003).

CO emission has been detected from the host galaxy of J1148+5251 with both the VLA (3-2 line) and PdBI (6-5, 7-6 lines; Walter et al. 2003; Bertoldi et al. 2003; Fig. 3a). The implied molecular gas mass is M⊙. The gas-to-dust ratio is , similar to that seen in active star forming galaxies The CO excitation follows roughly constant brightness temperature up to 6-5, indicating dense cm-3, warm ( K) gas, again similar to that seen in starburst galaxy nuclei. The line profile is roughly Gaussian, with a FWHM = 305 km s-1 (Bertoldi et al. 2003).
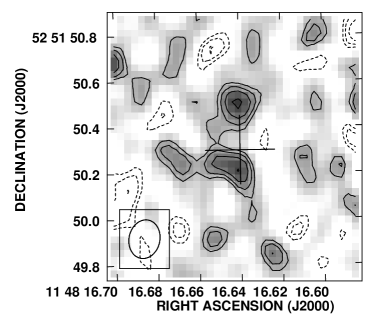
High resolution imaging of the CO emission with the VLA reveal molecular gas extended over about 1′′, or 5.5 kpc, with about half the emission coming from two compact components separated by (=1.7 kpc; Walter et al. 2004; Fig. 3b). Walter et al. consider the possibility of a double nucleus, as could occur in a recent galaxy merger. They also calculate the dynamical mass from the observed line width and spatial distribution, and find a dynamical mass within 2.5 kpc radius of M⊙. The intrinsic CO brightness temperature is K for each component, which is typical for CO emission from starburst nuclei (Downes & Solomon 1998).
The dynamical mass and gas mass of J1148+5251 are comparable, suggesting that the gravitational mass in the inner few kpc of the host galaxy is baryon dominate, as is also seen for nearby elliptical galaxies, although in the case of 1148+5251 the mass is in gas, while in low galaxies the mass is in stars. From the relation, Walter et al. derive a bulge mass of for J1148+5251. This value is much larger than the dynamical mass, leading Walter et al. to suggest that the relation breaks down at the highest redshifts. The indication is that the SBMH forms prior to the host spheroidal galaxy (Wyithe & Padmanaban 2005).
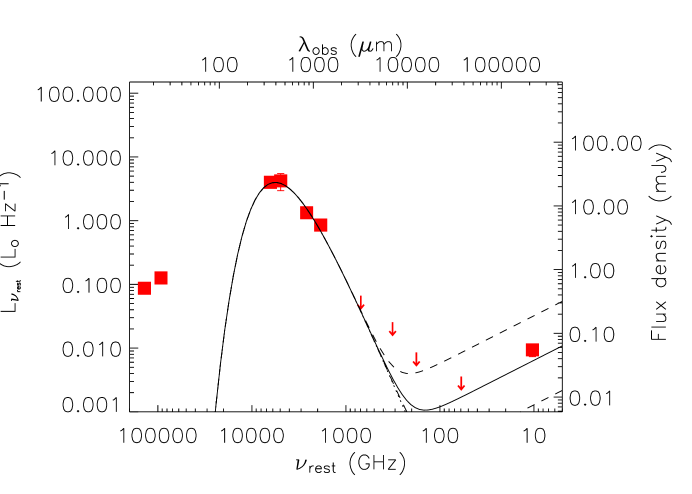
J1148+5251 has also been detected at 1.4 GHz with the VLA, corresponding to non-thermal (synchrotron) emission. The radio-through-IR spectrum is shown in Fig. 4. The spectrum is consistent with that expected for an active star forming galaxy, ie. the host galaxy emission follows the radio-FIR correlation for star forming galaxies. Overall, the physical conditions measured for J1148+5251, from the dust, molecular gas, and non-thermal continuum emission, are consistent with a massive starburst in the host galaxy, coeval with the AGN activity, with an implied star formation rate M⊙ year-1, perhaps in a merging galaxy system.
The age of the universe at is only years. This short timescale precludes the standard ISM dust formation mechanism via winds from evolved lower mass stars (ie. AGB stars), which requires years. A number of authors have considered the possibility of dust formation within supernovae or supernovae remnants, which could operate on a much shorter timescale (Dunne et al. 2003; Maiolino et al. 2004).
3. Cosmic Stromgren spheres and the state of the IGM at
The CO observations of J1148+5251 provide a very accurate redshift for the host galaxy: . For comparison, redshifts based on high ionization broad lines provide very inaccurate host galaxy redshifts, with offsets up to 2000 km s-1 (Richards et al. 2002). Low ionization broad lines, such as MgII, are thought to provide more accurate host galaxy redshifts (within a few hundred km s-1), although clearly not as accurate as the CO line.
Why is an accurate host galaxy redshift important? White et al. (2003) point out that, if the IGM was neutral (or even 0.1 neutral) right up to the host galaxy redshift, then there should be no emission seen blue-ward of Ly. And yet, sensitive spectra of QSOs show emission extending below the nominal host galaxy redshift before the Gunn-Peterson absorption trough sets-in. This phenomenon can be seen clearly in J1148+5251, where the host galaxy redshift is 6.419, but the G-P absorption trough only starts at (Walter et al. 2003).
This emission extending below the rest Ly line implies that the QSO must be surrounded by a region of ionized gas, presumably generated by the ionizing radiation from the QSO itself, which allows photons to ’leak out’ to lower redshifts, before encountering the neutral IGM. For lower redshift QSOs this is known as the ’proximity effect’, indicating a deficit of Ly absorption line systems close to the QSO. In a qualitative sense, we are witnessing the process of reionization, as the QSO ionizes the IGM in its vicinity. More quantitatively, the difference in redshift can be used to derive the size of the cosmic Stromgren sphere generated by the QSO in the IGM. For J1148+5251 we find a physical radius of R = 4.7 Mpc.
This is a time bounded Stromgren sphere (or ionization front), from which one can derive the timescale for the AGN activity from the size of the sphere, the average IGM baryon density and neutral fraction (f(HI)), and the QSO ionizing flux (Cen & Haiman 2000). For J1148+5251, Walter et al. (2003) find: years.111The ionization front expands close to the speed of light. However, White et al. (2003) show that, with a simple change of variables, the relativistic corrections are implicit in the simple calculation, and the value for derived from the measured R is the correct proper time required to generate a sphere of that size. A value of years is considered canonical for AGN activity in luminous QSOs, based on QSO demographics (Yu & Tremaine 2002).
Wyithe & Loeb (2003) have inverted the calculation above to constrain the IGM neutral fraction. The simple point is that the timescale derived above is modulo f(HI). If f(HI) is as low as , as allowed by the GP measurements, then the AGN lifetime would fall to years. Wyithe et al. (2005) have considered the probability of observing Stromgren spheres of given radii, under the assumption of a fiducial QSO lifetime between 106 and 107 years. They analyze the difference between the host galaxy redshift (based on CO or MgII redshifts, in most cases), and the redshift for the on-set of the GP absorption trough, for 7 QSOs at . They conclude that, if the fiducial lifetime is years, the IGM neutral fraction must be: f(HI) to high probability (90th percentile).
A complementary analysis, based on cosmic ’Stromgren surfaces’, was made recently by Mesinger & Haiman (2004). They compare the redshift for the onset of GP absorption in the Ly and Ly lines. Any difference observed is interpreted as the damping wing of the highly saturated Ly line arising at the hard edge of the Stromgren sphere, decreasing the apparent size of sphere as seen in Ly. From observations of J1030+0524, they also conclude that the neutral fraction at must be: f(HI).
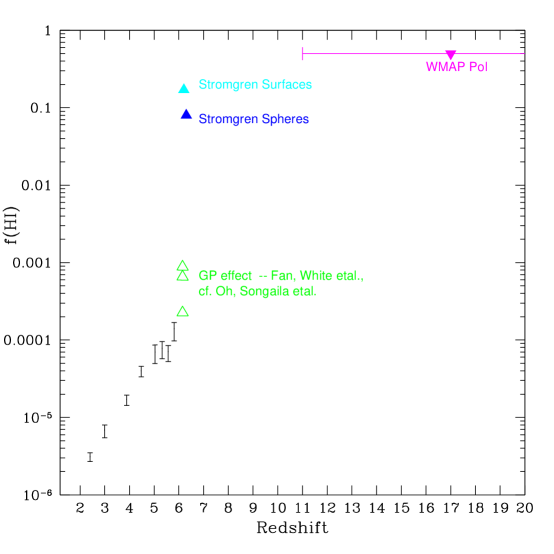
Figure 5 summarizes the current limits on the IGM neutral fraction at high . The GP results suggest a significant rise in the neutral fraction at to 6.5, from f(HI) to . The Stromgren spheres and surfaces indicate a very rapid rise, up to f(HI) in this redshift range. However, this rapid rise must be reconciled with the significant ionization fraction at high redshift derived from the large scale CMB polarization, with f(HI) at .
It is important to emphasize that all of the measurements in Figure 5 are observationally difficult, and the conclusions are currently a topic of debate in the literature. I have discussed potential problems with the GP turn-up and the WMAP turn-down in section 1. The more sophisticated analyses of QSO spectra (the Stromgren spheres and surfaces) are based on only a handful of admittedly noisy spectra, taken in a particularly problematic wavelength range due to night sky lines, and Oh & Furlanetto (2004) have recently challenged both these conclusions.
A major challenge in the coming years for observational cosmology will be to ”connect-the-dots” between the GP points and the WMAP point in Figure 5. However, given the limitations and difficulties of the current measurements, it is imperative that we develop an alternative, more direct measure, of the ionization state of the IGM. This measure will come in the form of direct imaging of the IGM through the HI 21cm line of neutral hydrogen.
4. HI 21cm studies of the neutral IGM during reionization
The ultimate test of cosmic reionization will come through direct imaging of the IGM through the HI 21cm line with future large area low frequency radio telescopes operating in the 100 to 200 MHz range. The important point is that, at some time in the history of the universe, the entire IGM is comprised of neutral hydrogen and helium, thereby raising the possibility of studying large scale structure (LSS) in the HI line. Note that this is not LSS in the classic sense of clusters and superclusters. The HI 21cm signal from LSS during the EoR is a combination of density fluctuations, ionization structure, and excitation (ie. spin) temperature.
| experiment | site | range | FoV | Area | Bmax | cost | date | Goal |
|---|---|---|---|---|---|---|---|---|
| MHz | deg | m2 | km | $ | ||||
| SKA | ? | 100-200 | 15 | 1e6 | 5km=50 | 1G | 2015? | Imaging |
| LOFAR | NL | 115-240 | 10 | 1e5 | 2km=30 | 70M | 2007 | PS/CSS |
| MWA/LFD | Oz | 80-300 | 25 | 2e4 | 1.5 | 5M | 2007 | PS/CSS |
| PAST | China | 70-200 | 10 | 8e4 | 10 | ? | 2006 | PS |
| PAPER | USA | 125-175 | 50 | 100 | 0.2 | small | 2006 | Tbg |
| MarkIV | Oz | 100-200 | 100 | 1 | 0 | small | 2006 | Tbg |
| VLA-VHF | USA | 178-204 | 4 | 1.3e4 | 1 | 0.1M | 2005 | CSS (PS) |
Table 1 lists some current, or planned, experiments to search for the HI 21cm signal from cosmic reionization. These range from multi-million dollar programs that will take years, to 100 kdollar programs that will be on-the-air within the year. Programs being pursued include power spectral analyses of the 21cm signal (PS), searches for cosmic Stromgren spheres associated with the highest SDSS QSOs (CSS; see section 4.3), large area surveys to look for the spectral change in the sky brightness temperature as a function of frequency (Tbg), and eventual tomographic imaging of the IGM structure.
Before discussing the HI signatures, I should emphasize that these are difficult measurements to make for many reasons. First the sky is both hot and confused at low frequency, with the brightness temperature in the colder regions of the sky behaving as K. The foreground has a large scale component due to the Galaxy, plus a contribution from many (mostly extragalactic) point sources. Moreover, this foreground can become polarized at low frequency due to differential Faraday rotation through the Galactic plane (Haverkorn 2004). Second, the 100 to 200 MHz frequency range is riddled with terrestrial interference signals, ranging from FM radio to TV. And third, the ionosphere causes phase fluctuations that increase as .
4.1. Emission
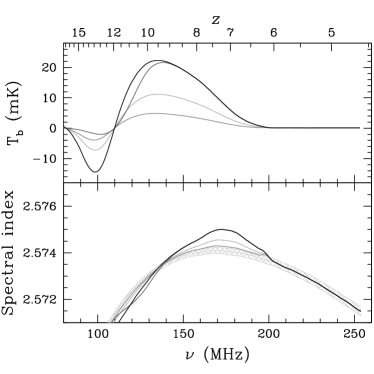
The simplest experiment entails imaging the full sky to search for a global step in the brightness temperature at frequencies corresponding to reionization. Fig. 6 shows the latest calculation of the expected HI 21cm signature at low frequencies (Gnedin & Shaver 2004), corresponding to a full sky, or very large area measurement. In this simulation, at the signal is zero, since the HI spin temperature equals the CMB. At resonant scattering of Ly photons couples the spin temperature to the kinetic temperature, which is initially well below the CMB temperature, and the HI signal is seen in absorption against the CMB. Eventually the IGM warms up, leading to an emission signature at , This emission signal eventually disappears once the IGM becomes reionized. However, the full sky measurement is particularly difficult, since the expected spectral perturbation on the background is at most mK. Gnedin & Shaver point at that one has to measure changes in the spectral index of the non-thermal foreground emission to a part in 104 (Fig. 6).
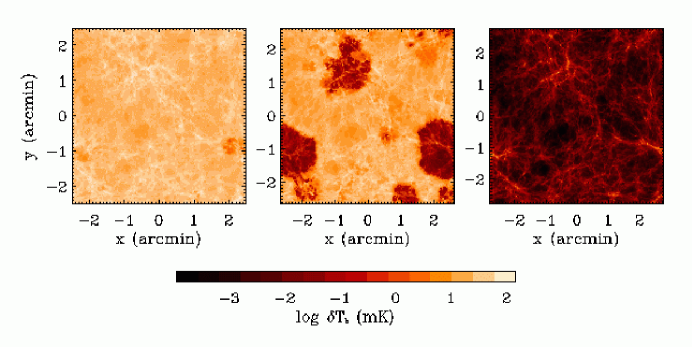
The ultimate goal of HI 21cm observations is tomographic imaging of the IGM during reionization (see Furlanetto & Briggs 2004c and references therein). Fig 7 shows one example of the type of signal one might expect. The first galaxies and AGN generate isolated Stromgren spheres, which eventually grow to overlap, or percolate, leading to a rapid fall in the neutral fraction, ie. a ’cosmic phase transition’ (Gnedin 2005). The expected signals for the Stromgren spheres around normal galaxies is about 10mK on scales of 1′. The proposed SKA should have adequate sensitivity to image such structures, with an expected rms in 100 hours of 4 mK on these scales. Unfortunately, pathfinder experiments such as LOFAR, PAST, and the MWA will have insufficient sensitivity to perform such imaging.
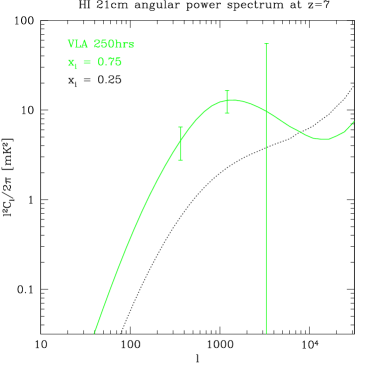
However, all hope is not lost. The path finder finder experiments should have enough sensitivity to measure the power spectrum of the HI 21cm fluctuations. The direct analogy can be drawn with COBE and WMAP, in which COBE lacked the sensitivity to image the CMB fluctuations, but was able to measure the statistical signal via the power spectrum, while WMAP generated true images of the CMB fluctuations. Fig. 6b shows the predicted power spectrum in the HI 21cm fluctuations at to 7, along with the expected errors for measurements made with the VLA-VHF system (see section 4.3). An interesting feature of the power spectrum is that the fluctuation signal increases as the neutral fraction drops, until some point when the IGM is almost fully ionized.
Generating the HI 21cm images and power spectra above requires removal of the non-thermal foreground to a part in 104. The hope is that the foreground can be removed spectrally, since the non-thermal sources are well known to have smooth (power-law) spectra over 10’s of MHz (eg. Morales & Hewitt 2003).
4.2. Absorption
Another potential probe of the neutral IGM is through absorption toward the first radio loud AGN. Fig 8 shows the predicted 21cm absorption signal toward discrete radio sources at and (Carilli et al. 2002). Two signatures are seen: an overall depression due to the mean neutral IGM of at , and discrete lines of few km s-1 width and few optical depth due to moderate density enhancements, , expending in the linear regime. This ’21cm forest’ corresponds directly to the Ly forest after reionization. In essence, after reionization the Ly forest clouds have column densities between 1013 and 1015 cm-2, with a neutral fraction to . Before reionization this implies neutral column densities to cm-2, adequate for studying the HI 21cm line. By redshift 7 the HI 21cm absorption signals have decreased due to the decreased neutral fraction, and the increased spin temperature.


Furlanetto & Loeb (2002) have also hypothesized HI 21cm absorption lines due to the first collapsed objects (mini-halos), and proto-disk galaxies. The mini-halos may contribute a similar line density as the 21cm forest. The proto-disks will be rare, but have higher columns, and hence might be able to be seen against fainter radio sources, such as GRB radio after glows within the host galaxy.
Detecting HI 21cm absorption requires a source population at very high . A number of authors have considered this question, and conclude that an adequate number of radio sources should exist within the EoR to perform such experiments, with a predicted source areal density between 0.05 and 0.5 radio sources per square degree at with SmJy (Carilli et al. 2002; Haiman et al. 2004; Rawlings & Jarvis 2004). The basic point is that the radio loud AGN fraction remains a constant 10 out to the highest redshifts (Petric et al. 2004). The difficult part will be identifying these radio sources as very high objects, although the HI 21cm signal itself may be useful in this regard (Carilli et al. 2002).
4.3. On the fast track: VLA imaging of cosmic Stromgren spheres
I would like to close with a short summary of the VLA-VHF experiment to study the EoR HI 21cm signal. This is a joint SAO-NRAO program to outfit the VLA with prime focus dipole receivers at 178 to 204 MHz for EoR studies (PI L. Greenhill). Funding for the hardware has been granted from SAO, and NRAO has agreed to support the first testing of the system. The project is highly leveraged on existing infrastructure, and hence can be done both very cheaply (K dollars), and very quickly. We will test the first prototypes in February and March 2005, with the plan of performing the first experiments with the full array at the end of 2005. The VLA FoV is deg2, with a resolution of in D array, and an expected rms per 0.8 MHz channel of 0.1 mJy in 250 hours.

The SAO/NRAO program has a very specific goal – to image the cosmic Stromgren spheres around the highest redshift SDSS QSOs. Wyithe & Loeb (2004b) have predicted the HI 21cm signal from such spheres. They predict Stromgren spheres of with a brightness temperature of f(HI) mK. These spheres will be much larger than those associated with normal galaxies, and hence easier to detect. This is perhaps the easiest EoR experiment possible, since we have evidence that these spheres exist (section 3), and the redshifts and positions are known accurately. In piggy-back, we can search for the statistical signal of the neutral IGM in the power spectrum (Fig. 6b).
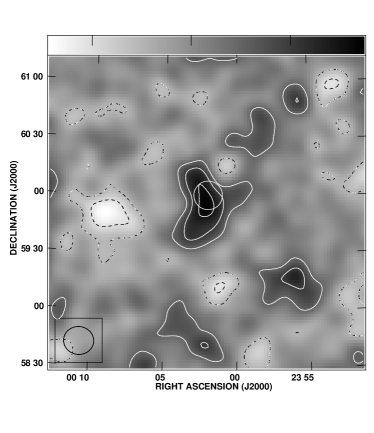
Fig. 9 shows simulations of what the VLA-VHF system might observe toward the QSOs. The combination of spatial and spectral information will be key to verifying the reality of the signal. We expect a signal in two spectral channels, for f(HI). Conversely, by combining channels, and observing a number of sources, we hope to set limits on the IGM neutral fraction, at the level of f(HI). While this may be well above the value expected just based on the GP lower limits, it would represent the first direct limit on the neutral IGM, and probes to the level expected based on the Stromgren spheres and surfaces.
Acknowledgments.
The National Radio Astronomy Observatory is a facility of the National Science Foundation operated under cooperative agreement by Associated Universities, Inc.. I thank my collaborators, F. Bertoldi, K. Menten, F. Walter, P. Cox, A. Beelen, X. Fan, M. Strauss, L. Greenhill, R. Blundell, M. Zaldarriaga, A. Loeb, S. Furlanetto, N. Gnedin, F. Owen, A. Omont, P. van den Bout, P. Solomon, S. Wyithe, and many others, for many things.
References
- (1) Abel, T. et al. 2002, Science, 295, 93
- (2) Andreani, P. et al. 2003, AJ, 125, 444
- (3) Beelen, A. et al. 2004, A& A, 423, 441
- (4) Beelen, A. 2005, PhD Thesis, U.Paris-Sud
- (5) Bertoldi, F. et al. 2003a, A& A, 406, L55
- (6) Bertoldi, F. et al. 2003b, A& A, 409, L47
- (7) Blain, A. et al. 2002, Phys.Rev. 369, 111
- (8) Carilli, C. et al. 2005, ApJ, 618, 586
- (9) Carilli, C. et al. 2004a, New Astr Rev, 48, 979
- (10) Carilli, C. et al. 2004b, AJ, 128, 997
- (11) Carilli, C. et al. 2004c, in Multiwavelength AGN Surveys, eds. Maiolino and Mujica (World Scientific: NJ) p. 115
- (12) Carilli, C. et al. 2002, ApJ, 577, 22
- (13) Cen, R. 2003, ApJ, 591, 12
- (14) Cen, R. & Haiman Z. 2000, ApJ, 542, L75
- (15) Dale, D. et al. 2004, ApJ, 604, 565
- (16) Dame, T. et al. 1987, ApJ, 322, 706
- (17) Downes, D. & Solomon, P. 1998, ApJ, 507, 615
- (18) Djorgovski, S.G. et al. 2001, ApJ, 560, L5
- (19) Dunne, L. et al. 2003, Nature, 424, 285
- (20) Fan, X. et al. 2003, AJ, 125, 1649
- (21) Ferrarese, L. & Merritt, D. 2000, ApJ, 539, L9
- (22) Furlanetto, S. & Loeb, A. 2002, ApJ, 588, 18
- (23) Furlanetto, S. & Loeb, A. 2004, ApJ, in press (astroph/0409656)
- (24) Furlanetto, S. et al. 2004, MNRAS, 354, 695
- (25) Gao, Y. & Solomon, P. 2004, ApJ, 606, 271
- (26) Gebhardt, Karl et al. 2000, ApJ (letters), 539, 13
- (27) Gnedin, N. 2005, ApJ, in press (astroph/0403699)
- (28) Gnedin, N. & Shaver, P. 2004, ApJ, 608, 611
- (29) Haiman, Z., Quatert, E., Bower, G. 2004, ApJ, in press (astroph/0403104)
- (30) Haiman, Z. 2002, 576, L1
- (31) Haverkorn, M. et al. 2004, A& A, 427, 549
- (32) Hui, L. & Haiman, Z. 2003, ApJ, 596, 9
- (33) Kogut, A., Spergel, D., Barnes, C. et al. 2003, ApJS, 148, 161
- (34) Loeb, A. & Barkana, R. ARAA, 2001, 39, 19
- (35) Maiolino, R. et al. 2004, Nature, 431, 533
- (36) Malhotra, S. & Rhoads, J. 2004, ApJ, 617, L5
- (37) Mesinger, A. & Haiman, Z. 2004, ApJ, 611, L69
- (38) Momjian, E. et al. 2004, AJ, 127, 587
- (39) Morales, M. & Hewitt, J. 2004, ApJ, 615, 7
- (40) Omont, A. et al. 2003, A& A, 398, 857
- (41) Oh, S.P. & Furlanetto, S. 2005, ApJ, 620, L9
- (42) Petric, A. et al. 2004, AJ, 126, 15
- (43) Pety, J. et al. 2004, A& A, in press (astroph/0411085)
- (44) Shaver, P. et al. 1999, A& A, 345, 380
- (45) Rawlings, S. & Jarvis, M.J., 2004, MNRAS, in press
- (46) Richards, G. et al. 2002, AJ Supp, 124, 1
- (47) Songaila, A. 2004, AJ, 127, 2598
- (48) Stern, D. et al. 2004, ApJ, 619, 12
- (49) van der Werf, P. 1999, in Highly Redshifted Radio Lines, eds. Carilli et al. (ASP: San Francisco), p. 91
- (50) Walter, F. et al. 2004, ApJ, 615, L17
- (51) Walter, F. et al. 2003, Nature, 424, 406
- (52) White, R. et al. 2003, AJ, 126, 1
- (53) White, R. et al. 2005, AJ, in press (astroph/0411195)
- (54) Willott, C.J., McClure, R., & Jarvis, M. 2003, ApJ, 587, L15
- (55) Wyithe, S. et al. 2005, ApJ, in press (astroph/0411625)
- (56) Wyithe, S. & Padmanaban 2005, MNRAS, in press (astroph/0501330)
- (57) Withe, A. & Loeb, L. 2004, Nature, 427, 815
- (58) Withe, A. & Loeb, L. 2004b, ApJ, 610, 117
- (59) Yu, Q. & Tremaine, S. 2002, MNRAS, 335, 965
- (60) Yun, M. et al. 2001, ApJ, 554, 803
- (61) Zaldarriaga, M., Furlanetto, S., Hernquist, L. 2004, ApJ, 608, 622