2European Southern Observatory, Casilla 19001, Santiago 19, Chile
3Astronomisches Institut der Ruhruniversität Bochum, 44780 Bochum, Germany
email vallenari@astrpd.pd.astro.it
The star formation history of the LSB Galaxy UGC 5889 ††thanks: Based on observations collected with Hubble Space Telescope
We present HST photometry of the LSB galaxy UGC 5889 and derive its recent star formation history. In the last 200 Myr the star formation proceeded in modest bursts at a rate of the order of 10-2-10-3 M☉/yr, with periods of extremely low SFR or even quiescence. The rate derived from the present study for the last 20 Myr is in agreement with the Hα emission from the galaxy. The presence of a consistent population older than 200 Myr is suggested by the data. However, observational errors and completeness correction prevent any firm conclusion on the oldest age. The total mass of stars is of the order of 5.5 M☉. Even if the recent episodes of star formation have heated the gas and carved a hole in the disk, blow-away of the gas is unlikely to occur.
Key Words.:
Techniques: photometric; Stars: formation Galaxies: formation; Galaxies: stellar content1 Introduction
It is well known that low surface brightness (LSB) galaxies contribute significantly to the total galaxy counts (see e.g. Marzke & da Costa, marz+97 (1997)) and might even constitute the majority of galaxies (O’Neil & Bothun onei+00 (2000)). LSB galaxies show a large variety of properties, ranging from the blue to the red end of galaxy colours (O’Neil et al. 1997, 2000) and consisting of dwarfs as well as of massive systems (Sprayberry et al. 1995). Concerning their metal content, the vast majority of LSB galaxies show low metal content (de Block &van der Hulst 1998), although some red LSB galaxies having solar metallicity have been recently detected (Bergmann et al. 2003). Among these diverse systems, we focus on one of the most common types, the blue LSB (BLSB) galaxies (see the review by Impey & Bothun impe+97 (1997) and references therein), late-type disk galaxies having B surface brightness mag arcsec-2 where colours of (B-V) are found (O’Neil et al. onei+97 (1997)). These blue colours are puzzling primarily because of the restrictions they put on the star formation history of LSB galaxies. Even if they present low surface gas density, BLSB are among the most gas-rich galaxies at a given total luminosity. The high gas fraction of BLSB galaxies, together with their low metal content, suggest that they are relatively unevolved objects. This can be interpreted in various ways. For instance BLSB galaxies can have very low present and past star formation rates (SFR): in these systems the main phase of star formation is still to occur. Alternatively, these galaxies can have a stellar population similar to those of high surface brightness spirals, but their luminosity can be dominated by a young population. Until now, the investigation of the stellar content of LSB galaxies has mainly been based on the discussion of the integrated colours. Many studies are consistent with a scenario where BLSB galaxies have on average a constant or increasing SFR with a ratio of young to old stars larger than found in high brightness spirals (van den Hoek et al. 2000, Knezek 1993, Bell & de Jong 1999). However, different opinions can be found in the literature, either suggesting that the SFR can be proceeding in frequent, small amplitude bursts (van den Hoek et al. 2000) or that the bulk of the population is older than 5-7 Gyr (Padoan et al. 1997). Finally, it is far from being understood how stars form in a low density, low metal content environment and what is the relation between SFR and other properties of LSB galaxies (i.e. the angular momentum) (see among others O’Neil et al. 2000, Boissier et al. 2003, Dalcanton, Spergel & Summers 1997).
In this paper we focus on the study of a resolved LSB galaxy: UGC 5889 (NGC 3377A). This dwarf galaxy is a member of the Leo I group. Due to its similar redshift and resulting proximity – only 20 Kpc in projected distance (Sandage & Hoffman, sand+91 (1991)), it is thought to be a companion of the large elliptical NGC 3377. With ML M L⊙, it is gas rich (Knezek et al. knez+99 (1999)). It is classified as a low surface brightness dwarf having an average surface brightness inside the Holmberg radius of B=23.97 mag arcsec -2. Moderately blue colours (U-B), and (B-V) are given by Prugniel & Heraudeau (prug+98 (1998)).
Base on its optical morphology, Knezek et al. (knez+99 (1999)) suggested the presence of a spiral structure classifying the galaxy as SABm. This has recently been supported by high resolution spectroscopic H I–measurements of Huchtmeier et al. (huch+03 (2003)), who find a double peaked profile for this galaxy which is typical for spirals. The H I intensity maps of Simpson & Gottesman (simp+00 (2000)) show a ring–shaped distribution of the gas which is surrounding the bulk of the optical body and is correlated with the young star groups discovered by Vicari et al.(vica+02 (2002)).
Knezek et al. (knez+99 (1999)) also measured the Hα luminosity of UGC 5889 and found a relatively low value of L ergs s-1, which is about ten times lower than the average Hα luminosity in the sample of quiescent dwarf spiral galaxies studied by van Zee et al. (vanz+97 (1997)). Thus, despite the dense environment where it is located, UGC 5889 appears to be a very quiet dwarf galaxy. Knezek et al. (knez+99 (1999)) discuss the possibility that it might represent a true transition object between late type dwarf galaxies and low SFR dwarf ellipticals as suggested by Sandage & Hoffman (sand+91 (1991)). However they reject the hypothesis, since with its large gas reservoir UGC 5889 can continue to form stars at the present SFR for much longer than the Hubble time.
The star formation history of UGC 5889 is unknown. It is still not clear whether the current SFR represents the mean level over the galaxy lifetime or, whether the star formation of this galaxy has occurred at a different rate in the past. This paper deals with the determination of the SFR and the SFR history from the analysis of colour–magnitude diagrams (CMDs). The plan of this paper is as follows: in Section 2, we discuss the observations, the data reduction and we present the observed CMD. In Section 3, we derive the distance modulus, in section 4, the basic CMD features. In Section 5 we determine the star formation history of the galaxy and we discuss the feedback from star formation. In Section 6, we compare the SFR of UGC 5889 with other LSB galaxies. Conclusions are drawn in Section 7.
2 Observation and reduction
We use HST archive data of UGC 5889 taken in 1995 with WFPC2 at two different position angles and locations. In total, 21 partially overlapping F555W and four F814W frames are used including long and short exposed frames and yielding a total exposure time of 6000 s in F814W and 25300 s in F555W.
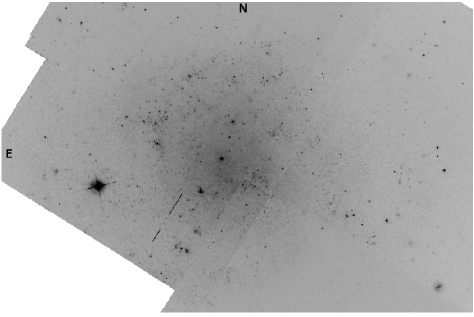
A composite image of the galaxy in the F555W filter is presented in Fig.1. It shows the high spatial resolution, which allowed the photometric measurement of individual stars.
The data have been reduced using the stand–alone version of DAOPHOT including ALLFRAME and following the ALLFRAME cookbook (Turner turn96 (1996)). To de-select suspected clusters and foreground galaxies we excluded the objects with FWHM larger than 2 pixels using the ALLFRAME parameter ’sharp’. In total, we derive photometry for 4843 stars in the galaxy spanning the F814W magnitude range from 20m to fainter then 27m.
The photometric calibration has been done following the prescriptions by Dolphin (dolph (2000)). We estimate the error on the zero point as 0.1 mag. The completeness factors are calculated as usual by means of artificial star experiments and are plotted in Fig. 2. The data are complete at 40% level for magnitudes brighter than F555W 27.5 or F814W 26.5. Artificial star experiments are used as well to derive the errors on the magnitudes due both to the Poisson noise and crowding. These errors are listed in Table 1. Photometric errors due only to the Poisson statistics on the noise are estimated by ALLFRAME. As expected, they are smaller, being 0.1, 0.14, 0.22, 0.30 for F555W magnitudes 25,26,27,27.5, respectively. The analogous photometric errors on F814W magnitude are 0.1, 0.12, 0.24 for F814W 24,25,26 respectively.
| F555W [mag] | |||||
|---|---|---|---|---|---|
| [mag] | 0.1 | 0.2 | 0.3 | 0.45 | |
| F814W [mag] | |||||
| [mag] | 0.2 | 0.3 |
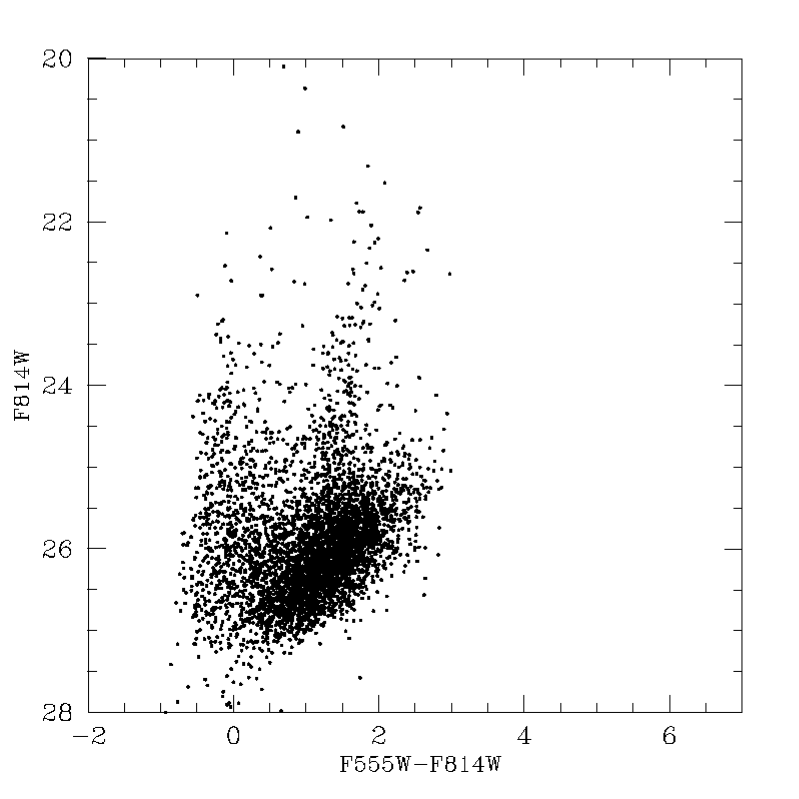
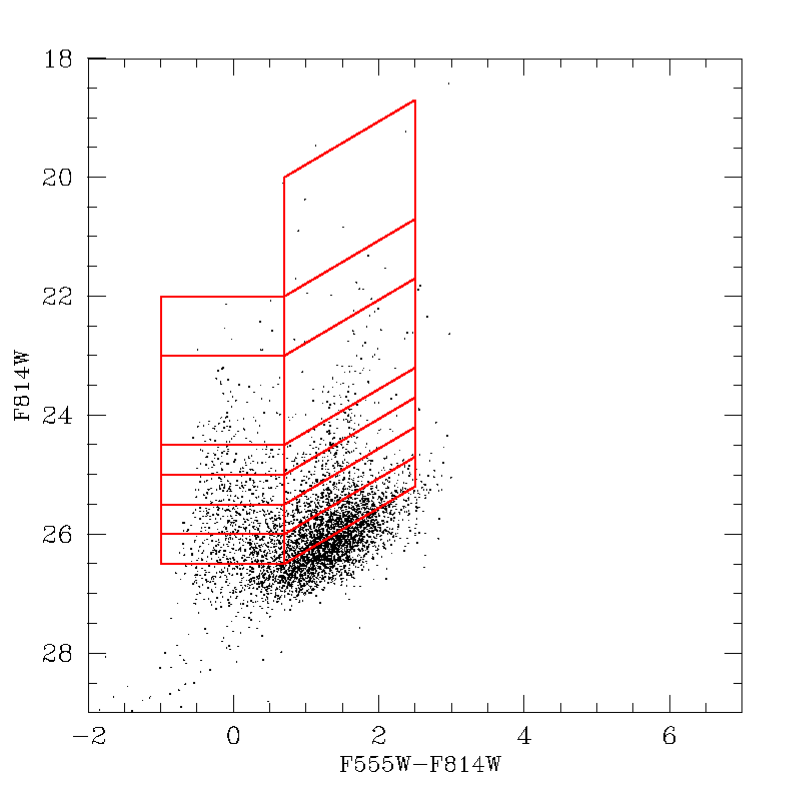
The CMD of the whole galaxy is plotted in Fig.3. The blue plume is located at (F555W-F814W) 0.5 and extends from the limiting magnitude at F814W 27 up to 22. The red evolved stars extend from F814W to and have (F555W-F814W)0.5.

3 Distance modulus determination
The I magnitude of the tip of the red giant branch (TRGB) has been shown to be an excellent distance indicator for nearby resolved galaxies (Lee et al. lee+93 (1993)). The position of the TRGB in UGC 5889 has been obtained dividing the observational F814W–(F555W-F814W) CMD into small intervals of width (0.15, 0.15) and then convolving the bi–dimensional histogram with an edge detector function, namely a gradient filter with an angle of 90 degrees, increasing the contrast at increasing magnitudes. The sharp cut-off at the end of the RGB is clearly detected by the gradient filter (see Fig4). We take the position of the main peak as our estimate of the tip magnitude and the half width at half maximum of the peak as the uncertainty on the determination. We find F814W=25.65 as the TRGB magnitude. Since all the existing calibrations of the TRGB magnitude are expressed in the Johnson passbands, we first convert the de-reddened HST F555, F814 magnitudes to the V, I magnitudes.
We derive the foreground reddening from the maps of Schlegel et al. (schl+98 (1998)), , resulting in . This value is slightly lower than the estimated by Knezek et al. (knez+99 (1999)) using the standard dust-to-gas ratio of Diplas & Savage (dipl+94 (1994)) and the H I measurements of Hartmann & Burton (hart+97 (1997)). The resulting difference in magnitude is within the photometric errors and hence does not affect our further conclusions.
We therefore use corresponding to and . With these values, the magnitude and colour at the TRGB transform into the Johnson I0=25.47, (V-I)0=1.48.
The distance modulus is derived from the magnitude at the TRGB using the definition:
The dependence of on the metal content is given by the recent calibrations of Bellazzini et al.(2001, 2004):
This holds true for populations in the age range from 2 to 12 Gyr and . This method to derive the distance has been proved to be independent of the details of the star formation history (Barker et al. 2004). In the above metallicity range, when and when . Since the metal content of UGC 5889 is likely inside the above range (see following Section), we are probably not seriously in error if we assume . This results in a distance modulus of , where the quoted errors take into account both the uncertainties on the absolute magnitude and on the observational magnitude of the tip. This value is in reasonable agreement with previous determinations. For the companion NGC 3377, Graham et al. (grah+97 (1997)) derive a distance modulus . A direct determination for UGC 5889 has been made by Makarova & Karachentsev (maka+98 (1998)) using the magnitude of the brightest blue stars, and they find (m-M)0=29.8.

4 CMD discussion
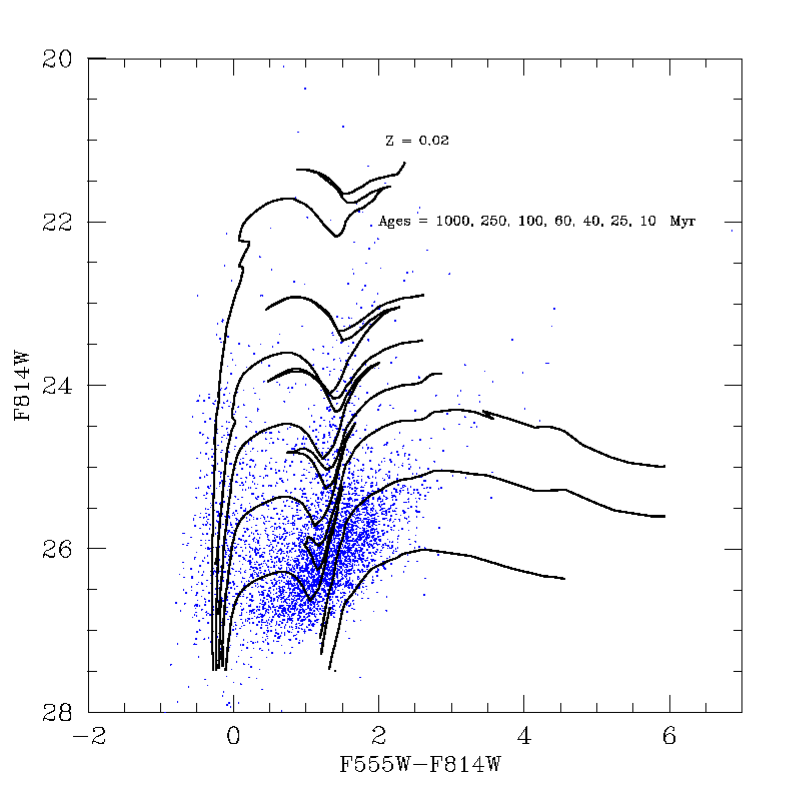
To derive information about the SFR, we compare the CMD with isochrones of different metallicity. Fig.5 shows the CMD with the isochrones of which reproduce the main features of the CMD such as the slope of the giant branch and the location of those stars brighter than F814W and bluer than (F555W-F814W) (blue plume). This blue plume is formed by a mixture of main sequence and blue loop stars which crowd the same CMD region.
A solar metallicity is only marginally consistent, predicting a colour of the core He–burning stars redder than observed (see Fig.6). Core He-burning stars as old as 200 Myr are crowding the clump of the red stars brighter than F814W and having (F555-F814). We expect to have a good time resolution for ages younger than about 200 Myr. At this age, main sequence stars and/or He-burning loop stars are brighter than the completeness limit.
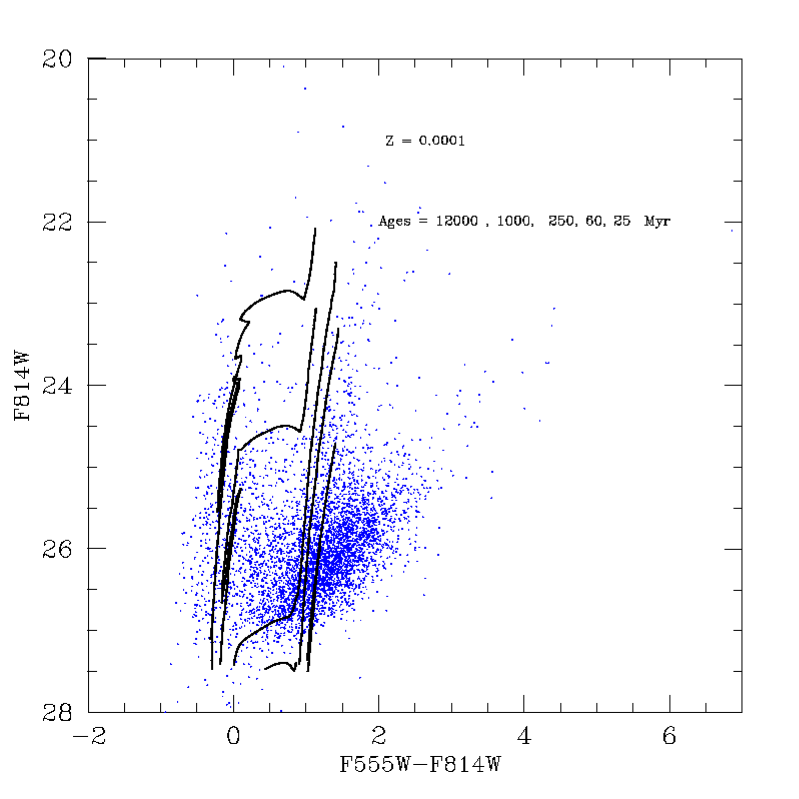
Concerning the presence of an older population, hints can be derived from the CMD. The large clump redder than (F555-F814) extending down to the photometry limit of F814W is consistent with the presence of AGB and He-burning stars of in the age range 600-1000 Myr. Comparing the observational CMD with isochrones as metal-poor as , it is evident that this metallicity cannot reproduce the AGB/RGB colour of stars younger than 1 Gyr (see Fig. 7). However, the existence of a metal poor population ( ) in the age range 1–12 Gyr cannot be ruled out. Stars of this age in the RGB/AGB phase are expected to appear at magnitudes fainter than F814W and at a colour (F555-F814).

5 Star formation rate
In order to infer the SFR of this galaxy, theoretical CMDs in different age ranges are simulated. These include the spread due to observational photometric errors. For each age bin, 1000 stars were generated. The generation of the synthetic populations makes use of the set of stellar tracks by Girardi et al. (gira+96 (1996); gira+00 (2000)). The initial mass function (IMF) of Kroupa (2001, 2002) is assumed. This IMF is a power-law function with a slope for stellar masses m M☉, while in the mass range 0.08-0.5 M☉ (when the standard Salpeter value is 2.35). The constancy of the IMF slope in different environments is still a matter of discussion, although a number of recent papers proposed the idea of a universal IMF (see e.g. Kroupa 2002, Wyse et al. 2002, Chabrier 2003, Weidner & Kroupa 2004). Recently, it has been suggested that might depend on the galaxy type. For the IMF in LSB galaxies, it has been proposed that the effect of the low metal content can result in an inefficient SF taking place mainly outside the giant molecular clouds, thus yielding an IMF deficient in massive stars. As a consequence the IMF slope might be as steep as (Schombert et al. 1990). However, in this paper a more conservative approach is used, since a variation of the IMF slope in LSB galaxies is not at present completely justifiable (Lee et al. 2004). The completeness of the data is taken into account by dividing the simulated CMD in magnitude–colour bins and then subtracting from each bin having Nth stars, (1-)Nth, where is the smallest of the F555W and F814W completeness factors as given in Fig.2.
Finally, the SFR is derived by means of a downhill simplex method (Harris & Zaritsky 2001, Rizzi et al. 2002), minimising the function in a parameter-space having N dimensions. At each step the local gradient is derived and a step in the direction of the gradient is taken, until a minimum is found. In the following, the observational CMD is divided into bins. Recent work concerning the determination of the SFR from the CMDs has pointed out the importance of using binning that takes into account the various stellar evolutionary phases, as well as the uncertainties on the stellar models (Rizzi et al. 2001). For this reason, while a coarser magnitude bin distribution is used, only two bins in colour are considered, namely from -0.5 to 0.5, corresponding to blue plume stars, and from 0.5 to 3, where the evolved stars are located. This avoids that the uncertainties on both the observational errors and the theoretical models (i.e. on bolometric corrections, RGB and AGB location, extension of the core He-burning loop) result in spurious solutions. Additionally the magnitude bins are taken in the blue part of the CMD at constant F814W magnitude, while in the red part they are at constant F555W magnitude. The reason for this is that the completeness limit in the red part of the CMD is mainly dependent on the completeness of the F555W magnitude. This is illustrated in Fig. 8. To prevent settling on local rather than global minima, the simplex is first started from a random position, then when a possible solution is obtained, it is re-started from a position very close to it. Finally, when a minimum is found, 30000 random directions are searched for a new minimum.
The first guess solution is obtained by comparing the observational CMD with isochrones of different ages and metallicities (see previous section). We use N=14 stellar populations, whose ages are listed in Table 2. The chemical enrichment law is assumed as a pre-defined input parameter, derived comparing data and isochrones. Following the discussion of the previous section for ages younger than 20 Myr, we assume that the stars are generated with a metal content randomly chosen in the range Z=0.004-0.01. SFR episodes in the age range 20 Myr-200 Myr are assumed to be produced by stars having Z=0.001-0.01. An older population in the age range 0.2–1 Gyr with the same metal content is included. A population of metal-poor stars with Z=0.0003-0.004 and as old as 1-12 Gyr is also taken into account, since due to the low metal content, their magnitudes will be brighter than the photometry limit of F555W 27.5. Metal-rich stars in the same age range are not considered since they are expected to be too faint. As discussed in Section 4, we are aware that we have poor age and SF resolution for populations older than 200 Myr. Therefore, the old age bin is included only to get an indication of the presence of an old population.
| SFR | |||||
|---|---|---|---|---|---|
| Gyr | Gyr | 10-3M | 10-3M | 10-3M | |
| SFR1 | 0.006 | 0.007 | 86.9 | 85.3 | 90.9 |
| SFR2 | 0.010 | 0.015 | 1.6 | 1.6 | 2.1 |
| SFR3 | 0.015 | 0.020 | 3.7 | 3.6 | 4.2 |
| SFR4 | 0.020 | 0.030 | 0.0 | 0.0 | 0.6 |
| SFR5 | 0.030 | 0.040 | 0.17 | 0.17 | 0.8 |
| SFR6 | 0.040 | 0.050 | 2.0 | 1.7 | 2.8 |
| SFR7 | 0.050 | 0.060 | 0.0 | 0.0 | 0.9 |
| SFR8 | 0.060 | 0.070 | 0.0 | 0.0 | 1.0 |
| SFR9 | 0.070 | 0.080 | 6.9 | 6.7 | 7.9 |
| SFR10 | 0.080 | 0.090 | 0.0 | 0.0 | 1.1 |
| SFR11 | 0.090 | 0.100 | 0.0 | 0.0 | 1.1 |
| SFR12 | 0.100 | 0.200 | 7.0 | 6.9 | 7.3 |
| SFR13 | 0.200 | 1.000 | 1.8 | 1.7 | 2.2 |
| SFR14 | 1.000 | 12.000 | 7.5 | 7.3 | 7.6 |
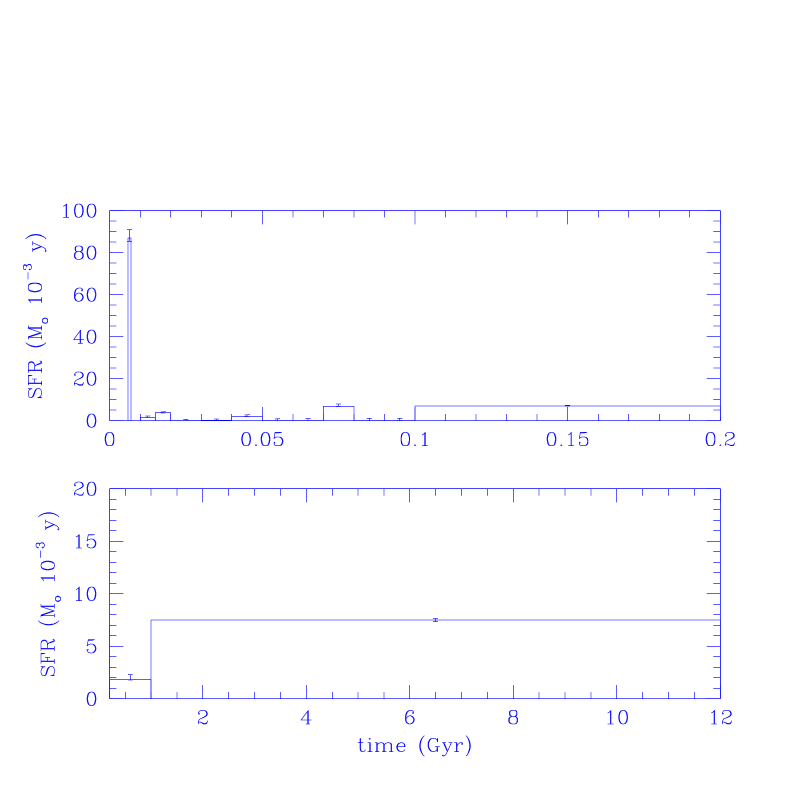
In Fig.9 the best solution is plotted. The corresponding best fit SFRs are given in Table 2. We derive a value of 1.7. In order to better understand the quality of the fit, we compare the values of from two simulations with the same observational errors and input parameters, but different random number generators. The resulting for the second solution is 1.5 and supports the original finding. The range of SFR corresponding to 68% of the confidence level is given in Table 2. This formal error is obtained by exploring the parameter space by varying all the amplitudes simultaneously in random directions, stepping away from the minimum until the value indicates that we have reached the 68% confidence level. The number of random directions to be checked has been tested on the simulations. About 50000 random directions are explored and are found to be sufficient to derive the confidence level.
The recent star formation appears to have proceeded in modest episodes at a rate of the order of 10-2 M☉/yr, with periods of lower star formation or even quiescence. A very short burst took place 6 Myr ago and lasted about 1 Myr. Any other solution involving different durations, intensities, or age scales for star formation episodes younger than 10 Myr yields a worse fit.
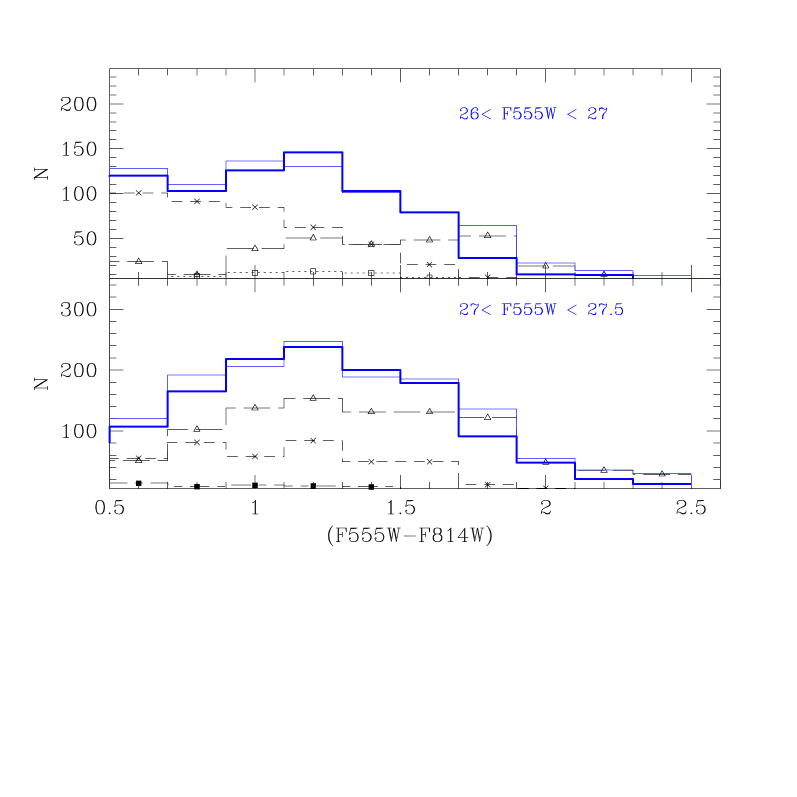
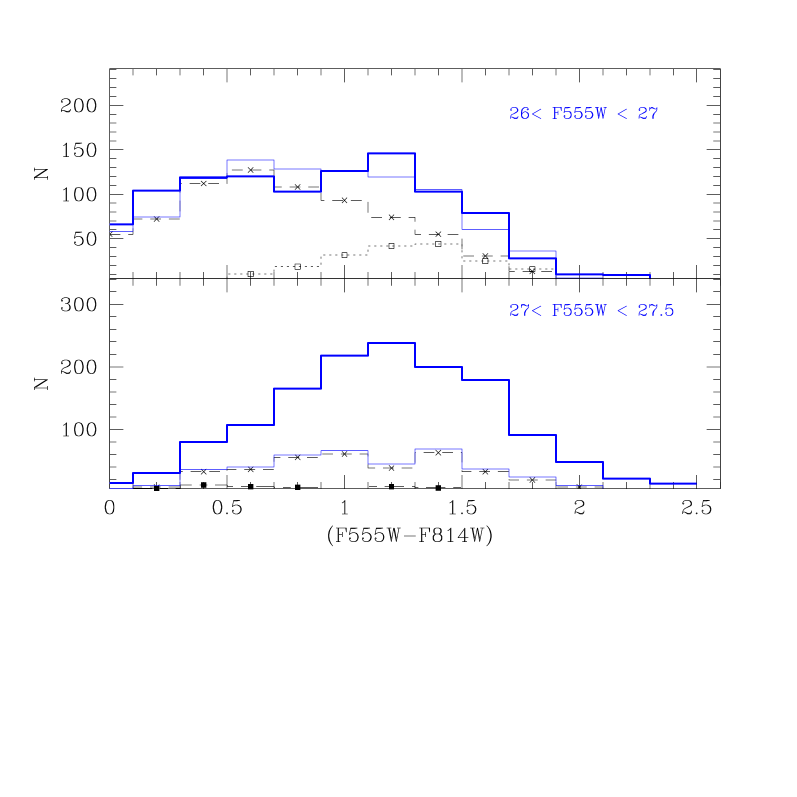
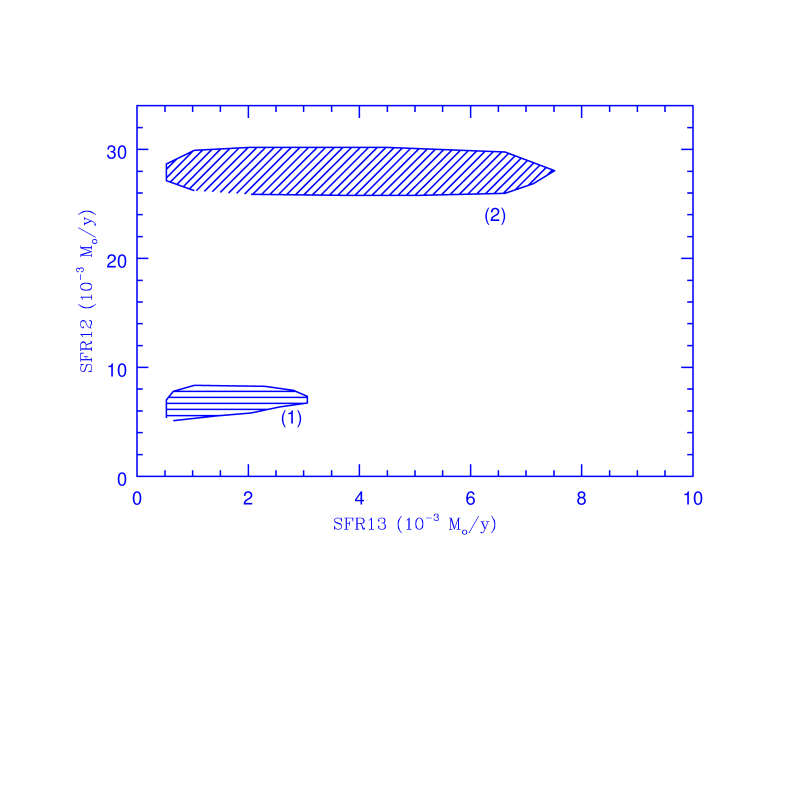
To assess the reliability of the solution at old ages, the downhill simplex method is applied to a different sets of initial ages, excluding in turn the oldest populations, in the age range 0.2 - 1 Gyr and 1-12 Gyr, respectively. The simplex converges at high values of , 4.6 and 2.9 respectively. To better verify the presence of an old population, we consider the CMD stars redder than (F555W-F814W) and fainter than F555W. This region of the CMD is populated by stars older than 0.09 Gyr. We analyse the colour distribution in two magnitude bins, namely F555W, F555W,corresponding to the two faintest magnitude bins in the red part of the CMD in Fig.8. We make use of the last 4 populations of Table 2. Figs 10 and 11 present the best fit solution together with the data in two cases, a) including the population older than 1 Gyr, and b) without it. In the case b) it is not possible to fit all the magnitude bins with the same combination of populations. For instance in Fig. 11 the SFR fitting the bin 27-27.5 cannot reproduce the data in the brighter magnitude bins. This is evident as well from Fig.12 where the confidence interval for the SFRs of populations 12 and 13 are plotted in case b). No common solution is found when the population older than 1 Gyr is not included. However, taking into account the presence of observational errors and completeness correction, we prefer to conclude than the resolution of the data is sufficient to assess the presence of a consistent population older than 200 Myr, but finer age division cannot be reliably derived. Finally, the stability of the solution against different sub–divisions of the CMD in cells is tested: slightly larger uncertainties result when a constant bin of 0.5 mag is used.
Fig.13 presents the simulated CMD for the best solution. The simulated CMD is similar to the observational one. The total mass going into stars is about 5.5 M☉. Since the total mass of the gas at present is observationally estimated to be 1.6 M☉ (Simpson & Gottesman simp+00 (2000)), the present day gas fraction comes out to be fg=. An independent check of this value can be derived if fg is expressed in terms of observable quantities as:
f
Bell et al. (2003) derive for a Salpeter IMF:
Using (B-V)=0.64, , and we find f in agreement with the determination obtained from the SF.

5.1 Star formation rate from Hα luminosity
The total luminosity L emitted in Hα can be used to estimate the recent SFR. Following Kennicutt et al. (kenn+94 (1994)) the can be obtained from
Adopting L erg s-1 as derived for UGC 5889 by Knezek et al. knez+99 (1999), we find M⊙yr-1. This SFR should be regarded as the average value over the lifetime of the stars emitting in . Assuming that the majority of the flux in Hα is due to stars more massive than 10 M⊙, this gives an estimate of the SFR over the lifetime of a 10 M⊙ star. This lifetime can be derived from Girardi et al. (gira+00 (2000)) tracks for as Myr. This SFR can be directly compared with the rate derived from the star-counts. Using the coefficients of Table 2, we derive a SFR of M⊙yr-1 averaged over the past Myr of the galaxy lifetime, in good agreement with the L determination.
5.2 The feedback from star formation
The HI distribution of UGC 5889 shows a concentration of the gas in a ring surrounding the bulk of the optical body (Simpson & Gottesman 2000). The velocity field reveals a rotation of the entire ring-shaped distribution and no sign of expansion of the ring is found. This kind of disturbed interstellar medium is not unusual in dwarf galaxies (Puche & Westphal 1993, Young & Lo 1996, Simpson & Gottesman 2000). The hypothesis naturally arises that this dramatic morphology might be the result of a vigorous star formation episode in a galaxy with a shallow potential well. In fact the energy injected in the gas by SNs and stellar winds can trigger the formation of super-bubbles that can easily expand in a low density medium. The expansion sweeps up the gas, forms a cavity at the centre, and leaves behind a system where the majority of the gas is located in the outskirts. This gas can be lost by the galaxy or can cool and rain back on to the galaxy after a cooling time (McLow& Ferrara 1999). In this section, we discuss whether the energy injected in the gas by the SN explosions we estimate on the basis of the derived SFR can be sufficient to explain the morphology of the HI in UGC 5889. Finally, we discuss what might be the fate of this gas, i.e. whether a blow–out or a blow-away can take place. Following McLow& Ferrara (1999) and Ferrara & Tolstoy (2000) we define a blow–out as a process where the central SN explosions carve a hole in the gas disk, accelerating a fraction of it, while the remaining gas stays almost unperturbed. In a blow-away nearly all the gas is accelerated above the escape velocity and is lost from the galaxy.
To discuss the possibility of blow–out, let us assume that, perpendicular to the galactic plane, the unperturbed gas density distribution in the galaxy is exponential , where z is the vertical coordinate, H is the galactic exponential scale height. The velocity of the shock wave produced by the SN explosions can be expressed as , where p is the pressure. The velocity of the shock produced in a stratified medium decreases down to a minimum occurring at z=3H before being re-accelerated in case of a blow–out. A blow–out takes place when the velocity exceeds the escape velocity of the galaxy at z=3H, where the shock wave is accelerated to infinity. LSB galaxies are believed to be dark matter dominated (McGaugh & de Block 1998). In order to calculate the escape velocity, the galaxy is modelled including the presence of a dark matter halo as in Persic & Salucci (1996). The dark to visible mass ratio can be expressed as a function of the visible galaxy mass in M☉, as
.
Assuming as (Simpson & Gottesman 2000), we find . This value is in reasonable agreement with the ratios in the range 10-30 derived for LSB galaxies by McGaugh & Blok (1998). The blow–out condition can be expressed as (McLow & Ferrara 1999):
where is the mechanical luminosity of the SN explosions i.e. the energy produced by SN explosions divided by the average lifetime of the less massive star mlow exploding as a SN. If we assume mlow then its lifetime is Myr. is expressed in erg sec-1 when is the sound speed of the interstellar medium in 10 km sec-1 including a turbulence contribution, and is the scaled Hubble constant, assumed to be 0.65. Comparing the HI location with the optical image, it is clear that the youngest stars are located in the outskirts of the gas distribution. Hence, the youngest star formation episode at 5 Myr cannot have induced the SN explosions responsible for the central gas depletion. For this reason, we calculate using the mean SFR derived from our model in the last 20 Myr. Substituting in the blow-out condition we obtain:
.
This means that the blow–out condition holds true inside the gas: a blow–out is then responsible for the peculiar morphology of the ISM in UGC 5889. By definition, the blow–out involves only a fraction of the mass of the gas, that which is inside the cavities created by the SN explosions. A more disruptive phenomenon is the blow-away in which the gas content of the parent galaxy is completely lost. The blow-away can take place when the momentum of the gas shell at the radius rs is larger than the momentum necessary to accelerate the gas outside rs at a velocity larger than the escape velocity. This condition can be expressed following McLow & Ferrara (1999) as:
where is a scale factor. Under reasonable assumptions concerning the sound speed , this condition is not verified even if is assumed to vary in the range 5-30. The ultimate fate of the gas seems to be that it will not leave its parent galaxy. This result is in full agreement with the low gas velocity derived observationally (Simpson & Gottesman 2000).
6 Comparison with other LSB galaxies
Bursty star formation history in LSB galaxies has been suggested in the literature. We quote, from amongst others, Boissier et al. (boss+03 (2003)) who find that it is necessary to include star formation events such as bursts in the models of LSB galaxy evolution to account for the observed scatter in the Tully–Fisher and total mass of the gas–to–luminosity relation. A burst scenario is proposed by O’Neil et al. (onei+98 (1998)) to explain both the blue colour as well as the disrupted morphology of most blue LSB galaxies.
The dwarf irregular galaxy IC 1613 has similar colours (B-V = 0.71) and its SF has been studied in great detail. Cole et al. (cole+99 (1999)) find a nearly constant SFR at a low level of over the past 1–300 Myr. However, due to the large angular size of IC 1613, they only study the very central part of it, which might not be representative of the SF over the whole galaxy. Note for example that in UGC 5889, the recent SF is concentrated on the outer edge, while the centre is inhabited by the older population. Skillman et al. (skil+03 (2003)) compared it with a field situated at the outer edge of IC 1613, but studied the intermediate–age and ancient SFR, starting at an age of 100 Myr. A comparison with the CMD of Cole et al. yielded no significant difference. Although their data are consistent with constant SFR, they find small bursts in the SFR and a strong enhancement of the SFR at intermediate ages. However, no evidence is found for a strong, bursty SFR in the recent history. In fact, the CMDs presented by Skillman et al. as well as the one by Cole et al. lack the bright blue stars that are present in UGC 5889 and can only be explained by recent SF. Therefore, although both galaxies are classified as blue LSB galaxies they differ in their SFR in the sense that IC 1613 is dominated by SF at intermediate age, while UGC 5889 is dominated by more recent SF. This behaviour is also reflected by the total mass–over–luminosity ratio, which is slightly lower for UGC 5889.
7 Conclusions
In this paper we have discussed the star formation history of the LSB galaxy UGC 5889 on the basis of HST archive data. Our main conclusions can be summarised as the following:
1) the RGB tip is detected at F814W=25.65 implying a distance modulus of .
2) the recent star formation is proceeding in modest bursts at a rate of the order of 10-2 - 10-3 M☉/yr. This rate is lower than the 5-10 M☉/yr derived for high surface brightness disk galaxies (Kennicutt 1992), but only slightly larger or comparable to the 10-3 M☉/yr observed in dwarf irregulars (Hunter & Gallagher 1986). The SFR derived in UGC 5889 from Hα emission is in agreement with the results obtained from CMD analysis.
3) The existence of a consistent population older than 200 Myr and possibly older than 1 Gyr is suggested by our analysis. However, this result might depend on the completeness correction and observational errors and needs to be verified with deeper photometry.
4) The present-day total mass in stars is of the order of 8.3 M☉. Since the total mass of the gas has been estimated as 1.6 M☉, the gas fraction is fg=0.19.
5) The morphology of the gas inside this galaxy reveals a large cavity, including the main optical body of the galaxy. The gas is mainly located in the external regions. We have calculated the SFR feed-back on the interstellar gas. We find that this impressive morphology is consistent with the hypothesis that SN explosions have produced a blow–out of the gas from the internal regions towards the external ones. On the basis of our calculations, it seems however quite unlikely that the final fate of this gas is to leave the galaxy.
Acknowledgements.
This research has made thorough use of the Simbad database operated at CDS, Strasbourg, France. This work was done while AV was visiting scientist at ESO, Santiago. We thank the referee, P. Knezek, whose comments greatly improved this paper. We thank K. O’Brien for a careful reading of the manuscript. We are indebt to G. Bertelli for many fruitful discussions.References
- (1) Barker, M. K., Sarajedini, A., & Harris, J. 2004, ApJ, 606, 869
- (2) Bell E.F., de Jong R.S., 1999, MNRAS
- (3) Bell E.F., McIntosh I.H., Katz, N., Weinberg M.D., 2003, ApJS 149,289
- (4) Bellazzini,M., Ferraro F.R., Pancino, E., 2001, ApJ 556, 635
- (5) Bellazzini M., Ferraro, F. Sollima A., Pancino, E., Origlia, L., 2004 A&A 424, 199-211
- (6) Bergmann M.P., Jorgensen I., Hill G., 2003, AJ 125, 116
- (7) Boissier S., Monniere Ragaigne D., Prantzos N., van Driel W., Balkowski C., O’Neil K., 2003, MNRAS 343, 653
- (8) Bressan, A., Fagotto, F., Bertelli, G., Chiosi C., 1993, A&AS 100,647
- (9) Chabrier G., 2003, PASP 115, 763
- (10) Cole, A.A., Tolstoy, E., Gallagher, J.S., Hoessel, J.G., Mould, J.R., et al. 1999, ApJ 118, 1657
- (11) de Blok W.J.G., Van der Hulst J.M., 1998, A&A 335,421
- (12) Dalcanton, J., Spergel, D., Summers, F., 1997, ApJ 482, 659
- (13) Diplas A. & Savage B.D., 1994, ApJ 427, 274
- (14) Dolphin A.E., 2000, PASP 112,1397
- (15) Ferrara A., Tolstoy E., 2000 MNRAS 313, 291
- (16) Gallagher J.S, Tolstoy E., Dohm-Palmer R.C., et al., 1998, AJ 115, 1869
- (17) Girardi L., Bressan A., Chiosi C., Bertelli G., Nasi E., 1996, A&AS 117, 113
- (18) Girardi L., Bressan A., Bertelli G., Chiosi C., 2000, A&AS 141, 371
- (19) Graham J.A., Phelps R.L., Freedman, W.L. et al., 1997, ApJ 477, 535
- (20) Harris, J.; Zaritsky, D., 2001, ApJS, 136,25
- (21) Hartmann D. & Burton W.B., 1997, Atlas of Galactic Neutral Hydrogen, Cambridge: Cambridge Univ. Press
- (22) Huchra J., 1977, ApJS 35, 171
- (23) Huchtmeier W.K., Karachentsev I.D., Karachentseva V.E., 2003, A&A 401, 483
- (24) Hunter D.A., Gallagher J.S., 1986, PASP 98, 5
- (25) Kennicutt R.C., 1992, ApJ 388, 310
- (26) Impey C., Bothun G., Ann Rev A&A 1997, 35
- (27) Kennicutt R.C., Tamblyn P. & Congdon C.E., 1994, ApJ 435, 22
- (28) Knezek P.M., 1993, PhD Thesis, University of Massachussets
- (29) Knezek P.M., Sembach K.R., Gallagher J.S.III, 1999, ApJ 514, 119
- (30) Kroupa P., 2001, MNRAS, 322, 231
- (31) Kroupa P., 2002, Sci, 295,p88
- (32) Kroupa P., Tout C.A., Gilmore G., 1993, MNRAS 262, 545
- (33) Lee M.G., Freedman W.L, Madore B.F., 1993, ApJ 417, 553
- (34) Lee H., Gibson B.K., Flynn C., Kawata D., b Beasley M.A., 2004, MNRAS, 1365, 246
- (35) Makarova L.N.& Karachentsev I.D, 1998, A&AS 133, 181
- (36) Marzke R.O. & da Costa L.N., 1997, AJ 113, 185
- (37) McGaugh S.S. & Blok W.J.G., 1997, ApJ 481, 689
- (38) McGaugh S.S. & Blok W.J.G., 1998, ApJ 499, 41
- (39) McLow M.M & Ferrara A., 1999, ApJ 513, 142
- (40) Ng Y.K., Bertelli G., Bressan A., Chiosi C., Lub J., 1995, A&A 295, 655
- (41) O’Neil K., Bothun G., 2000, ApJ 529, 811
- (42) O’Neil K., Bothun G., Schombert J., 1998, AJ 116, 2776
- (43) O’Neil K., Bothun G. D., Schombert J., 1997, AJ, 114, 2448
- (44) O’Neil K., Verheijen M.A.W., McGaugh, S.S., 2000, AJ 119, 2154
- (45) Padoan P., Jimenez R., Antonuccio-Delogu V., 1997, ApJ 481, L27
- (46) Persic, M.; Salucci, P., 1996, in Non-Accelerator Particle Physics, Proceedings of the Fourth School, held 17-28 July, 1995 at International Centre for Theoretical Physics, Trieste, Italy. Edited by E. Bellotti, R.A. Carrigan, Jr., G. Giacomelli, and N. Paver. Singapore: World Scientific, 1996., p.79
- (47) Prugniel P., Heraudeau P., 1998, A&AS 128, 299
- (48) Puche D., Westfahl D., 1994, IN ESO/OHP Workshop on Dwarf Galaxies, ED. G. Meylan & Prugniel (Garching, ESO), 273
- (49) Rizzi, L.; Held, E. V.; Bertelli, G.; Nasi, E.; Saviane, I.; Vallenari, A., 2002,in Observed HR Diagrams and Stellar Evolution, ASP Conference Proceedings, Vol. 274. Edited by T. Lejeune and J. Fernandes. San Francisco: Astronomical Society of the Pacific, 2002., p.490
- (50) Sandage A., Hoffman G.L, 1991, ApJ 379, L45
- (51) Schlegel D., J., Finkbeiner, P., Davis, M., 1998, ApJ 500, 525
- (52) Schombert, J. M.; Bothun, G. D.; Impey, C. D.; Mundy, L. G., 1990, AJ 100,1523
- (53) Simpson C.E., Gottesman S.T., 2000, AJ 120, 2975
- (54) Skillman E.D., Tolstoy E., Cole A.A., Dolphin A.E., Saha A., et al. 2003 ApJ 596, 253
- (55) Sprayberry D., Impey C.D., Irwin M.J., Bothun G.D., 1997, ApJ 482, 104
- (56) Turner A., 1996, Cooking with ALLFRAME
- (57) van den Hoek L.B., de Blok W.J.G., van der Hulst J.M., de Jong T., A&A 357, 397
- (58) van Zee L., Haynes M.P., Salzer J.J., 1997, AJ 114, 2479
- (59) Vicari A., Battinelli P., Capuzzo-Dolcetta R., Wyder T.K., Arrabito G., 2002, A&A 384, 24
- (60) Weidner C., Kroupa P., 2004, MNRAS 348, 187
- (61) Wyse R.F.G., Gilmore G., Houdashelt M.L., Feltzing S., h Hebb L., Gallagher J.S.III, Smecker-Hane T.A., 2002, New Astron 7, 395
- (62) Young, L.M. & Lo, K.Y., 1996, ApJ 462, 203