High Resolution Gratings Spectroscopy of GRBs 030382 and 041006 with Chandra LETGS
Abstract
We present high resolution X-ray spectroscopy of two recent GRB afterglows observed with the Low Energy Transmission Gratings on Chandra . The afterglows to GRBs 030328 and 041006 are detected beginning 15.33 and 16.8 hours after each burst, respectively, and are observed to fade in time during each ksec observation. We fit for the continuum emission in each full data set and for the data sliced into half and quarter time sections. For both afterglows, the continuum emission is well described by an absorbed power-law model, and the model parameters describing the absorption and spectral slope do not appear to evolve in time. We perform a careful search for deviations from the model continua for the full and time-sliced data and find no evidence for significant () narrow emission/absorption lines or edges. The lack of detections implies that line emission–if it is a general feature in GRB X-ray afterglows–occurs early ( days in the source frame) and/or is short-lived ( ksec). We also comment on synchrotron fireball models for the X-ray and optical data.
1 Introduction
One of the great puzzles in the study of -ray bursts (GRBs) is that of the X-ray afterglow lines. Claims of low to moderate significance emission lines have been made based on data from several missions: Fe lines have been detected in afterglow data from ASCA (Yoshida et al., 1999), Beppo-SAX (Piro et al., 1999; Antonelli et al., 2002), and Chandra (Piro et al., 2000); lines from highly ionized light, multiple- elements like Mg, Si, S, Ar, and Ca have been detected in afterglow data from XMM (Reeves et al., 2002; Watson et al., 2003) and Chandra (Butler et al., 2003). The detections are challenging to theorists because they typically imply large, concentrated masses of metals in the circumburst material (see, e.g., Lazzati, Campana, & Ghisellini, 1999) and a very efficient reprocessing of the non-thermal afterglow continuum into line radiation (see, Ballantyne & Ramirez-Ruiz, 2001; Lazzati, Ramirez-Ruiz, & Rees, 2002). For observers, the challenge is obtain significant and unambiguous detections or firm upper limits. Sako, Harrison, & Rutledge (2004) (see also, Rutledge & Sako, 2003) argue that the claims made to date lack the necessary significance needed to prove that the X-ray lines are real.
For a burst at , the Low Energy Transmission Gratings Spectrometer (LETGS) on Chandra (Weisskopf et al., 2002) provides peak sensitivity to H-like and He-like lines from Mg, Si, S, Ar, Ca, as well as sensitivity to common transitions in Ni, Co, Fe, C, N, O, and Ne. The spectral resolution ( for keV) makes possible the fine centroiding of lines and the determination of their shape. This in turn, potentially allows us to decide between different broadening mechanisms and to distinguish line emission from narrow RRCs (radiative recombination continua). Ideally, we could then infer the chemical composition, kinematics, reprocessing mechanism (e.g. recombination or fluorescence), and even the geometry of the circumburst emitting medium. Such were the motivations that led us to observe the afterglows to two recent GRBs detected by the High Energy Transient Explorer Satellite (HETE-2). Both were bright GRBs, in regions of the sky with little Galactic extinction.
2 Observations
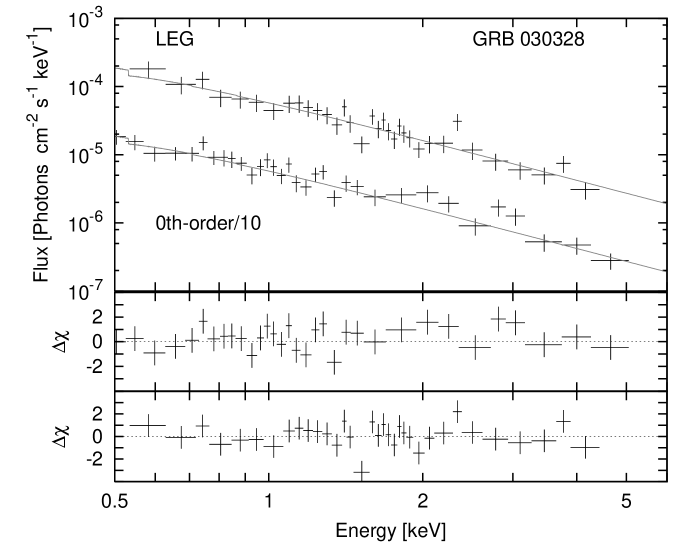
The bright, long-duration GRB 030328 was detected by HETE-2 at 11:20:58.34 UT, with a -ray fluence of approximately erg cm-2 (Villasenor et al., 2003; Atteia, 2003). Peterson & Price (2003) detected an uncatalogued optical source within the HETE-2 error region at R.A. , decl. (J2000.0). Chandra acquired this target 15.33 hours after the burst and observed with the LETGS/ACIS-S for 94 ksec (livetime) until 43.32 hours after the burst. The mean counting rate for the X-ray afterglow is 0.012 counts/s (summed over the dispersed signal from the LETGS, and including the 0th order flux). The count rate over the full observation decays with a slope (, Figure 1).
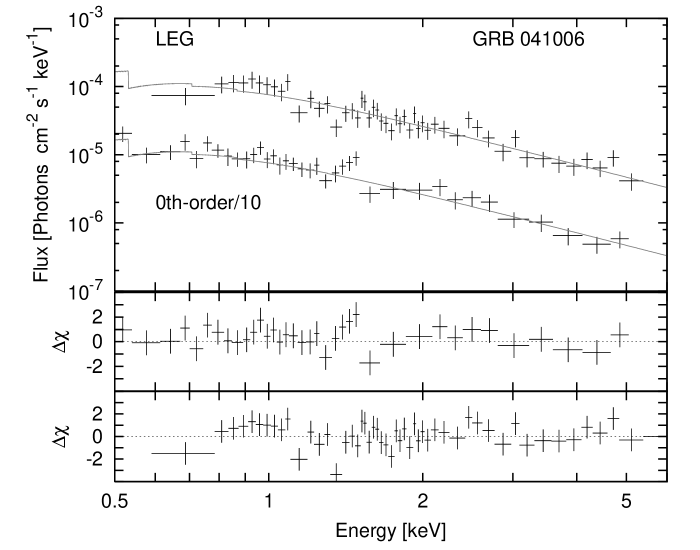
The bright, long-duration GRB 041006 was detected by HETE-2 at 12:18:08 UT, with a -ray fluence of approximately erg cm-2 (Galassi et al., 2004). Early optical observations by Da Costa, Noel, & Price (2004) revealed an optical afterglow at the coordinates: R.A. , decl. (J2000.0). This source was observed with the LETGS/ACIS-S on Chandra for 86.3 ksec (livetime), starting 16.8 hours after the burst and lasting until 42.57 hours after the burst. The coincident X-ray afterglow was detected with a mean counting rate of 0.017 counts/s. The source faded in brightness according to a power law, with a decay time slope of (). The lightcurves for GRB 030328 and GRB 041006 are plotted with the concurrent observations in the optical in Figure 1.
3 Data Reduction and Continuum Fits
We reduce the LETGS spectral data from the L1 event lists using the CIAO 3.2111http://cxc.harvard.edu/ciao/ processing tools. We use version 2.28 of the calibration database (CALDB), which includes corrections for the low energy quantum efficiency degradation. We extract the and 0th order LETGS spectra using the standard scripts. The 0th order data are extracted in circular regions, and backgrounds are extracted outside of these regions with care not to include counts from the dispersed spectra. Spectral fitting and analysis is performed with ISIS222http://space.mit.edu/CXC/ISIS/. We fit the 0th order and the combined order data for each afterglow jointly. The data are binned to a S/N per bin, and this restricts the energy coverage to the 0.5-5.0 keV band. We define S/N as the background-subtracted number of counts divided by the square root of the sum of the signal counts and the variance in the background. We fit each model by minimizing . All quoted errors are 90% confidence.
The GRB 030328 continuum is well fit () by a an absorbed power-law with photon index . The absorption column ( cm-2) is consistent with the anticipated Galactic value in the source direction ( cm-2; Dickey & Lockman, 1990). This model implies an average 0.5-8 keV unabsorbed flux of erg cm-2 s-1. The data are less well fit () by a thermal bremsstrahlung model with keV and Galactic absorption.
The GRB 041006 continuum is also well fit () by an absorbed power-law. The absorbing column ( cm-2) is larger than the Galactic value ( cm-2; Dickey & Lockman, 1990) at 99.9% confidence (, for 1 additional degree of freedom). The best-fit photon number index is . The model flux (unabsorbed, 0.5-8 keV) is erg cm-2 s-1. The data are less well fit () by a thermal bremsstrahlung model with keV and cm-2.
In order to test for spectral variability during each observation, we divide the spectra into half and quarter time regions containing approximately equal numbers of counts. As the number of counts per bin can be quite low–in violation of the assumption which allowed us to employ fitting above–we minimize the log of the Poisson probability , where is the number of source plus background counts in bin , is the source model evaluated for bin , is the background model, is the off-source background, which is scaled by an area factor . Rather than model the off-chip background, we average over the background parameters above for each spectral bin. This averaging results in the fit statistic:
We find that varying the model parameters which define the by minimizing yields best-fit values and error regions for the full data sets which are consistent with those found from fitting with background subtraction. Table 1 shows the results of our fits of the absorbed power-law models to the time-sliced data. For each GRB afterglow, the data are consistent with no spectral evolution.
4 Line Emission Upper Limits
In Table 2, we report upper limits on the source frame emission line equivalent widths and line fluxes for several common ionic species. The hosts of GRB 030328 and GRB 041006 have redshifts (Martini, Garnavich, & Stanek, 2003) and (Fugazza et al., 2004), respectively. We consider Gaussian lines of width eV in source frame. We allow the line centroids to vary by 15% from the source frame value during the fits, in order to allow for a possible blue- or redshift of the emitting material with respect to the burst source frame. The line associations are not intended to be unique, but only to span the detector energy range with a minimum of redundancy.
We note that there is a marginal (3.1 , Table 2) detection of an O_VIII line for GRB 030328. We do not regard this line as a serious candidate. At a detected energy of 0.27 keV, the line is present in only the order of the LETGS. We cannot confirm its presence in the order or the 0th order data. (In the line search below, we will not search out to such low energies.) The line is located on a region of the detector where the background dominates, and we cannot exclude the possibility that it is due to a background fluctuation. The implied luminosity and equivalent width are also quite large, and this would make it difficult to explain not detecting other emission lines.
5 Line Search
We search for emission and absorption lines in both the full and time-sliced data over the 0.5-8 keV band. Assuming the model continua from Table 1, we examine the order data at binnings 0.05,0.1,0.2,0.4,0.8 for deviations. The finest binning here is approximately equal to the detector resolution (FWHM). We set a threshold for positive or negative fluctuations. A single bin deviation of correspond roughly to a detection in 500 trials. Table 3 shows the 6 (5) candidates we find for GRB 030328 (GRB 041006) as well as refined significance estimates determined from fits of Gaussian lines to the combined 0th order and order data. We find no highly significant features.
6 Discussion
6.1 Lightcurves, Afterglow Synchrotron Modeling
The optical and X-ray lightcurves for GRB 030328 appear to fall off at a consistent rate beginning ksec (Figure 1a). The ratio of fluxes implies a broadband spectral slope , which is consistent with the slope measured in the X-ray band, (Section 3). If we associate the break at this time as due to a collimated jet (see, e.g., Frail et al., 2001), we can derive the true -ray energy release from the GRB. The relatively slow fade during the observation is explained as due to a hard distribution of synchrotron emitting electrons, with number index . For ksec, we find a jet opening angle of , and and beaming-corrected GRB fluence of erg. Here we use the formalism developed in Sari, Prian, & Halpern (1999), assuming a 20% efficiency for the conversion of kinetic energy into -rays and assuming a uniform circumburst density of 3 cm-3. Here and throughout we consider a flat cosmology with km s-1 Mpc-1 and .
The value of we derive is consistent with the value derived in Ghirlanda, Ghisellini, & Lazzati (2004), and it is in agreement with the “standard energy” of Bloom, Frail, & Kulkarni (2003). However, if we calculate the isotropic X-ray luminosity at hours, erg s-1, we find a number twenty times smaller than the X-ray standard energy of Berger, Kulkarni, & Frail (2003). The X-ray standard energy would require and days for this event. If the X-ray afterglow luminosities do cluster in general about a standard energy, the low flux may be telling us that the rapid light curve fade is due to a wind density profile and not a jet break. Spherical expansion into a wind medium would yield temporal and spectral indices consistent with those measured for (Chevalier & Li, 2000). Although the found above is not uncommon in GRB afterglows (see, e.g., Panaitescu & Kumar, 2002), a value of is favored for shock acceleration.
The lightcurve for GRB 041006 (Figure 1b) also shows a break at early times ( ksec). This may not be a jet break, because the fades after the break are gradual ( rather than t-2) and the energies we would infer, erg and erg s-1 (for ), are orders of magnitudes below the standard energies. The spectral slope in the X-rays (; Section 3) is consistent with the slope measured in the optical, (Garnavich, Zhao, & Pimenova, 2004; Williams et al., 2004). The broadband slope () is consistent with the X-ray slope, but it is more shallow than the optical slope. The X-ray flux is six times higher than would be expected from an extrapolation of the optical flux. This suggests that the X-ray spectrum is dominated by Inverse-Compton emission (Sari & Esin, 2001). That mechanism–or possibly continued energy injection from the GRB source–could also explain the apparently slower X-ray than optical fade (Figure 1b).
Host frame absorption may also be important, if we have under-estimated the flux in the optical. Because the synchrotron cooling break may lie between the optical and X-ray bands, the unabsorbed optical flux may have as shallow a slope as . Following Galama & Wijers (2001), we determine that this change in slope can be accomplished with a host-frame . The X-ray data require a column density in excess of the Galactic value (Section 3). If we place the excess column at the host, it is cm-2. For the Galactic relation (Predehl & Schmitt, 1995), we would expect a corresponding . Galama & Wijers (2001) found that such a discrepancy is common in GRB afterglows and may provide evidence for dust destruction. Finally, we note that the late-time optical afterglow (at days) is apparently brighter than the extrapolated flux shown in Figure 1b. Stanek et al. (2005) present the late time data and argue that the flux is dominated by an emerging supernova component.
6.2 Sensitivity of the Line Search
Figure 4 shows how the 90% confidence limits we derive for the line equivalent widths compare with those derived for emission lines claimed in the literature. If the claimed lines from the other observations had been present in our data for the full observations, we estimate that we would have detected all except for the faint GRB 020813 lines (Butler et al., 2003). Because the lines claimed in XMM data for several events (GRB 011211, Reeves et al. (2002); GRB 001025A, Watson et al. (2002); GRB 030227, Watson et al. (2003)) persisted for extremely short periods ( times shorter than the GRB 030328 or GRB 041006 observations, viewed in the host frame), our limits are not tight enough to rule them out. The Fe line observed in only ksec of Chandra HETGS data for a very bright GRB 991216 afterglow, would also likely not be detected in these LETGS observations.
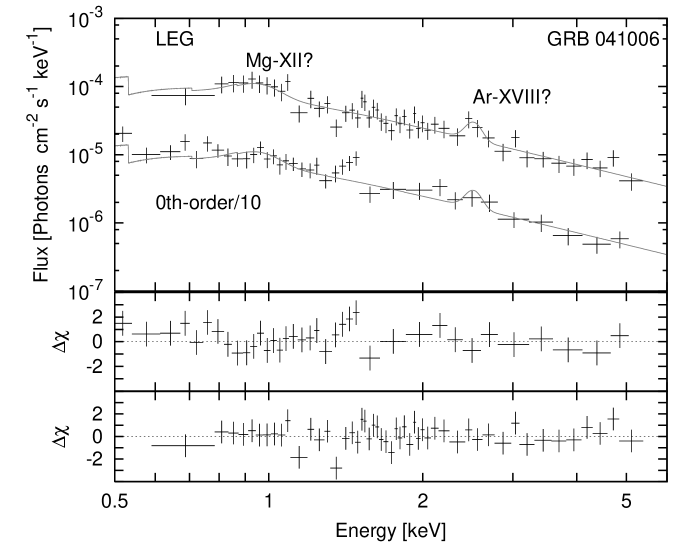
In the case of the lines detected in the XMM data for GRB 011211 and GRB 030227, the individual lines are not significant (), whereas the juxtaposition of multiple lines is moderately significant (). We explore the possibility of significant sets of emission lines by fitting for combinations of the candidates lines from Tables 2 and 3, for each time slice. We only consider initial energies from ions in Table 3 where a possible detection is better than 90% confidence (significance ). For the full data set, the addition of two of the candidate lines for GRB 041006 appears to improve the power-law fit at moderate significance (, , for 6 additional degrees of freedom). The lines would be associated with H-like Mg and Ar at , requiring a blue-shift of c from the host at . Additional lines do not improve the fit markedly. We find no evidence for additional significant line sets in the GRB 030328 or GRB 041006 full or time-sliced spectra. Due to the broadness of the lines in Figure 5 (, best fit), it is difficult to say whether the lines are real or whether the continuum is not adequately modelled. Such a degeneracy may also exist for the XMM multiple-line claims (GRB 0001025A, Watson et al. (2002), GRB 011211, Reeves et al. (2002); GRB 030227, Watson et al. (2003)), although the significance appears to be greater in those cases. In Butler et al. (2005), we show that the significance of the GRB 011211 lines depends strongly on whether or not the column density can be fixed at the Galactic value. For the XMM lines, we do not have the spectral resolution necessary to measure the breadth of the claimed lines in order to unambiguously separate the line emission from the continuum emission.
6.3 Comparison with Theoretical Predictions
The afterglow line emission (if it is real) is thought to be due to photoionization on the surface of optically thick slabs of metal-rich material surrounding the progenitor. For the “distant reprocessor” models (e.g., a “supranova;” Vietri & Stella, 1998), material from a precursor supernova (at cm) is excited by reflection of the afterglow continuum radiation. In the “nearby reprocessor” scenario, a long lived central engine (Rees & Mészáros, 2000) or a plasma bubble GRB (Mészáros & Rees, 2001) ionizes material on the sides of a funnel carved out of the progenitor star by the GRB (at cm). Ballantyne & Ramirez-Ruiz (2001) study the equivalent widths of Fe lines, for each scenario, as a function of the continuum luminosity. Roughly, they find that the the equivalent widths peak near 1 keV in each scenario for solar abundances and incident X-ray continuum luminosities of order erg s-1. Because the reflected continuum plus line emission must compete with the afterglow continuum emission at the observation epoch, this sets an upper limit on the observed equivalent widths. Gou, Mészáros, & Kallman (2004) employ a toy model based on this behavior to estimate the possible significance of future detections at various observation times for Swift , Chandra , and XMM . Here, we perform a similar exercise in order to better understand the GRB 030328 and GRB 041006 emission line upper-limits in the context of the previously claimed detections (Figure 6).
We assume that the equivalent widths increase to 1 keV with decreasing luminosity as , then decrease below erg s-1 as . For we assume the standard energy of Berger, Kulkarni, & Frail (2003) at hours in the source frame. This decreases as until the jet break at , whence the flux starts decreasing more rapidly as . We account for the diversity in observed continuum fluxes and break times in terms of a range of jet opening angles , where we set . Two of the resulting models are shown in Figure 6. At a given redshift, the narrowly beamed event would be observed to have a higher continuum flux due to the increased beaming. In Figure 6, we plot the Fe line equivalent widths derived here and from other Chandra observations. We also plot the equivalent widths of detected light metal and Fe lines quoted in the literature. The fluxes from the light metal lines can equal the Fe line flux when the reflecting material is less ionized (Lazzati, Ramirez-Ruiz, & Rees, 2002). A similar relation arises if the light metal line emission systematically arises at smaller radii than does the Fe line emission, as suggested by Lazzati, Ramirez-Ruiz, & Rees (2002).
Aside from the values for GRB 020813 and GRB 030227, the detected line values lie well above the model predictions. The events with measured values are narrowly jetted events, for which the at early times is expected to be low. The values can be larger by a factor of ten or so at early times if the photoionization in the nearby reprocessor scenario occurs for very shallow incidence angles (Kallman, Mészáros, & Rees, 2003) or if the reflecting material has ten times solar abundances (as for GRB 011211; Reeves et al., 2002). Such mechanisms must be invoked to justify the line claims. This is not necessarily the case, however, for the Fe line upper limits derived here and for GRB 020205 (Chandra/LETGS; Mirabal, Paerels, & Halpern, 2003) and GRB 021004 (Chandra/HETGS; Butler et al., 2003). These events apparently span a broad range of jet opening angles from to (Figure 6). We can conclude from this that potentially unusual conditions in the line-emitting material (e.g. supersolar abundances) are likely as important or more important for line production than is the strength of the continuum at the observation epoch. Finally, although selection on bright and slowly fading bursts would tend to select possibly less interesting low-redshift events, the potentially high values make them appealing. Early observations of many such events by Swift may constitute our best hope for building up statistics and for solving the mystery of X-ray afterglow line emission.
7 Conclusions
Beyond a power-law decay in flux versus time, the Chandra LETGS spectra for the X-ray afterglows to GRBs 030328 and 041006 do not appear to evolve in time. We find little evidence for discrete emission features–emission or absorption lines, narrow recombination edges, etc.–in these two high resolutions gratings observations.
The number of sensitive non-detections of line emission in gratings observations with Chandra is growing. If line emission is a general feature in GRB X-ray afterglows, then the LETGS observations of GRB 030328 and GRB 041006 discussed here–alongside the LETGS observation of GRB 020405 (Mirabal, Paerels, & Halpern, 2003) and the HETGS observation of GRB 021004 (Butler et al., 2003)–imply that the emission must occur early (prior to days in the source frame) and/or be short-lived ( ksec). Early emission would favor the nearby reprocessor scenario and one-step explosions (e.g. a hypernova; Woosley, 1993). Sporadic or short-lived emission would imply a persistent and erratic central engine or a clumpy circumburst medium.
References
- Andersen, Masi & Jensen (2003) Andersen, M. I., Masi, G., & Jensen, B. L. 2003 GCN#1993
- Antonelli et al. (2002) Antonelli, L. A., et al. 2000, ApJ, 545, L39
- Atteia (2003) Atteia, J.-L. 2003, A&AS, 407, L1
- Ayani & Yamaoka (2004) Ayani, K., & Yamaoka, H. 2004, GCN#2779
- Ballantyne & Ramirez-Ruiz (2001) Ballantyne, D. R., & Ramirez-Ruiz, E. 2001, ApJ, 559, L83
- Bartolini et al. (2003) Bartolini, C., et al. 2003 GCN#2008
- Berger, Kulkarni, & Frail (2003) Berger, E., Kulkarni, S. R., & Frail, D. A. 2003, ApJ, 590, 379
- Bloom, Frail, & Kulkarni (2003) Bloom, J. S., Frail, D. A., & Kulkarni, S. R. 2003, ApJ, 594, 674
- Burenin et al. (2003) Burenin, R., et al. 2003, GCN #1990
- Butler et al. (2003) Butler, N., et al. 2003, ApJ, 597
- Butler et al. (2005) Butler, N., et al. 2005, ApJ-submitted
- Chevalier & Li (2000) Chevalier, R. A., & Li, Z.-Y. 2000, ApJ, 536, 195
- D’Avanzo et al. (2004) D’Avanzo, P. et al. 2004, GCN#2788
- Da Costa, Noel, & Price (2004) Da Costa, G., Noel, N., & Price, P. A. 2004, GCN #2765
- Dickey & Lockman (1990) Dickey, J. M., & Lockman, F. J. 1990 ARAA, 28, 215
- Ferrero et al. (2004) Ferrero, P., et al. 2004, GCN#2777
- Fugazza et al. (2003) Fugazza, D., et al. 2003, GCN #1982
- Frail et al. (2001) Frail, D. A., et al. 2001, ApJ, 562, L55
- Fugazza et al. (2004) Fugazza, D., et al. 2004, GCN #2782
- Fynbo et al. (2004) Fynbo, J. P. U., et al. 2004, GCN#2802
- Galama & Wijers (2001) Galama, T. J., & Wijer, R. A. M. J. 2001, ApJ, 549, L209
- Galassi et al. (2004) Galassi, M., et al. 2004, GCN #2770
- Gal-Yam et al. (2003) Gal-Yam, A., et al. 2003, GCN #1984
- Garnavich, Martini, & Stanek (2003) Garnavich, P., Martini, P., & Stanek, K. Z. 2003 GCN#2036
- Garnavich, Zhao, & Pimenova (2004) Garnavich, P., Zhao, X., & Pimenova, T. 2004, GCN#2792
- Ghirlanda, Ghisellini, & Lazzati (2004) Ghirlanda, G., Ghisellini, G., & Lazzati, D. 2004, ApJ, 616, 331
- Gou, Mészáros, & Kallman (2004) Gou, L. J., Mészáros, P., & Kallman, T. R. (2004), astro-ph/0408414
- Greco et al. (2004) Greco, G., et al. 2004, GCN#2804
- Ibrahimov et al. (2003) Ibrahimov, M. A., et al. 2003 GCN#2192
- Kahharov et al. (2004) Kahharov, B., et al. 2004, GCN#2775
- Kallman, Mészáros, & Rees (2003) Kallman, T., Mészáros, P., & Rees, M. J. 2003, ApJ, 593, 946
- Kinoshita et al. (2004) Kinoshita, D., et al. 2004, GCN#2785
- Kinugasa & Torii (2004) Kinugasa, K., & Torii, K. 2004, GCN#2832
- Lazzati, Campana, & Ghisellini (1999) Lazzati, D., Campana, S., & Ghisellini, G. 1999, MNRAS, 304, L31
- Lazzati, Ramirez-Ruiz, & Rees (2002) Lazzati, D., Ramirez-Ruiz, E., & Rees, M. J. 2002, ApJ, 572, L57
- Martini, Garnavich, & Stanek (2003) Martini, P., Garnavich, P., & Stanek, K. Z., 2003, GCN #1979
- Mészáros & Rees (2001) Mészáros, P., & Rees, M. J. 2001, ApJ, 556, L37
- Mirabal, Paerels, & Halpern (2003) Mirabal, N., Paerels, F., & Halpern, J. P. 2003, ApJ, 587, 128
- Misra & Pandey (2004) Misra, K., & Pandey, S. B. 2004, GCN#2794
- Monfardini et al. (2004) Monfardini, A., et al. 2004, GCN#2790
- Panaitescu & Kumar (2002) Panaitescu, A., & Kumar, P. 2002, ApJ, 571, 779
- Peterson & Price (2003) Peterson, B. A., & Price, P. A. 2003, GCN #1974
- Piro et al. (1999) Piro, L., et al. 1999, A&AS, 138, 431
- Piro et al. (2000) Piro, L., et al. 2000, Science, 290, 955
- Predehl & Schmitt (1995) Predehl, P., & Schmitt, J. H. M. M. 1995, A&AS, 293, 889
- Price, Da Costa, & Noel (2004) Price, P. A., Da Costa, G., & Noel, N. 2004, GCN#2771
- Rees & Mészáros (2000) Rees, M. J., & Mészáros, P. 2000, ApJ, 545, L73
- Reeves et al. (2002) Reeves, J. N., et al. 2002, Nature, 415, 512
- Rumyantsev, Biryukov, & Pozanenko (2003) Rumyantsev, V., Biryukov, V., & Pozanenko, A. 2003 GCN#1991
- Rumyantsev, Biryukov, & Pozanenko (2004) Rumyantsev, V., Biryukov, V., & Pozanenko, A. 2004, GCN#2798
- Rutledge & Sako (2003) Rutledge, R., & Sako, M. 2003, MNRAS, 339, 600
- Sako, Harrison, & Rutledge (2004) Sako, M., Harrison, F., & Rutledge, R. (2004), astro-ph/0406210
- Sari, Prian, & Halpern (1999) Sari, R., Prian, T., & Halpern, J. P. 1999, ApJ, 519, L17
- Sari & Esin (2001) Sari, R., & Esin, A. A. 2001, ApJ, 548, 787
- Schlegel, Finkbeiner, & Davis (1998) Schlegel, D. J., Finkbeiner, D. P., & Davis, M. 1998, ApJ, 500, 525S
- Stanek et al. (2005) Stanek, K. Z., et al. 2005, ApJ-submitted, astro-ph/0502319
- Vietri & Stella (1998) Vietri, M., & Stella, L. 1998, ApJ, 507, L45
- Villasenor et al. (2003) Villasenor, J., et al. 2003, GCN #1978
- Watson et al. (2002) Watson, D., et al. 2002, A&A, 393, L1
- Watson et al. (2003) Watson, D., et al. 2003, ApJ, 595, L29
- Williams et al. (2004) Williams, G., et al. 2004, GCN#2830
- Woosley (1993) Woosley, S. E. 1993, ApJ, 405, 273
- Weisskopf et al. (2002) Weisskopf, M. C., et al. 2002, PASP, 114, 1
- Yoshida et al. (1999) Yoshida, A., et al. 1999, A&AS, 138 433
- Yost et al. (2004) Yost, S. A., et al. 2004, GCN#2776
| GRB 030328 | |||
|---|---|---|---|
| ( cm-2) | Time Coverage (ksec) | ||
| half 1 | 00.0-29.8 | ||
| half 2 | 29.8-92.7 | ||
| quarter 1 | 00.0-12.4 | ||
| quarter 2 | 12.4-29.8 | ||
| quarter 3 | 29.8-55.4 | ||
| quarter 4 | 55.4-92.7 | ||
| GRB 041006 | |||
| ( cm-2) | Time Coverage (ksec) | ||
| half 1 | 00.0-33.8 | ||
| half 2 | 33.8-86.3 | ||
| quarter 1 | 00.0-14.9 | ||
| quarter 2 | 14.9-33.8 | ||
| quarter 3 | 33.8-57.6 | ||
| quarter 4 | 57.6-86.3 |
| GRB 030328 | ||||
|---|---|---|---|---|
| Ion | (keV) | ( erg s-1) | EW (eV) | Signif. |
| Ni_XXVIII | 8.073 | |||
| Fe_XXVI | 6.952 | |||
| Fe_XXIV | 6.400 | |||
| Ca_XX | 4.100 | |||
| Ar_XVIII | 3.318 | |||
| S_XVI | 2.612 | |||
| Si_XIV | 2.000 | |||
| Mg_XII | 1.472 | |||
| Na_XI | 1.236 | |||
| Ne_X | 1.022 | |||
| O_VIII | 0.653 | |||
| GRB 041006 | ||||
| Ion | (keV) | ( erg s-1) | EW (eV) | Signif. |
| Ni_XXVIII | 8.073 | |||
| Fe_XXVI | 6.952 | |||
| Fe_XXIV | 6.400 | |||
| Ca_XX | 4.100 | |||
| Ar_XVIII | 3.318 | |||
| S_XVI | 2.612 | |||
| Si_XIV | 2.000 | |||
| Mg_XII | 1.472 | |||
| Na_XI | 1.236 | |||
| Ne_X | 1.022 | |||
| O_VIII | 0.653 | |||
| N_VII | 0.500 |
Note.—Rest-frame flux () and source frame equivalent width (EW) upper limits are on and EW are 90% confidence.
| GRB 030328 | ||||||
| Assoc. | z | Signif. | EW | Region | ||
| (keV) | (keV) | ( erg s-1) | ||||
| 2.345 | Fe_XXIV | 1.729 | 290 | 2.5 | half2 | |
| 0.561 | Mg_XII | 1.623 | 90 | 3.3 | half2 | |
| 0.727 | Si_XIV | 1.751 | 180 | 17.0 | qtr1 | |
| 2.389 | Fe_XXIV | 1.679 | 430 | 4.5 | qtr3 | |
| 0.721 | Si_XIV | 1.774 | 100 | 2.8 | qtr3 | |
| 0.538 | Mg_XII | 1.736 | 240 | 10.0 | qtr3 | |
| GRB 041006 | ||||||
| Assoc. | z | Signif. | EW | Region | ||
| (keV) | (keV) | ( erg s-1) | ||||
| 0.993 | Mg_XII | 0.482 | 110 | 1.6 | full | |
| 2.300 | Ca_XX | 0.783 | 170 | 0.8 | half2 | |
| 2.146 | Ar_XVIII | 0.546 | 240 | 3.0 | qtr1 | |
| 0.558 | Ne_X | 0.832 | 210 | 6.4 | qtr2 | |
| 0.543 | Ne_X | 0.882 | 170 | 3.3 | qtr3 |
Note.—Significances (“Signif.”) estimated from , assuming a distribution with .