Different Characteristics of the Bright Branches
of the Globular Clusters M3 and M13
Abstract
We carried out wide-field CCD photometric observations of the globular clusters M3 (NGC 5272) and M13 (NGC 6205) using the Bohyun Optical Astronomy Observatory 1.8-m telescope equipped with a SITe 2K CCD. We present color-magnitude diagrams ( vs. , vs. , and vs. ) of M3 and M13. We have found asymptotic giant branch (AGB) bumps at = 14.85 0.05 mag for M3 at = 14.25 0.05 mag for M13. It is found that AGB stars in M3 are more concentrated near the bump, while those in M13 are scattered along the AGB sequence. We identified the red giant branch (RGB) bump of M3 at = 15.50 0.05 mag and that of M13 at = 14.80 0.05 mag through luminosity functions and slope changes of the integrated luminosity functions of M3 and M13. We have estimated the ratios and for M3 and M13 and found that the value of for M3 is larger than that for M13 while values of for M3 and M13 are similar and compatible with the value expected from evolutionary theory when only normal horizontal branch (HB) stars are used for estimation of and for M13. However, we found that values of for M3 and M13 are similar while the value of for M3 is larger than that for M13 when all the HB stars are included for estimation of and for M13. We have compared the observed RGB luminosity functions of M3 and M13 with the theoretical RGB luminosity function of Bergbusch & VandenBerg at the same radial distances from the cluster centers as used in the estimation of the ratios and for M3 and M13. We found “extra stars” belonging to M13 in the comparison of the observed RGB luminosity function of M13 and the theoretical RGB luminosity function of Bergbusch & VandenBerg and even in the comparison of the observed RGB luminosity functions of M3 and M13. In the original definition of the ratio of Buzzoni et al., corresponds to the lifetime of HB stars in the RR Lyrae instability strip at log = 3.85. So, the smaller value resulting for M13 compared with that for M3 in the case where only normal HB stars are included in the estimation of and for M13 may be partially caused by “extra stars”, and the similar values for M3 and M13 in the case where the all HB stars are included in the estimation of and for M13 may be caused by “extra stars” in the upper RGB of M13. If “extra stars” in the upper RGB of M13 are caused by an effective “deep mixing” these facts support the contention that an effective “deep mixing” could lead to different HB morphologies between M3 and M13 and subsequent sequences.
1 Introduction
The globular clusters (GCs) M3 (NGC 5272) and M13 (NGC 6205) are a famous second parameter GC pair which have nearly the same metallicity [Fe/H] 1.49 0.14 (e.g., Kraft et al. 1992; Sneden et al. 2004) but possess different horizontal branch (HB) morphology. M3 has both red HB (RHB) stars and blue HB (BHB) stars including RR Lyrae stars which fill the instability region of the HB sequence (Sandage 1953; Buonanno et al. 1994; Ferraro et al. 1997a), while M13 has predominantly BHB stars which extend below the main sequence turnoff (MSTO) point. There are some gaps along the BHB star sequence and the cluster has some RR Lyrae stars but no RHB stars (Arp & Johnson 1955; Savedoff 1956; Paltrinieri et al. 1998).
The relative age difference between M3 and M13 was suggested as a second parameter which controls the HB morphology difference between M3 and M13 (Rey et al. 2001), although some researchers argue that the age difference between M3 and M13 is too small to explain the HB morphology difference (Paltrinieri et al. 1998; Salaris & Weiss 2002). It is suggested by Sweigart (1997) that “deep mixing” could cause the difference in HB morphologies if the “deep mixing” in two GCs has occurred to different degrees. Cavallo & Nagar (2000) suggested that deep mixing, which effectively occurred in M13 but not in M3, is a “blue-tail second parameter” of M3 and M13, although Smith (2002) argued that deep mixing also occurred in M3 using the merged data sets of the 3883 CN band strength of red giant stars of M3. However Moehler et al. (2003) could not confirm that the “helium mixing” scenario is a definite explanation for the origin of the blue HB tail in M13. Moreover Caloi (2001) argued that there is no evidence for a substantial increase in the surface helium content of HB stars of M3 and M13, which contradicts the deep mixing and chemical inhomogeneities of the red giant branch (RGB) stars of M13, and argued that the most peculiar giants may belong to the asymptotic giant branch (AGB) stars. However, we should note that we cannot directly measure helium abundances of late-type stars (RGB and AGB stars, main sequence stars, and normal HB stars) of GCs and that hot BHB stars in GCs show deficient helium abundances (Heber et al. 1986 and Moehler, Heber, & Rupprecht 1997 for NGC 6752; Behr et al. 1999 for M13; Behr, Cohen, & McCarthy 2000 for M15; Behr 2003 for M3, M13, M15, M68, M92, and NGC 288) due to helium diffusion (Greenstein, Truran, & Cameron 1967; Michaud, Vauclair, & Vauclair 1983).
AGB stars of GCs are evolved from HB stars and may reflect the different characteristics of the HB stars of a given GC. However, the number of AGB stars in a given GC is small due to the short lifetime of the AGB state and the separation of AGB stars from RGB stars in a given GC was not easily distinguished in previous photometric studies of GCs. Therefore, little attention has been paid to the AGB stars of GCs so far. We carried out wide-field CCD photometric observations of M3 and M13 in order to obtain a sufficient number of AGB stars accurately separated from RGB stars and to discover the different characteristics of all bright branches in M3 and M13 which may reveal clues as to the second parameter of M3 and M13. Here we present preliminary photometric results for the central 117 117 regions of M3 and M13.
In 2 we present observations and data reduction for M3 and M13, and in 3 we present color-magnitude diagrams (CMDs) of these clusters. In 4 we report identification of the RGB bumps of M3 and M13, and in 5 we present population ratios for the bright branches of M3 and M13. In 6 we compare the observed RGB luminosity functions of M3 and M13 with the theoretical RGB luminosity function of Bergbusch & VandenBerg (2001), and in 7 we present a summary.
2 Observations and Data Reduction
CCD observations of the central 117 117 regions of M3 and M13 and three of Landolt’s (1992) standard regions were made using the Bohyun Optical Astronomy Observatory (BOAO) 1.8-m telescope (f/8) during three continuous photometric nights between May 10 and May 12, 2001. The detector attached to the Cassegrain focus of the telescope was a SITe 2048 2048 CCD with a gain of 1.8 electrons ADU-1 and readout noise of 7 electrons. The pixel size of the CCD is 24 square and the pixel scale is 0344 pixel-1 covering a 117 117 region of the sky. The observational log of M3 and M13 is summarized in Table 1.
Preprocessing including bias subtraction scaled to overscan regions, trimming of useless sections, flat fielding in each filter, and cosmic ray rejection of CCD frames were carried out using an IRAF/CCDRED package.
Standardization of photometric systems was made using three Landolt’s (1992) standard regions: SA 107 (centered near star 107-595), PG 1633099, and PG 1323086. Photometry of stars in the object frames of M3 and M13 was carried out using the IRAF version of DAOPHOT (Stetson, Davis, & Crabtree 1990) via the point spread function fitting method which is used for crowded field photometry.
Detailed standardization and reduction procedures will be published in the next paper with results for 20 20 regions of M3 and M13.
3 Color-Magnitude Diagrams
3.1 M3
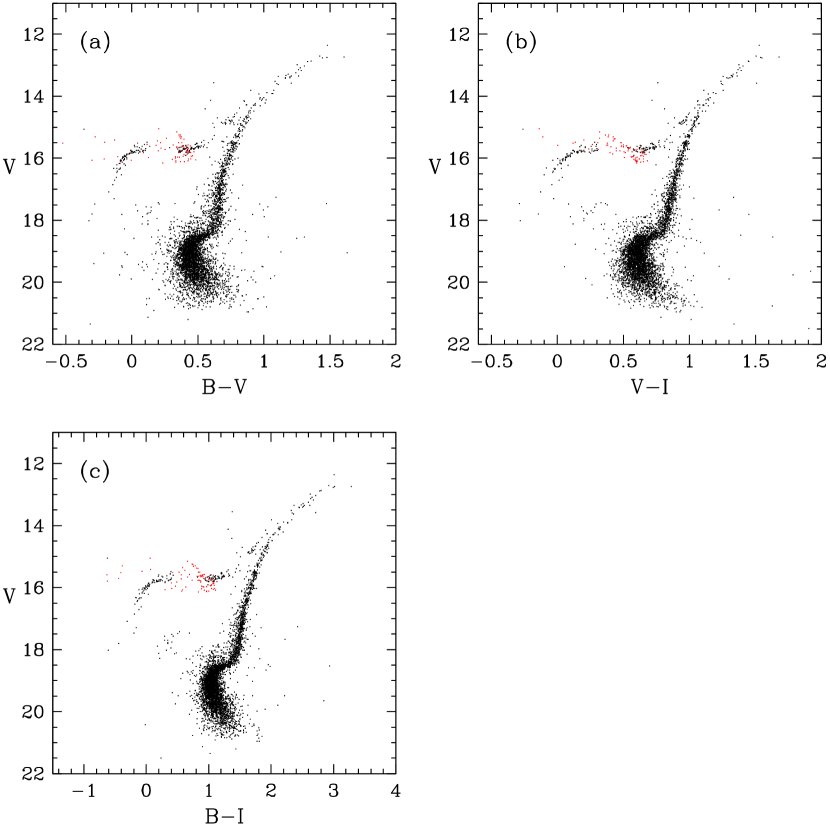
CMDs of M3 using color-magnitude data matched in all 3 bands are shown in Figure 1. Owing to severe crowding, stars within a projected distance from the cluster center 143 were excluded and so the total number of stars plotted in the CMDs is 4834.
Since there is a possibility that the zero points in the magnitude and color of M3 are not sufficiently accurate, possibly due to fluctuating sky conditions at BOAO, we examined the zero point offsets in the magnitude and color of M3 by comparing mean fiducial sequences of our original CMDs and recent studies. We then shifted the zero point offsets in magnitude and color from our original CMD data. For the versus CMD, the comparison of mean fiducial sequences was made between our CMD and Rey et al.’s (2001) and for the versus CMD, it was conducted between our CMD and Johnson & Bolte’s (1998). According to these comparisons, the zero point offsets are = 0.15 0.03 mag, () = 0.155 0.005 mag, and () = 0.075 0.005 mag, where is in the sense of our study minus the other study. According to these comparisons () is 0.230 0.007 mag. Thus the CMDs of M3 in Figure 1 are zero point-shifted CMDs according to the zero point offsets in magnitude and color from the original CMDs of M3.
The internal photometric errors in magnitude and color have been estimated by the photometric errors derived by DAOPHOT. According to these estimates , (), (), and () are 0.01 mag down to 17.85 mag, and and () are 0.02 mag, () and () 0.03 mag from 17.85 mag down to 19.35 mag, then increases continuously up to 0.05 mag, (), (), and () increase to 0.08 mag from 19.35 mag to 20.65 mag.
The characteristics of the CMDs of M3 presented in Figure 1 are as follows. First, the separation between RGB and AGB stars is clearer and the photometric accuracy of bright branch stars is greater than any other previous photometric studies of M3. Second, the AGB and RGB sequences are clearly separated best in the versus CMD among the three kinds of CMD in Figure 1. AGB stars are concentrated near the AGB bump. Third, stars are largely distributed along the RR Lyrae instability strip and some stars are found below the level of the ZAHB (Zero Age Horizontal Branch) in both the RHB and the BHB. When 84 known RR Lyraes (Clement et al. 2001) are identified from the observed field, these latter stars are found to be those in the CMDs in Figure 1 which are represented as red points. So, these stars which are found below the level of ZAHB in both the RHB and the BHB are RR Lyrae variable stars in their close minimum or minimum pulsational stages in terms of their magnitude.
3.2 M13
The CMDs of M13 using color-magnitude data matched in all 3 bands are shown in Figure 2. Owing to severe crowding, stars within a projected distance from the cluster center 143 were excluded and so the total number of stars plotted in the CMDs is 7056.
As in the case of M3 there is a possibility that the zero points in the magnitudes and colors of M13 are not accurate, possibly due to the fluctuating sky conditions at BOAO, so we examined the zero point offsets in the magnitude and color of M13. This was conducted by comparing mean fiducial sequences of the original CMDs and recent studies and shifting the zero point offsets in magnitude and color from our original CMD data. For the versus CMD the comparison of mean fiducial sequences was made between our CMD and Rey et al.’s (2001) and for the versus CMD it was made between our CMD and Johnson & Bolte’s (1998). According to these comparisons, the zero point offsets are = 0.10 0.03 mag, () = 0.060 0.005 mag, and () = 0.020 0.005 mag, where is in the sense of our study minus the other study. Therefore, we have () = 0.040 0.007 mag. Thus, the CMDs of M13 in Figure 2 are zero point-shifted CMDs according to the above zero point offsets in magnitude and color from the original CMDs of M13.
The internal photometric errors in magnitude and color have been estimated by photometric errors derived by DAOPHOT. We have found , (), (), and () are 0.01 mag down to 16.60 mag, and and () are 0.02 mag, () and () 0.03 mag from 16.60 mag down to 18.10 mag, then increases continuously up to 0.07 mag, (), (), and () increase to 0.10 mag from 18.10 mag to 20.35 mag.
The characteristics of the CMDs of M13 presented in Figure 2 are as follows. First, the BHB, RGB, AGB, and main sequences are well populated from the RGB tip to about 2.0 mag below the MSTO. Second, the RGB and AGB stars are clearly separated and they are distinguished best in the versus CMD. AGB stars are scattered along the AGB sequence. Third, a few stars at the RGB tip tend slightly to the redder and fainter direction. Last, BHB stars are well populated down to the MSTO and there are at least two gaps along the BHB sequence.
4 The RGB Bump
We examined the existence of RGB bumps in M3 and M13, and identified the location of RGB bumps in M3 and M13 through the standard method described in Fusi Pecci et al. (1990) from versus CMDs of Figure 1a in the case of M3 and Figure 2a in the case of M13.
The method for detecting RGB bumps of M3 and M13 is as follows. From the versus CMDs of M3 and M13 we first rejected clear HB and AGB stars to accelerate the procedure of rejection of non-RGB stars from the RGB sequences. Then, we divided the RGB stars of M3 and M13 into bins of size 0.25 mag. In order to reject outlying field stars we calculated the mean and standard deviation of each bin and rejected stars lying outside of 2.5 of the mean value of each bin. We recalculated the mean and standard deviation of each bin for which the outlying field stars were rejected according to the 2.5 rejection criterion, and rejected further stars lying outside of the new 2.5 of the new mean value of each bin and iterated these procedures several times until the mean and standard deviation of each bin converged. After rejecting the outlying field stars along the RGB sequences of M3 and M13, we constructed integrated luminosity functions and differential luminosity functions of RGB sequences in bins of size 0.05 mag. From these luminosity functions we identified the RGB bump where the peak in the differential luminosity function and the slope change in the integrated luminosity function coincide.
The integrated luminosity function and the differential luminosity function of M3 are shown in Figure 3. Figure 3 shows that the position of the RGB bump of M3 is = 15.50 0.05 mag, which is in good agreement with the value 15.45 0.05 mag of Ferraro et al (1999). The integrated luminosity function and the differential luminosity function of M13 are shown in Figure 4. They show that the position of the RGB bump of M13 is = 14.80 0.05 mag. This bump position is slightly fainter than the 14.70 0.05 mag determination of Bono et al. (2001) but is in good agreement with the 14.75 0.07 mag value of Ferraro et al. (1999). In Figures 3 and 4 arrows indicate RGB bump positions and the dotted lines in the integrated luminosity functions indicate slope changes above and below the RGB bump positions.
5 Population Ratios
We calculated the population ratios (= /), and (= /) for M3 and M13 using their versus CMDs in Figures 1c and 2c for M3 and M13, respectively, in which AGB and RGB sequences are the most clearly separated from each other among the three kinds of CMD. Here, is the number of normal HB stars including BHB stars, RR Lyrae variable stars, and RHB stars, and is the number of RGB stars brighter than the mean luminosity level of HB stars (= ), and is the number of AGB stars which are brighter than the AGB bump position. In order to obtain population ratios and from complete samples of M3 and M13, we removed the stars with a projected distance from the cluster center smaller than given values. In the case of M3 stars, they are complete down to = 17.65 mag when 26 and complete down to = 19.00 mag when 32 due to severe crowding in the cluster center region. Since in M3 = 17.65 mag is fainter than the normal HB level ( = 16.75 mag) and the RGB magnitude limit, which includes all the RGB stars used in the ratio ( 16.01 0.07 mag) and the RGB luminosity function ( 17.53 mag) in 6, we removed stars with 26 in the derivation of the population ratios and for M3. According to Harris (1996), the half-mass radius () of M3 is 112 and = 26 corresponding to 232. In the case of M13, stars are complete down to = 16.00 mag (luminosity level of the first gap in the BHB of M13) when 25 and complete down to = 19.00 mag when 32 due to severe crowding in the cluster center region. Since in M13 hot BHB stars extend down to 19.00 mag and we also consider the population ratios and , which include all the HB stars of M13, we removed stars with 32 in the derivation of the population ratios and of M13. According to Harris (1996), of M13 is 149 and = 32 corresponds to 215.
The AGB bump positions of M3 and M13 are indicated by horizontal arrows in Figures 5 and 6, respectively, and the positions are = 14.85 0.05 mag for M3 and = 14.25 0.05 mag for M13. However, AGB stars in M3 are more concentrated near the bump and show a slightly slanted AGB sequence above RGB, while AGB stars in M13 are less concentrated near the bump and show a scattered AGB sequence above RGB. These AGB features of M3 and M13 are consistent with the theoretical predictions by Castellani, Chieffi, & Pulone (1991). According to their Figure 9 which shows the comparison between theoretical evolutionary tracks of HB and AGB stars for = 0.001 and the CMD of M5 whose metallicity ([Fe/H] = 1.13) is known to be close to the metallicities of M3 and M13, HB stars whose mass range is appropriate for the HB stars of M3 produce a redder and tighter AGB sequence than those HB stars whose mass range is appropriate for the HB stars of M13, which create a bluer and relatively wider AGB sequence. AGB stars brighter than AGB bumps are enclosed by small open circles in Figures 5 and 6 for M3 and M13, respectively. According to Figure 5 in the CMD of M3, AGB stars are separated from the RGB starting from the AGB bump position up to 0.5 mag below the RGB tip of M3, and according to Figure 6 in CMD of M13, AGB stars are separated from the RGB starting from the AGB bump position up to 1.0 mag below the RGB tip of M13. We have found that the total number of AGB stars of M3 is 30 and that of M13 is 24. So, of M3 is 15 in the 26 range and of M13 is 9 in the 32 range, respectively.
In order to calculate population ratios we must know (mean luminosity level of HB), (differential bolometric correction between at log = 3.85 and RGB at the level). Since the metallicities of M3 and M13 are nearly the same, we assumed equal for M3 and M13. We took two kinds of value of from other studies. One is = 0.11 mag from Ferraro et al. (1997a) and the other is = 0.29 mag from Sandquist (2000). Ferraro et al. (1997a) adopted = 0.11 mag from private communication with O. Straniero. Sandquist (2000) adopted = 0.29 mag from the fitting formula:
| (1) |
where [M/H] is the -element enhanced global metallicity of GCs and he adopted a constant value [/Fe] = +0.3 for -element enhancement of GCs. Sandquist (2000) derived the above fitting formula using the HB models of Dorman (1992) in conjunction with the isochrones of Bergbusch & VandenBerg (1992).
In the case of , we calculated of M3 first and derived of M13 by matching the AGB bumps and RGB bumps of M3 and M13 because M13 has no RHB stars and is known to have only nine RR Lyrae variable stars (Preston, Shectman, & Beers 1991; Kopacki, Kołaczkowski, & Pigulski 2003). For M3, was calculated from 22 stars from the BHB edge region [0.005 () 0.100 and 15.475 15.880] and 34 stars from the RHB edge region [0.345 () 0.465 and 15.475 15.850] excluding RR Lyrae variable stars. in the BHB edge region is BE = 15.732 0.080 mag and that in the RHB edge region is RE = 15.716 0.063 mag and the total average is = 15.72 0.07 mag. We adopted = 0.70 mag to derive the mean HB level of M13 assuming the same intrinsic mean HB levels in both clusters, for which the magnitude difference is found between the RGB bumps of M3 and M13 in this study. Then the BHBs of M3 and M13 coincide nicely. Therefore, of M13 was derived to be = 15.02 0.10 mag. However, if we adopted = 0.60 mag from the magnitude difference between the AGB bumps of M3 and M13, of M13 is derived to be = 15.12 0.10 mag. However, in this case, the actual HB of M13 was 0.10 mag brighter than that of M3 and the BHBs of M3 and M13 do not coincide. Since the magnitude of the AGB bump position is nearly constant independent of metallicity and helium abundance (Castellani et al. 1991; Bono et al. 1995), this point may indicate that of M13 is 0.10 mag brighter than that of M3. So, we finally adopted of M13 as = 15.02 0.10 mag.
According to Cassisi et al. (2001) the difference between the bottom luminosity of the AGB clump and the luminosity of the ZAHB level ((AGB-HB)) appears largely independent of variations in the assumed progenitor mass and/or original helium content (). But, because they did not present the exact quantitative dependency of (AGB-HB) on the progenitor mass and original helium content we cannot know how much (AGB-HB) is independent of variations in the assumed progenitor mass and/or original helium content. According to Cassisi & Salaris (1997) at a given -element enhanced global metallicity [M/H] the difference in visual magnitude between the RGB bump and the ZAHB level ( = ( )) is weakly dependent on the original helium content and the age of the stellar system from their exact quantitative argumentations and quite negligible from the range of the expected efficiency of the mass-loss phenomenon in real RGB stars. And they argue that can be used as a tentative guess to estimate the HB luminosity level in those GCs in which the HB morphology is poorly populated in the RR Lyrae instability strip or in which the HB morphology is quite blue or quite red. Also, according to Cassisi, Degl’Innocenti, & Salaris (1997) is weakly affected by the helium and heavy-element diffusion (the maximum difference is 0.06 mag). So, at this stage it seems more reliable to use the magnitude difference between the RGB bumps of M3 and M13 in deriving of M13 than the magnitude difference between the AGB bumps of M3 and M13.
From and of M3 and M13 we counted the numbers of RGB stars brighter than the HB levels. In the case of M3, since = 15.72 0.07 mag, = 87 when = 0.11 mag ( 15.83 0.07 mag) and = 96 when = 0.29 mag ( 16.01 0.07 mag) in the 26 range. In the case of M13, since = 15.02 0.10 mag, = 74 when = 0.11 mag ( 15.13 0.10 mag) and = 92 when = 0.29 mag ( 15.31 0.10 mag) in the 32 range. Here, errors in arise from the magnitude errors of of M3 and M13.
In Figures 5 and 6 the horizontal arrows to the left of the BHBs of M3 and M13 indicate the lower limits of normal HB levels of M3 and M13. In the case of M3 this is = 16.75 mag and is roughly 1 mag below the of M3. In the case of M13 this is = 16.00 mag, roughly 1 mag below the of M13 and roughly the same position as the first gap in the BHB of M13 reported by Grundahl, VandenBerg, & Andersen (1998) and Ferraro et al. (1997b). Normal HB stars of M3 and M13 are enclosed by small open squares in Figures 5 and 6. According to the original definition of (= /) in Buzzoni et al. (1983), the HB lifetime is the time spent by the HB stars in the RR Lyrae instability strip at log = 3.85. Therefore, if all the HB stars (RHB stars, RR Lyrae stars, BHB stars, and extended BHB stars) have the same lifetimes as the HB stars in the RR Lyrae instability strip at log = 3.85 one can include all the HB stars in (to estimate the HB lifetime at log = 3.85) to derive and the helium abundance of a given GC. However, it later turned out that hot HB stars of Galactic GCs have a more prolonged lifetime than the HB stars in the RR Lyrae instability strip at log = 3.85, which is almost identical to that of the HB stars redder than the RR Lyrae instability strip (Castellani et al. 1994; Zoccali et al. 2000). So, one must correct the prolonged lifetime of hot HB stars of individual Galactic GCs which have BHB stars and extended BHB stars with or without RHB stars in the derivation of and the helium abundance of individual Galactic GCs. According to the theoretical hot HB models of Castellani et al. (1994), the lifetime of hot HB stars increases up to 30 with respect to the HB stars in the RR Lyrae instability strip and, according to the HB models of Zoccali et al. (2000), the mean lifetime of blue HB stars is about 20 larger than that of the HB stars in the RR Lyrae instability strip, which is almost identical to that of the HB stars redder than the RR Lyrae instability strip. Moreover, according to Zoccali et al. (2000), the values of Galactic GCs with blue HB morphologies are expected to be 0.25 units higher than those with RHBs.
However, Buzzoni et al. (1983), Caputo, Martinez Roger, & Paez (1987), and Sandquist (2000) did not know the prolonged lifetime of hot HB stars and they did not take account of the prolonged lifetime of hot HB stars in the derivation of helium abundances of Galactic GCs from the population ratio . Therefore, they included all the HB stars including hot HB stars in and did not correct the prolonged lifetime of hot HB stars by reducing (or ) by some factor related to the prolonged lifetime of hot HB stars when the GCs have hot HB stars, and just averaged out the all the values of helium abundances of Galactic GCs to obtain the mean helium abundance of Galactic GCs. This fact was recently noticed by Zoccali et al. (2000), Cassisi, Salaris, & Irwin (2003), and Salaris et al. (2004) in the derivation of ratios or helium abundances of Galactic GCs. So, Cassisi et al. (2003) corrected the prolonged lifetime of hot HB stars when the GCs have hot HB stars in the derivation of helium abundances of Galactic GCs using the data of Sandquist (2000) and Zoccali et al. (2000). But, because the number of GCs having hot HB stars is not so great, this correction of the prolonged lifetime of hot HB stars did not greatly affect the mean helium abundance of Galactic GCs. In the case of Salaris et al. (2004) because they did not correct the prolonged lifetime of hot HB stars in the derivation of helium abundances of Galactic GCs, they got a large scatter of helium abundances of metal-poor GCs which in many cases have hot HB stars.
So, in one method of correction for the prolonged lifetime of the hot HB stars of M3 and M13 we marked only the normal HB stars in Figures 5 and 6 and included only those stars in the first calculations of the and ratios for M3 and M13. However, if we include all the HB stars in the calculations of and we must consider the prolonged lifetime of extended BHB stars and reduce in accordance if we want to derive the true helium abundance and correct value of for a given GC. According to Figure 5 the total number of normal HB stars of M3 is 215 and according to Figure 6 the total number of normal HB stars for M13 is 138. If we include all the HB stars of M13 the total number of HB stars for M13 is 247. However, for M3 is 123 in the 26 range and for M13 is 57 in the 32 range. In the case of M13, if we include all the HB stars in the population ratios, for M13 is 127 in the 32 range.
So the population ratios of M3 and M13 are as follows. For M3 = / is = 123/(87) = 1.414 if = 0.11 mag is adopted, = / is = 123/(96) = 1.281 if = 0.29 mag is adopted, and = / is = 15/123 = 0.122 in the 26 range. Here, errors arise from the error of M3. These results are briefly summarized in Table 2.
For M13 when we include only normal HB stars in , = / is = 57/(74) = 0.770 if = 0.11 mag is adopted, = / is = 57/(92) = 0.620 if = 0.29 mag is adopted, and = / is = 9/57 = 0.158 in the 32 range. Here, errors arise from the error of M13. These results are briefly summarized in Table 3.
For M13 when we include all the HB stars in , = / is = 127/(74) = 1.716 if = 0.11 mag is adopted, = / is = 127/(92) = 1.380 if = 0.29 mag is adopted, and = / is = 9/127 = 0.071 in the 32 range. Here, errors arise from the error of M13. These results are briefly summarized in Table 4.
6 The RGB Luminosity Function
We compared the RGB luminosity functions of M3 and M13 with the theoretical RGB luminosity function of Bergbusch & VandenBerg (2001) in order to determine whether there are “extra stars” in the RGB luminosity functions of M3 and M13. The RGB luminosity function data were taken from those used in 4 to examine the existence of RGB bumps in M3 and M13 and only the bin size was changed to 0.25 mag to reduce the small number statistical effects in the brighter regions where the number of stars is small. As in the case of the population ratios for M3 and M13, in order to obtain the observed RGB luminosity functions of M3 and M13 from the same complete samples used in the population ratios and to directly compare them with the population ratio for M3 and M13 we only used stars for which 26 from the cluster center in the case of M3 and 32 from the cluster center in the case of M13 in the derivation of the observed RGB luminosity functions of M3 and M13, respectively, where is the projected distance from the cluster center. For the theoretical RGB luminosity function, that of Bergbusch & VandenBerg (2001) with age 13.5 Gyr, [Fe/H] = 1.54, [/Fe] = 0.30, and = 0.2362, which was generated from the isochrone by Bergbusch & VandenBerg (2001) with color- relations as described by VandenBerg & Clem (2003), was adopted in both the cases of M3 and M13.
Distance moduli of M3 and M13 were derived using ZAHB levels () of M3 and M13 as a distance indicator. The procedures for deriving the distance moduli of M3 and M13 are as follows. Since ()V equals ( ), we derived and using equation (2) of Ferraro et al. (1999) for and equation (4) of Ferraro et al. (1999) for . According to equation (2) of Ferraro et al. (1999) is
| (2) |
Also, according to equation (4) of Ferraro et al. (1999) is
| (3) |
For for M3 and M13 we used the values derived in 5. for M3 is 15.72 0.07 mag and the value for M13 is 15.02 0.10 mag. For [M/H] (-element enhanced global metallicity) and [Fe/H]CG97 ([Fe/H] in the Carretta & Gratton 1997 scale) for M3 and M13 we used the values listed in Ferraro et al. (1999). Since the metallicities of M3 and M13 are nearly the same we took [Fe/H]CG97 = 1.39 and [M/H] = 1.18, respectively, for M3 and M13. So, ()V of M3 is 15.18 0.21 mag and that of M13 is 14.48 0.22 mag. These values nearly coincide with mean apparent distance moduli derived by the subdwarf fitting technique using field subdwarfs having parallax measurements and with apparent distance moduli obtained by Harris (1996) based on the mean HB luminosity levels of M3 and M13 within the errors. According to Rood et al. (1999) the apparent distance modulus of M3 derived by the subdwarf fitting technique with field subdwarfs having parallax measurements is ()V = 15.19 mag, which value is adopted from private communication with R. G. Gratton in 1998 adopting Ferraro et al.’s (1997a) photometry. According to Gratton et al. (1997) the apparent distance modulus of M13 derived by the subdwarf fitting technique with field subdwarfs having parallax measurements is ()V = 14.45 mag adopting Richer & Fahlman’s (1986) photometry for the main sequence fiducial sequences. And according to the latest database of Harris (1996), the apparent distance moduli of M3 and M13, which are based on the mean HB luminosity levels of M3 and M13, are ()V = 15.12 mag and 14.48 mag, respectively. The latest database of Harris (1996) adopted Johnson & Bolte’s (1998) photometry of M3 and Paltrinieri et al.’s (1998) photometry of M13 for the determinations of the mean HB luminosity levels of M3 and M13, respectively. The distance moduli of M3 and M13 derived in this study and related parameters are briefly summarized in Table 5.
From these distance moduli we shifted the theoretical RGB luminosity function of Bergbusch & VandenBerg (2001) = 15.18 mag for M3 and = 14.48 mag for M13. Normalization of the observed RGB luminosity function of M3 and the theoretical RGB luminosity function of Bergbusch & VandenBerg (2001) was performed for the =16.40–17.40 mag interval and that of M13 was carried out for the = 15.95–16.95 mag interval. Also, we combined these results into one figure, shifting the whole dataset of M3 = 0.70 mag and (log ) = 0.16959 in order to make the theoretical RGB luminosity functions of Bergbusch & VandenBerg (2001) normalized for different clusters coincide exactly while keeping the observed RGB luminosity function of M13 in its absolute scale. The results are shown in Figure 7 for M3 and M13.
In Figure 7 closed triangles with error bars denote the observed RGB luminosity function of M3 with projected distance from the cluster 26 and the solid line is the theoretical RGB luminosity function of Bergbusch & VandenBerg (2001) and the error bars are 1 of Poisson statistical errors. Connected dotted arrows between two short vertical lines indicate the normalization interval of the observed RGB luminosity function of M3 and the theoretical RGB luminosity function of Bergbusch & VandenBerg (2001). The dashed line is the second-order least-square fitting to the observed RGB luminosity function of M3 in the = 11.95–14.20 mag interval (originally in the = 12.65–14.90 mag interval when unshifted). Although according to the second-order least-square fitting line, M3 shows a slight deficiency of stars relative to the theoretical RGB luminosity function of Bergbusch & VandenBerg (2001) in the bright region, the number of deficient stars is only 1 6 in its absolute sense, where the error arises from the Poisson statistical error of the observed RGB luminosity function of M3. However, in general the observed RGB luminosity function of M3 and the theoretical RGB luminosity function of Bergbusch & VandenBerg (2001) seem to agree quite well over the whole magnitude range and there are no extra stars in the observed RGB luminosity function of M3 relative to the theoretical RGB luminosity function of Bergbusch & VandenBerg (2001). According to Figure 7, the total number of stars in the observed RGB luminosity function of M3 in the = 11.95–16.70 mag range (originally in the = 12.65–17.40 mag range when unshifted) is 328 18 in its absolute sense and the total number of stars in the theoretical RGB luminosity function of Bergbusch & VandenBerg (2001) in the same magnitude range is estimated to be 332 in its absolute sense. So, their difference is only 4 (1 of the total number of stars in the observed RGB luminosity function of M3) and they are in quite excellent agreement to within a 99 confidence level with the total number of stars of the observed RGB luminosity function of M3.
In Figure 7, open circles with error bars denote the observed RGB luminosity function of M13 with the projected distance from the cluster center 32 and the error bars represent 1 Poisson statistical errors. Connected arrows between two short vertical lines indicate the normalization interval of the observed RGB luminosity function for M13 and the theoretical RGB luminosity function of Bergbusch & VandenBerg (2001). According to Figure 7, the observed luminosity function of M13 in the bright region shows a slight deficiency of stars relative to the theoretical RGB luminosity function of Bergbusch & VandenBerg (2001). The dotted line is the second-order least-square fitting to the observed RGB luminosity function of M13 in the = 12.20–14.20 mag interval. The second-order least-square fitting line of M13 also shows a slight deficiency of stars relative to the theoretical RGB luminosity function of Bergbusch & VandenBerg (2001) in the bright region and the number of deficient stars of the observed RGB luminosity function is 4 5. According to Figure 7, the observed RGB luminosity function of M13 shows “extra stars” in the = 14.70–15.70 mag range relative to the theoretical RGB luminosity function of Bergbusch & VandenBerg (2001). The number of extra stars is estimated to be 31 10 with about 3 Poisson statistical error. According to Figure 7, “extra stars” are partially included in the magnitude range where RGB stars are used to derive the population ratio . The number of extra stars included in the RGB stars used in the derivation of population ratio is estimated to be 17 7 when = 0.11 mag in the = 14.70–15.13 mag range, and 20 8 when = 0.29 mag in the = 14.70–15.31 mag range. According to Figure 7, the total number of stars in the observed RGB luminosity function of M13 in the = 12.20–16.95 mag range is 308 18 and total number of stars in the theoretical RGB luminosity function of Bergbusch & VandenBerg (2001) in the same magnitude range is estimated to be 273. So, their difference is 35, or 11 of the total number of stars in the observed RGB luminosity function of M13 and they do not agree within Poisson statistical error. This fact also supports the contention that there are “extra stars” in the observed RGB luminosity function of M13.
In order to determine whether the “extra stars” in the observed RGB luminosity function of M13 relative to the theoretical RGB luminosity function of Bergbusch & VandenBerg (2001) are real even when we compare with the observed RGB luminosity function of M3 in a differential sense, we intercompare the observed RGB luminosity functions of M3 and M13. According to Figure 7, the number of deficient stars in the observed RGB luminosity function of M13 with respect to the observed RGB luminosity function of M3 in the = 12.20–14.20 mag range is 2 11 and is therefore negligible. In the = 14.45–15.70 mag range the observed RGB luminosity function of M13 shows “extra stars” with respect to the observed RGB luminosity function of M3. The number of extra stars in M13 is estimated to be 40 21 in the following ways. In the = 14.45–15.70 mag range there are six bins for the RGB luminosity functions of M3 and M13. So, “extra stars” in M13 are calculated in each bin and their associated errors are also calculated in each bin according to the standard error propagation law with Poisson statistical errors for each bin of M3 and M13. In each bin “extra stars” of M13 are calculated simply as the number of M13 stars in the RGB luminosity function of M13 minus the number of M3 stars in the RGB luminosity function of M3 normalized to the M13 plane. And finally the “extra stars” of M13 in six bins are simply added and their associated errors in six bins are simply combined according to the standard error propagation law. Although it seems that Poisson statistical error overestimates the counting error, the number of extra stars in M13 is still at the 2 level of Poisson statistical error and about 13 of the total number of stars of the observed RGB luminosity function of M13. According to Figure 7, the “extra stars” of M13 are partially included in the magnitude range where RGB stars are used in the derivation of population ratio . The number of extra stars included in the RGB stars used in the derivation of the population ratio is estimated to be 24 15 when = 0.11 mag in the = 14.45–15.13 mag range, and 28 17 when = 0.29 mag in the = 14.45–15.31 mag range.
Because in the case of M13 we estimated the number of the extra stars of the RGB of M13 included in the calculation of ratios in the comparison of the observed RGB luminosity functions of M3 and M13, we can estimate the ratios for M13 excluding the effects of the extra stars of RGB. The ratios for M13 excluding the effects of the extra stars of the RGB of M13 are estimated as follows. In the case where only the normal HB stars are included, for M13 is 57/(74) = 57/(50) = 1.140 when = 0.11 mag and 57/(92) = 57/(64) = 0.891 when = 0.29 mag in the 32 range. These ratios are smaller than the ratios for M3. If we assume that the helium abundances of M3 and M13 are nearly the same, including only the normal HB stars in the ratios seems to overcorrect the prolonged lifetime of the extended BHB stars of M13. In M13 the second BHB gap is at 16.80 mag. The number of HB stars of M13 between the first BHB gap and the second BHB gap (16.00 16.80 mag interval) is 24 in the 32 range. If we add this number to the of M13, the population ratios and for M13 are as follows. for M13 is (57 + 24)/(74) = 81/(50) = 1.620 when = 0.11 mag and (57 + 24)/(92) = 81/(64) = 1.266 when = 0.29 mag in the 32 range. for M13 is 9/(57 + 24) = 9/81 = 0.111 in the 32 range. In this case these population ratios and for M13 in the 32 range are consistent with population ratios and for M3 in the 26 range. In the case where all the HB stars are included, for M13 is 127/(74) = 127/(50) = 2.540 when = 0.11 mag and 127/(92) = 127/(64) = 1.984 when = 0.29 mag in the 32 range. These ratios for M13 are about 0.90 units higher than those for M3 although error levels are large. This value clearly imply that in GCs having the extended BHB stars we must correct anyway the prolonged lifetime of hot HB stars in ratios to estimate the true helium abundances of these kinds of GCs. If we assume that the helium abundances of M3 and M13 are nearly the same, 0.90 units are larger than the 0.25 units which are expected for the increased values of the ratios for GCs which have blue HB morphologies according to Zoccali et al. (2000). This fact may imply that the actual lifetime of the extended BHB stars is larger than that predicted by the theoretical hot HB stellar models (Castellani et al. 1994; Zoccali et al. 2000). Otherwise, the helium abundance of M13 must be larger than that of M3.
7 Conclusion and Summary
We presented versus , versus , and versus CMDs for M3 and M13. In these CMDs the AGB stars of M3 and M13 are the most clearly separated from RGB stars in versus CMDs. We have found stars widely distributed over the RR Lyrae instability strip, and also some stars below the level of ZAHB in both the RHB and BHB of M3. When 84 known RR Lyraes are identified from the observed field according to the M3 variable stars list, these stars are also identified as RR Lyraes in the M3 CMDs. So, these stars are also RR Lyrae variable stars in their close minimum or minimum pulsational stages in light of their magnitude. In M13 we have found a few stars at the RGB tip, which tend slightly to the redder and fainter direction and BHB stars are well populated down to the MSTO with at least two gaps. We have found AGB bumps at = 14.85 0.05 mag for M3 and at = 14.25 0.05 mag for M13. AGB stars in M3 are more concentrated near the AGB bump, while those in M13 are scattered along the AGB sequence. We identified RGB bumps for M3 and M13 whose positions are = 15.50 0.05 mag for M3 and = 14.80 0.05 mag for M13 from the slope changes of the integrated luminosity functions of M3 and M13.
We presented population ratios (= /), and (= /) for M3 and M13 using their versus CMDs in Figures 1c and 2c for M3 and M13, respectively. for M3 is 1.414 or 1.281 in the 26 range depending on the adopted differential bolometric corrections () between at log = 3.85 and RGB at the level. for M3 is 0.122 in the 26 range. for M13 is 0.770 or 0.620 in the 32 range depending on the adopted differential bolometric corrections () between at log = 3.85 and RGB at the level when only normal HB stars are included in . for M13 is 0.158 in the 32 range when only normal HB stars are included in . In the case where all the HB stars are included in for the population ratios, for M13 is 1.716 or 1.380 in the 32 range depending on the adopted differential bolometric corrections () between at log = 3.85 and the RGB at the level. In this case for M13 is 0.071 in the 32 range.
When comparing the population ratios and for M3 and M13 in the case where only normal HB stars are included in for M13, values for M3 are larger than those for M13. The small values of for M13 compared to those for M3 could be explained partially by the increased number of RGB stars in M13 due to an effective extra deep mixing which prolongs the RGB phase, and partially by the cutoff of BHB tail stars below the first BHB gap, which have lost practically all the H-rich envelope. However values for M3 and M13 are similar and are in the range of the average value for the 43 Galactic GCs = 0.162 0.059 of Sandquist (2000), and in good agreement with the value = 0.15 derived by the more recent models of Cassisi et al. (1998). When comparing the population ratios and for M3 and M13 in the case where all the HB stars are included in for M13, the values for M3 and M13 are similar. However, the values for M3 are about a factor of 2 larger than those for M13, which fact can be explained by the prolonged lifetime of BHB tail stars of M13 (Castellani et al. 1994; Zoccali et al. 2000). Since the lifetime of BHB tail stars of M13 is prolonged, for M13 must be larger than for M3 but this contradicts the actual values for M3 and M13. This fact could be explained by the increased number of RGB stars in M13 due to an effective extra deep mixing which prolongs the RGB phase rendering for M13 smaller than the expected value.
We compared the observed RGB luminosity functions of M3 and M13 with the theoretical RGB luminosity function of Bergbusch & VandenBerg (2001) for exactly the same radial distances from the cluster centers in the derivation of population ratios and . We discovered “extra stars” in the observed RGB luminosity function of M13 which are expected from comparisons of population ratios and for M3 and M13. The increased number of stars (= “extra stars”) in the RGB luminosity function of M13 may be the result of an effective “deep mixing” as suggested by Langer, Bolte, & Sandquist (2000). This suggests that “deep mixing” may be another possible second parameter responsible for the different HB morphologies of M3 and M13. However, the “extra stars” due to deep mixing may be found in the upper RGB rather than the RGB bump. This study found extra stars near the RGB bump only.
In the case of M13 we estimated the number of the extra stars of the RGB of M13 included in the calculation of ratios in the comparison of the observed RGB luminosity functions of M3 and M13. So, we can estimate the ratios for M13 excluding the effects of the extra stars of RGB. When we exclude the effects of the extra stars of the RGB of M13 and assume that the helium abundances of M3 and M13 are the same, and for M3 and M13 in the considered radial distance from the cluster centers respectively become similar if we include only the HB stars brighter than the second BHB gap ( 16.80 mag) of M13 in of M13.
Recently, Sneden et al. (2004) argued that the severe abundance anomaly of oxygen for bright RGB stars and the excessive blueness of the HB of M13 are not due to deep mixing and that the severe abundance anomaly of oxygen for the bright RGB stars of M13 is due to pollution by the nuclear processed material ejected from cluster stars in the 3–6 range. Although [Fe/H] of M3, M13, and NGC 6752 are similar and the HB morphologies of M13 and NGC 6752 are similar in that they have no RHB stars, few or no RR Lyrae stars and predominantly BHB stars extending down to 4 mag below the HB level while M3 has a uniformly populated HB morphology, the abundance patterns are similar between M3 and NGC 6752 rather than between M13 and NGC 6752. Moreover, NGC 6752 shows abundance anomalies already in the main sequence stars and M13 and NGC 6752 satisfy the same anticorrelation of [O/Fe] with the magnesium isotopic ratio, which could only have come about in nuclear processed material ejected from cluster stars in the 3–6 range.
According to Sweigart (1997), “deep mixing” could increase the envelope abundance, and helium mixing increases the RGB tip luminosity and leads to enhanced mass loss along the RGB. These effects largely influence the subsequent horizontal branch evolution. They can produce a bluer HB morphology, making it possible to explain the hot HB population found in M13 as well as the difference in HB morphology between M3 and M13. Although the subsequent work of Caloi (2001) and the spectroscopic study on hot stars in M3 and M13 by Moehler et al. (2003) could not confirm that the “helium mixing” scenario of Sweigart (1997) is a definite explanation for the origin of the blue HB tail in M13, it seems worth reexamining helium mixing as a partial cause for the morphological difference in the normal HB between M3 and M13.
We conclude that the second parameter pair, M3 and M13, differ not only in their HB morphologies but also in their AGB sequence characteristics and RGB luminosity functions. It is quite probable that the cause of extra stars in the RGB luminosity function of M13, which may be due to deep mixing, may lead to differences in subsequent sequences from those of M3.
References
- Arp and Johnson (1955) Arp, H. C., & Johnson, H. L. 1955, ApJ, 122, 171
- Behr (2003) Behr, B. B. 2003, ApJS, 149, 67
- Behr et al. (2000) Behr, B. B., Cohen, J. G., & McCarthy, J. K. 2000, ApJ, 531, L37
- Behr et al. (1999) Behr, B. B., Cohen, J. G., McCarthy, J. K., & Djorgovski, S. G. 1999, ApJ, 517, L135
- Bergbusch and VandenBerg (1992) Bergbusch, P. A., & VandenBerg, D. A. 1992, ApJS, 81, 163
- Bergbusch and VandenBerg (2001) ———. 2001, ApJ, 556, 322
- Bono et al. (2001) Bono, G., Cassisi, S., Zoccali, M., & Piotto, G. 2001, ApJ, 546, L109
- Bono et al. (1995) Bono, G., Castellani, V., Degl’Innocenti, S., & Pulone, L. 1995, A&A, 297, 115
- Buonanno et al. (1994) Buonanno, R., Corsi, C. E., Buzzoni, A., Cacciari, C., Ferraro, F. R., & Fusi Pecci, F. 1994, A&A, 290, 69
- Buzzoni et al. (1983) Buzzoni, A., Fusi Pecci, F., Buonanno, R., & Corsi, C. E. 1983, A&A, 128, 94
- Caloi (2001) Caloi, V. 2001, A&A, 366, 91
- Caputo et al. (1987) Caputo, F., Martinez Roger, C., & Paez, E. 1987, A&A, 183, 228
- Carretta and Gratton (1997) Carretta, E., & Gratton, R. G. 1997, A&AS, 121, 95
- Cassisi et al. (2001) Cassisi, S., Castellani, V., Degl’Innocenti, S., Piotto, G., & Salaris, M. 2001, A&A, 366, 578
- Cassisi et al. (1998) Cassisi, S., Castellani, V., Degl’Innocenti, S., & Weiss, A. 1998, A&AS, 129, 267
- Cassisi et al. (1997) Cassisi, S., Degl’Innocenti, S., & Salaris, M. 1997, MNRAS, 290, 515
- Cassisi and Salaris (1997) Cassisi, S., & Salaris, M. 1997, MNRAS, 285, 593
- Cassisi et al. (2003) Cassisi, S., Salaris, M., & Irwin, A. W. 2003, ApJ, 588, 862
- Castellani et al. (1994) Castellani, M., Castellani, V., Pulone, L., & Tornambé, A. 1994, A&A, 282, 771
- Castellani et al. (1991) Castellani, V., Chieffi, A., & Pulone, L. 1991, ApJS, 76, 911
- Cavallo and Nagar (2000) Cavallo, R. M., & Nagar, N. M. 2000, AJ, 120, 1364
- Clement et al. (2001) Clement, C. M., et al. 2001, AJ, 122, 2587
- Dorman (1992) Dorman, B. 1992, ApJS, 81, 221
- Ferraro et al. (1997a) Ferraro, F. R., et al. 1997a, A&A, 320, 757
- Ferraro et al. (1997b) Ferraro, F. R., Paltrinieri, B., Fusi Pecci, F., Cacciari, C., Dorman, B., & Rood, R. T. 1997b, ApJ, 484, L145
- Ferraro et al. (1999) Ferraro, F. R., Messineo, M., Fusi Pecci, F., De Palo, M. A., Straniero, O., Chieffi, A., & Limongi, M. 1999, AJ, 118, 1738
- Fusi Pecci et al. (1990) Fusi Pecci, F., Ferraro, F. R., Crocker, D. A., Rood, R. T., & Buonanno, R. 1990, A&A, 238, 95
- Gratton et al. (1997) Gratton, R. G., Fusi Pecci, F., Carretta, E., Clementini, G., Corsi, C. E., & Lattanzi, M. 1997, ApJ, 491, 749
- Greenstein et al. (1967) Greenstein, G. S., Truran, J. W., & Cameron, A. G. W. 1967, Nature, 213, 871
- Grundahl et al. (1998) Grundahl, F., VandenBerg, D. A., & Andersen, M. I. 1998, ApJ, 500, L179
- Harris (1996) Harris, W. E. 1996, AJ, 112, 1487
- Heber et al. (1986) Heber, U., Kudritzki, R. P., Caloi, V., Castellani, V., Danziger, J., & Gilmozzi, R. 1986, A&A, 162, 171
- Johnson and Bolte (1998) Johnson, J. A., & Bolte, M. 1998, AJ, 115, 693
- Kopacki et al. (2003) Kopacki, G., Kołaczkowski, Z., & Pigulski, A. 2003, A&A, 398, 541
- Kraft et al. (1992) Kraft, R. P., Sneden, C., Langer, G. E., & Prosser, C. F. 1992, AJ, 104, 645
- Landolt (1992) Landolt, A. U. 1992, AJ, 104, 340
- Langer et al. (2000) Langer, G. E., Bolte, M., & Sandquist, E. 2000, ApJ, 529, 936
- Michaud et al. (1983) Michaud, G., Vauclair, G., & Vauclair, S. 1983, ApJ, 267, 256
- Moehler et al. (1997) Moehler, S., Heber, U., & Rupprecht, G. 1997, A&A, 319, 109
- Moehler et al. (2003) Moehler, S., Landsman, W. B., Sweigart, A. V., & Grundahl, F. 2003, A&A, 405, 135
- Paltrinieri et al. (1998) Paltrinieri, B., Ferraro, F. R., Fusi Pecci, F., & Carretta, E. 1998, MNRAS, 293, 434
- Preston et al. (1991) Preston, G. W., Shectman, S. A., & Beers, T. C. 1991, ApJ, 375, 121
- Rey et al. (2001) Rey, S.-C., Yoon, S.-J., Lee, Y.-W., Chaboyer, B., & Sarajedini, A. 2001, AJ, 122, 3219
- Richer and Fahlman (1986) Richer, H. B., & Fahlman, G. G. 1986, ApJ, 304, 273
- Rood et al. (1999) Rood, R. T., et al. 1999, ApJ, 523, 752
- Salaris et al. (2004) Salaris, M., Riello, M., Cassisi, S., & Piotto, G. 2004, A&A, 420, 911
- Salaris and Weiss (2002) Salaris, M., & Weiss, A. 2002, A&A, 388, 492
- Sandage (1953) Sandage, A. R. 1953, AJ, 58, 61
- Sandquist (2000) Sandquist, E. L. 2000, MNRAS, 313, 571
- Savedoff (1956) Savedoff, M. P. 1956, AJ, 61, 254
- Smith (2002) Smith, G. H. 2002, PASP, 114, 1097
- Sneden et al. (2004) Sneden, C., Kraft, R. P., Guhathakurta, P., Peterson, R. C., & Fulbright, J. P. 2004, AJ, 127, 2162
- Stetson et al. (1990) Stetson, P. B., Davis, L. E., & Crabtree, D. R. 1990, in ASP Conf. Ser. 8, CCDs in Astronomy, ed. G. H. Jacoby (San Francisco: ASP), 289
- Sweigart (1997) Sweigart, A. V. 1997, ApJ, 474, L23
- VandenBerg and Clem (2003) VandenBerg, D. A., & Clem, J. L. 2003, AJ, 126, 778
- Zoccali et al. (2000) Zoccali, M., Cassisi, S., Bono, G., Piotto, G., Rich, R. M., & Djorgovski, S. G. 2000, ApJ, 538, 289


| Exposure Time | Seeing (FWHM) | ||||
|---|---|---|---|---|---|
| Object | Filter | (s) | (arcsec) | Air Mass Range | Observing Date |
| M3 | 2 160/2 800 | 2.2/2.0 | 1.01 1.01 | 2001 May 10 | |
| 2 120/2 600 | 2.0/2.0 | 1.02 1.04 | 2001 May 10 | ||
| 2 20/2 60/2 300 | 1.8/1.9/1.9 | 1.05 1.10 | 2001 May 10 | ||
| M13 | 2 160/2 800 | 1.9/1.8 | 1.03 1.06 | 2001 May 11 | |
| 2 20/2 120 | 1.8/1.8 | 1.13 1.15 | 2001 May 11 | ||
| 2 20/2 60 | 1.4/1.6 | 1.22 1.25 | 2001 May 11 |
| (= /) | (= /) | ||||
|---|---|---|---|---|---|
| ( 26) | |||||
| = 0.11 mag case (Ferraro et al. 1997a) | |||||
| 15.72 0.07 | 123 | 15 | 87 | 1.414 | 0.122 |
| = 0.29 mag case (Sandquist 2000) | |||||
| 15.72 0.07 | 123 | 15 | 96 | 1.281 | 0.122 |
| (= /) | (= /) | ||||
|---|---|---|---|---|---|
| ( 32) | |||||
| = 0.11 mag case (Ferraro et al. 1997a) | |||||
| 15.02 0.10 | 57 | 9 | 74 | 0.770 | 0.158 |
| = 0.29 mag case (Sandquist 2000) | |||||
| 15.02 0.10 | 57 | 9 | 92 | 0.620 | 0.158 |
| (= /) | (= /) | ||||
|---|---|---|---|---|---|
| ( 32) | |||||
| = 0.11 mag case (Ferraro et al. 1997a) | |||||
| 15.02 0.10 | 127 | 9 | 74 | 1.716 | 0.071 |
| = 0.29 mag case (Sandquist 2000) | |||||
| 15.02 0.10 | 127 | 9 | 92 | 1.380 | 0.071 |
| Cluster | [Fe/H]CG97 | [M/H] | ()V | |||
|---|---|---|---|---|---|---|
| M3 | 1.39 | 1.18 | 15.72 0.07 | 15.78 0.07 | 0.60 | 15.18 0.21 |
| M13 | 1.39 | 1.18 | 15.02 0.10 | 15.08 0.10 | 0.60 | 14.48 0.22 |