Polarisation profiles of southern pulsars at 3.1 GHz
Abstract
We present polarisation profiles for 48 southern pulsars observed with the new 10-cm receiver at the Parkes telescope. We have exploited the low system temperature and high bandwidth of the receiver to obtain profiles which have good signal to noise for most of our sample at this relatively high frequency. Although, as expected, a number of profiles are less linearly polarised at 3.1 GHz than at lower frequencies, we identify some pulsars and particular components of profiles in other pulsars which have increased linear polarisation at this frequency. We discuss the dependence of linear polarisation with frequency in the context of a model in which emission consists of the superposition of two, orthogonally polarised modes. We show that a simple model, in which the orthogonal modes have different spectral indices, can explain many of the observed properties of the frequency evolution of both the linear polarisation and the total power, such as the high degree of linear polarisation seen at all frequencies in some high spin-down, young pulsars. Nearly all the position angle profiles show deviations from the rotating vector model; this appears to be a general feature of high-frequency polarisation observations.
keywords:
pulsars: general - polarisation1 Introduction
The physics of pulsar magnetospheres can be tackled via two observational routes. Observing single pulses from radio pulsars gives information on the instantaneous plasma conditions, the production of linear and circular polarisation and radiation mechanism. The resulting phenomenology and the underlying physics have been discussed recently for giant pulses (Johnston & Romani, 2003), drifting subpulses (e.g. Edwards & Stappers, 2002, 2003; Clemens & Rosen, 2004) and circular polarisation effects (Karastergiou & Johnston, 2004; Melrose & Luo, 2004). However, current sensitivity permits such observations only on a small sample of the total pulsar population, especially at frequencies above about 1 GHz.
| Pulsar | Period | /S | ||||
|---|---|---|---|---|---|---|
| (msec) | (mJy) | (mJy) | (%) | () | () | |
| J10125857 | 819 | 1.7 | 0.6 | 13 | 3 | 9 |
| J10385831 | 661 | 0.8 | 0.6 | 26 | 3 | 12 |
| J10485832 | 123 | 6.5 | 2.9 | 80 | 13 | 29 |
| J11105637 | 558 | 1.8 | 0.7 | 15 | 13 | 16 |
| J11146100 | 880 | 2.0 | 2.1 | - | 8 | 15 |
| J11266054 | 202 | 1.0 | 0.3 | 20 | 7 | 17 |
| J11336250 | 1022 | 2.9 | 1.5 | - | 91 | 112 |
| J13026350 | 48 | 3.6 | 2.8 | 97 | 256 | 274 |
| J13066617 | 473 | 2.5 | 1.3 | 15 | 30 | 47 |
| J13196056 | 284 | 1.2 | 0.4 | 39 | 12 | 21 |
| J13276301 | 196 | 3.2 | 0.9 | 24 | 15 | 71 |
| J13386204 | 1238 | 3.8 | 2.0 | 25 | 9 | 35 |
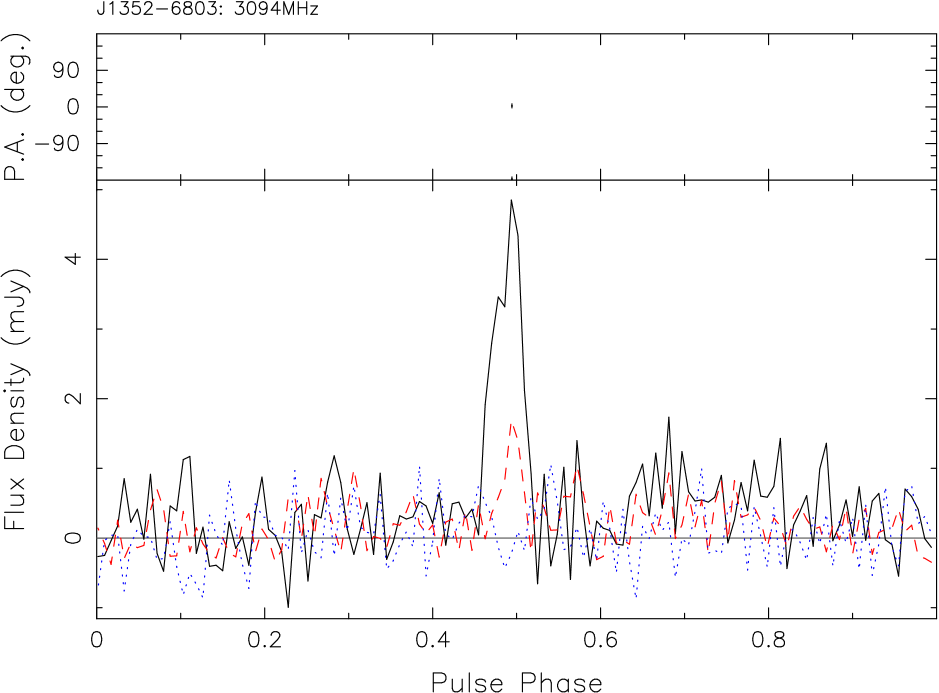
| J13526803 | 628 | 1.1 | 0.4 | - | 18 | - |
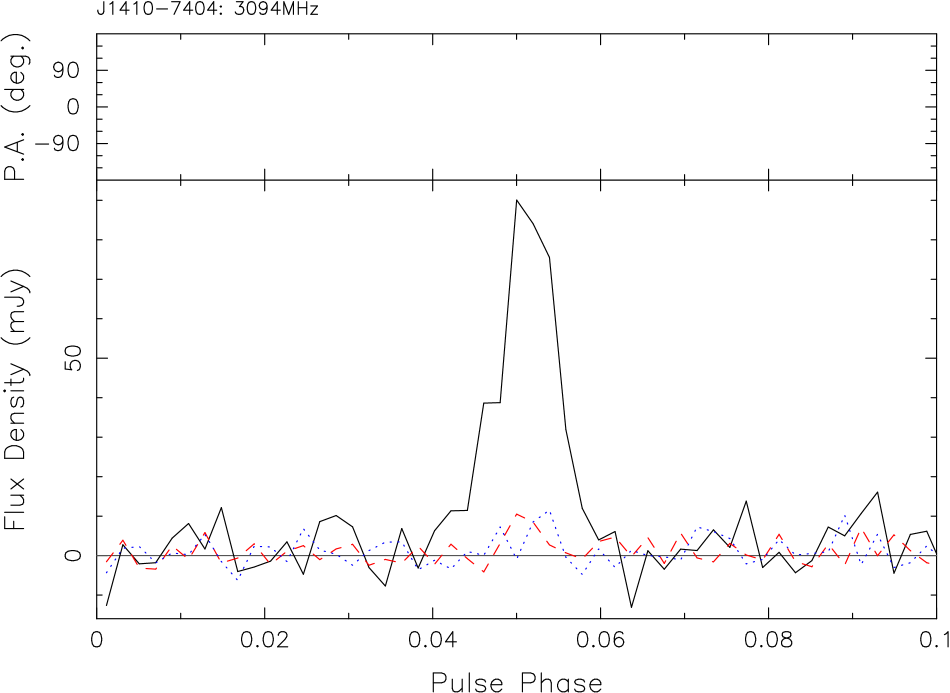
| J14107404 | 278 | - | 2.0 | - | 3 | - |
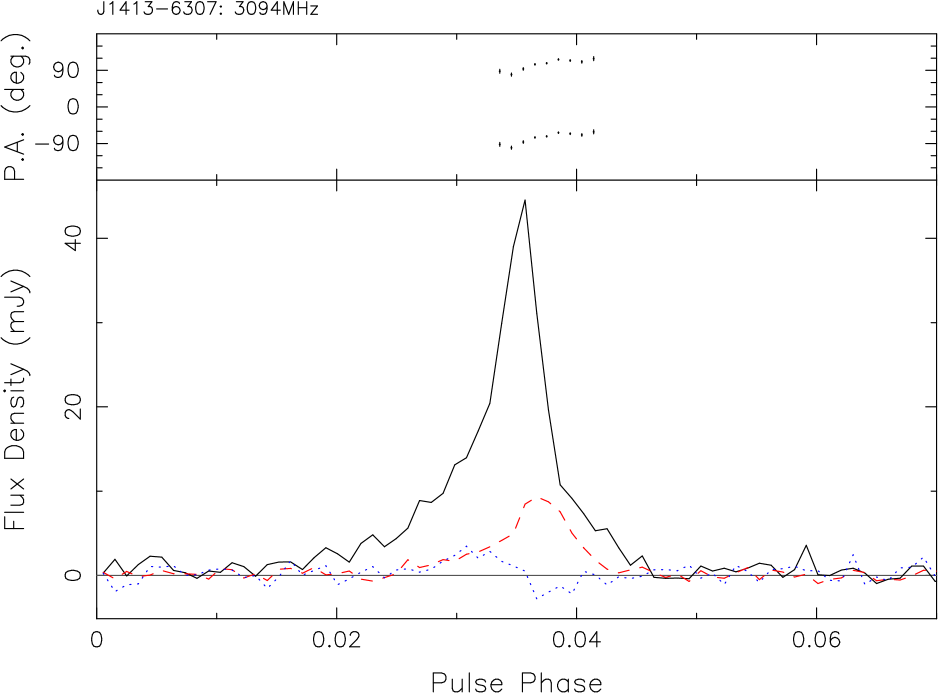
| J14136307 | 394 | 0.9 | 0.5 | 34 | 2 | 8 |
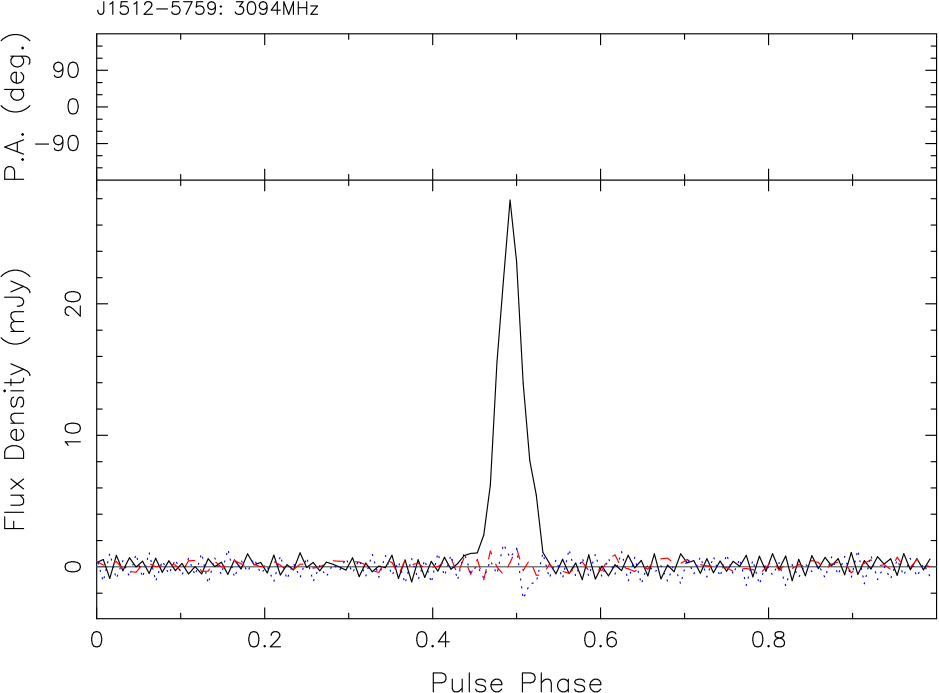
| J15125759 | 128 | 6.0 | 1.1 | - | 12 | 26 |
| J15174356 | 650 | - | 0.3 | - | 6 | - |
| J15225829 | 395 | 4.3 | 1.4 | 33 | 13 | 25 |
| J15345405 | 289 | 1.2 | 0.4 | - | 14 | - |
| J15354114 | 432 | - | 1.5 | 34 | 10 | 20 |
| J15395626 | 243 | 4.6 | 1.8 | 46 | 15 | 24 |
| J16115209 | 182 | 1.2 | 0.9 | - | 5 | 200 |
| J16145048 | 231 | 2.4 | 0.7 | 92 | 4 | 16 |
| J16155537 | 791 | 0.4 | 0.3 | - | 8 | - |
| J16304733 | 575 | 4.0 | 2.9 | 20 | 15 | 33 |
| J16335015 | 352 | 5.7 | 1.2 | - | 5 | - |
| J16334453 | 436 | 1.9 | 0.5 | 19 | 10 | 18 |
| J16374553 | 118 | 1.1 | 0.4 | 76 | 11 | 21 |
| J16404715 | 517 | 1.2 | 0.6 | - | 6 | 19 |
| J16464346 | 231 | 1.0 | 0.4 | 50 | 11 | 21 |
| J16533838 | 305 | 1.3 | 1.2 | 37 | 4 | 22 |
| J16553048 | 542 | - | 0.5 | - | 55 | 72 |
| J17014533 | 322 | 2.5 | 0.6 | 25 | 18 | 24 |
| J17074053 | 581 | 7.2 | 1.7 | 35 | 11 | 18 |
| J17094429 | 102 | 7.3 | 5.9 | 93 | 28 | 47 |
| J17122715 | 255 | - | 0.9 | - | 51 | 70 |
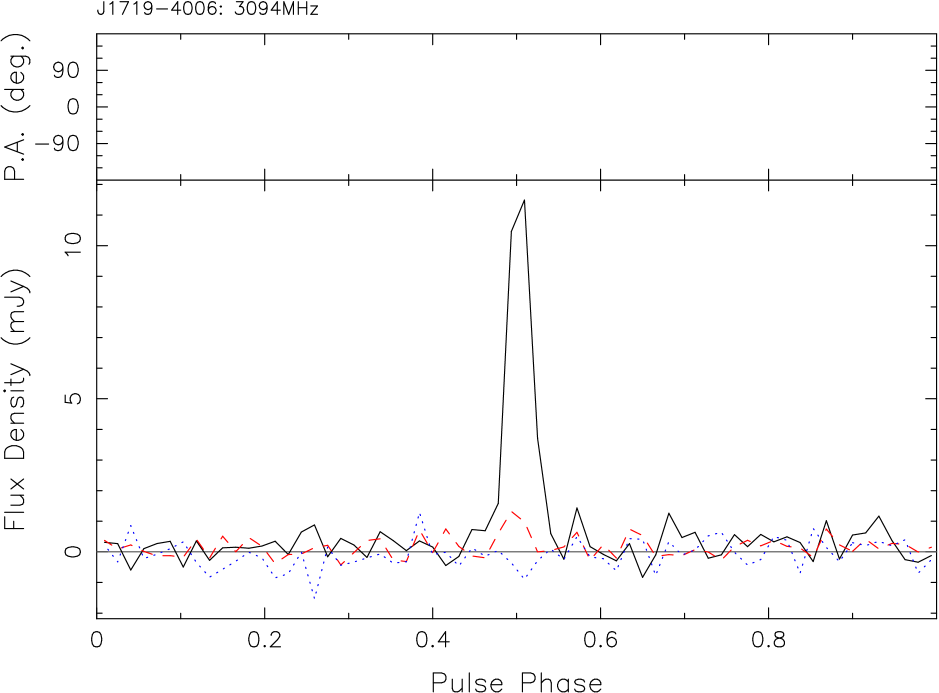
| J17194006 | 189 | 1.1 | 0.6 | - | 14 | 22 |
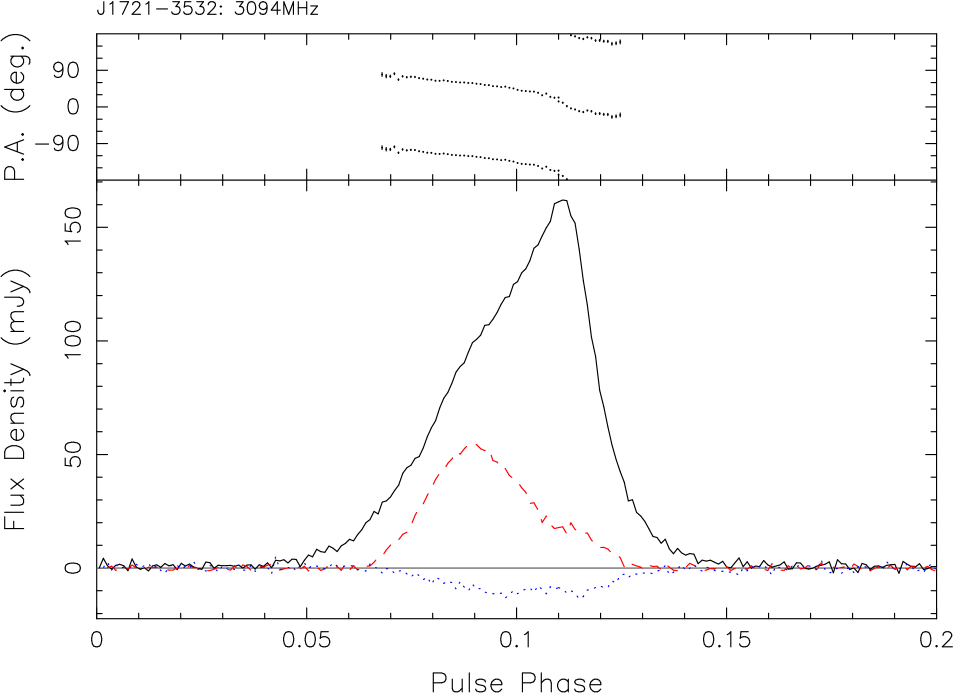
| J17213532 | 280 | 11.0 | 6.4 | 35 | 14 | 29 |
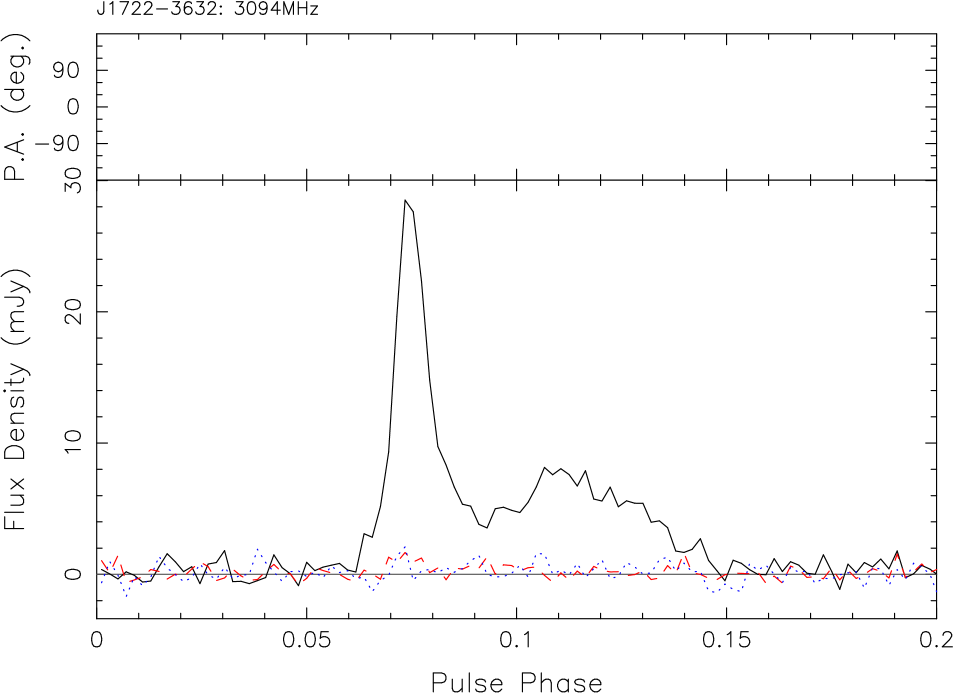
| J17223632 | 399 | 1.6 | 0.8 | - | 4 | 29 |
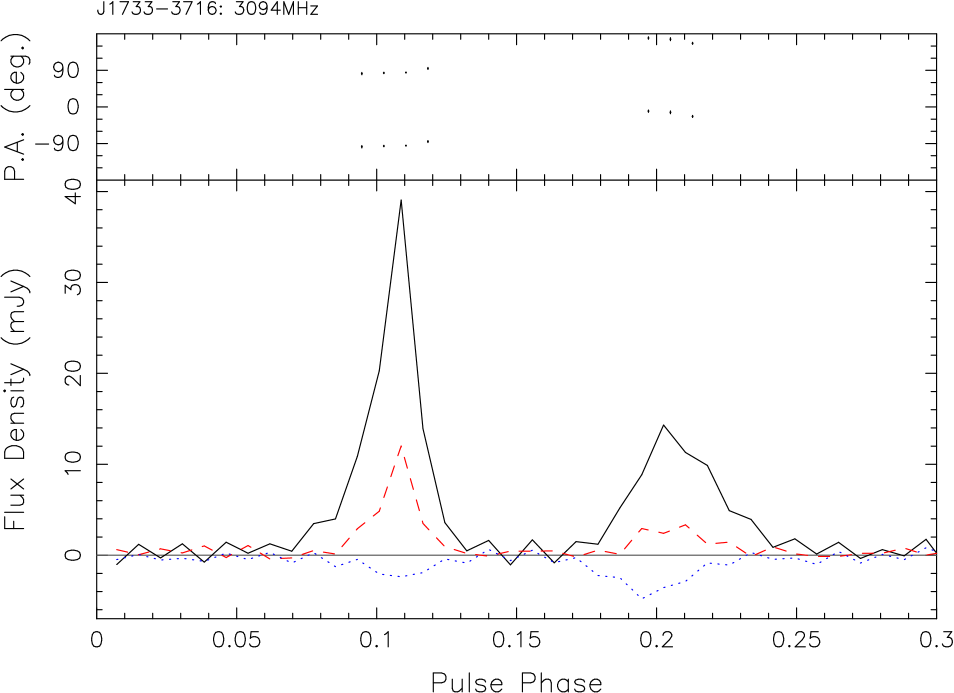
| J17333716 | 337 | 3.4 | 1.5 | 31 | 8 | 52 |
| J17373555 | 397 | 0.7 | 0.5 | - | 8 | - |
| J17424616 | 412 | - | 0.5 | - | 29 | - |
| J17493002 | 609 | 3.7 | 1.1 | 26 | 40 | 47 |
| J17503157 | 910 | 1.2 | 0.5 | - | 28 | 39 |
| J18083249 | 364 | - | 0.9 | 32 | 15 | 26 |
| J18201818 | 309 | 1.1 | 0.6 | - | 14 | - |
| J1943+0609 | 446 | - | 0.4 | - | 10 | - |
| J2007+0809 | 325 | - | 2.5 | - | 68 | - |
The second observational route comes from a study of the time-averaged polarisation profiles in pulsars. These integrated profiles are extremely stable and thus yield information on the long-term structure of the magnetic field, the average properties of the magnetosphere and the geometry of the star. For example, according to the model of Radhakrishnan & Cooke (1969), the position angle (PA) of the linear polarisation is tied to the magnetic field in the vicinity of a magnetic pole and therefore changes in a well-defined manner as the beam of the pulsar sweeps past our line of sight. In principle, this allows the geometry of the star to be determined, but this is difficult in practice for two main reasons (Everett & Weisberg, 2001). Firstly, discontinuous jumps in PA are observed in many pulsars; these jumps are generally close to and have been associated with emission from orthogonally polarised modes (Manchester et al., 1975; Backer et al., 1976; Cordes & Hankins, 1977; Cordes et al., 1978), hereafter OPM. Single-pulse studies, supported by the statistical model of Stinebring et al. (1984) and later McKinnon (1997) and McKinnon & Stinebring (1998), showed that the observed polarisation can be explained to some degree by superposed rays in orthogonally polarised states (Karastergiou et al., 2002). The superposition of such rays results in the total intensity being the sum of the OPM intensities and the linear polarisation being the difference in linear polarisation in each mode. Secondly, the longitude over which emission occurs is usually very small and additional, non-orthogonal deviations in the PA swing are often seen. These are likely due to propagation effects in the pulsar magnetosphere.
Average polarisation profiles have also been used to characterise the various components which make up the pulse profile. Rankin (1983a, b, 1986) used average profiles to classify components as core or cone, which have different total power and polarisation properties. Lyne & Manchester (1988) confirmed the differences between component types, but saw no reason to advocate different emission mechanisms for each type. Rankin also concluded that, on average, significant circular polarisation is only seen in core components, a conclusion disputed by Han et al. (1998). Also, single pulse studies have since shown significant circular polarisation in cone components (Karastergiou et al., 2003; Karastergiou & Johnston, 2004).
The frequency dependence of the integrated profile properties has been a research area for many years. In the southern hemisphere, the average polarisation profiles of strong pulsars have been obtained at 400, 600 and 1612 MHz, and presented in a series of papers (Hamilton et al., 1977; McCulloch et al., 1978; Manchester et al., 1980) with later observations at 800 and 950 MHz (van Ommen et al., 1997). Observations at higher frequencies have generally been confined to pulsars visible from the northern hemisphere (e.g. Morris et al., 1981; von Hoensbroech & Xilouris, 1997; von Hoensbroech et al., 1998). There are three broad generalisations that can be made about the frequency evolution of pulsar profiles. First, the total power profiles tend to be more complex at high frequencies as outrider components become more prominent compared to the central component (Rankin, 1983a). Secondly, the percentage polarisation generally decreases as the frequency increases (Manchester et al., 1980; Morris et al., 1981). Finally, the OPM phenomenon also becomes more prevalent at higher frequencies (e.g. Karastergiou et al., 2002), which is thought to be the result of strong diffraction effects that occur lower in the pulsar magnetosphere (e.g. Petrova, 2001).
Many new pulsars have been discovered since the end of the 1980s, rather few of which have observed polarisation profiles. We have conducted observations in full polarisation of 48 southern pulsars at 3.1 GHz originating from the Johnston et al. (1992) and Edwards et al. (2001) surveys, to describe total power and polarisation behaviour at this relatively high radio frequency. Some of the pulsars from the Johnston et al. survey have been published in full polarisation, mostly by Qiao et al. (1995, hereafter QMLG) at 1.4 GHz. No published polarisation profiles of the pulsars discovered by Edwards et al. exist to date. We draw a comparison between our current observations and the QMLG observations where appropriate.
2 Observations
All observations were carried out with the 64-m radio telescope located in Parkes, Australia. A total of 50 h of observing were obtained in the period 2004 Jan 24 to Jan 27 at a central observing frequency of 3094 MHz. The observations were made using a dual 10/50 cm receiver (see Granet et al. 2004 for a description of the feed). The system has orthogonal linear feeds and cryogenically cooled preamplifiers, giving a system equivalent flux density on cold sky of 49 Jy. A signal can be injected at an angle of 45∘ to the feed probes for calibration purposes.
Data were recorded using the wide-band pulsar correlator. A total bandwidth of 1024 MHz was used. Channel bandwidths were 1 MHz and there were typically 1024 phase bins across the pulsar period. The data were folded on-line for an interval of 60 s and written to disk. Total integration times were either 30 or 60 min depending on the flux density of the pulsar. These observations were made during a phase when the correlator was still being commissioned. Unfortunately, some of the observations suffer from artifacts caused by the hardware. In particular, Stokes sometimes has ‘saw-tooth’ (non Gaussian) baselines and also shows extended ‘shoulders’ before and after the profile peaks as can be seen in some of the Figures (e.g. PSR J13196056). These artifacts do not affect the other Stokes parameters and have little overall impact on our results.
Flux calibration was obtained by observations of Hydra A which is assumed to have a flux density of 20.95 Jy at 3100 MHz. Polarisation calibration was carried out by observing a pulsed signal of known polarisation prior to each observation of a pulsar. Differential gain and delay between the two feed probes could then be accounted for. Off-line processing used the PSRCHIVE software application Hotan et al. (2004) specifically written for analysis of pulsar data. Faraday rotation measures, where known, were applied to the data after calibration.
|
|
|
|
|
|
|
|
|
|
|
|
|
|
|
|
|
|
|
|
|
|
|
|
|
|
|
|
|
|
|
|
|
|
|
|
|
|
|
|
|
|
|
|
|
|
|
|
3 Polarimetric Profiles
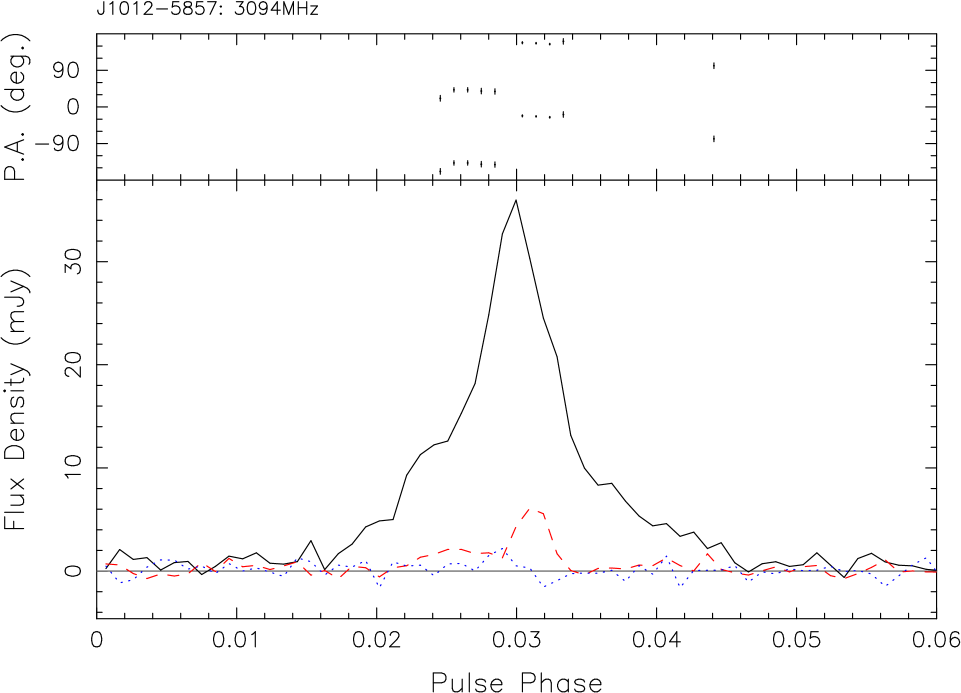
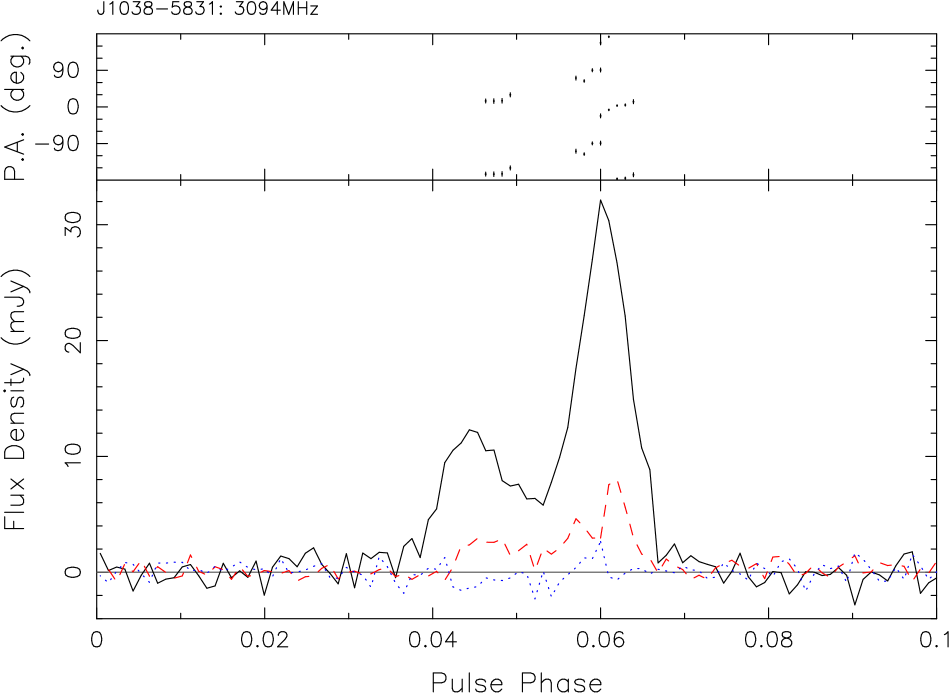
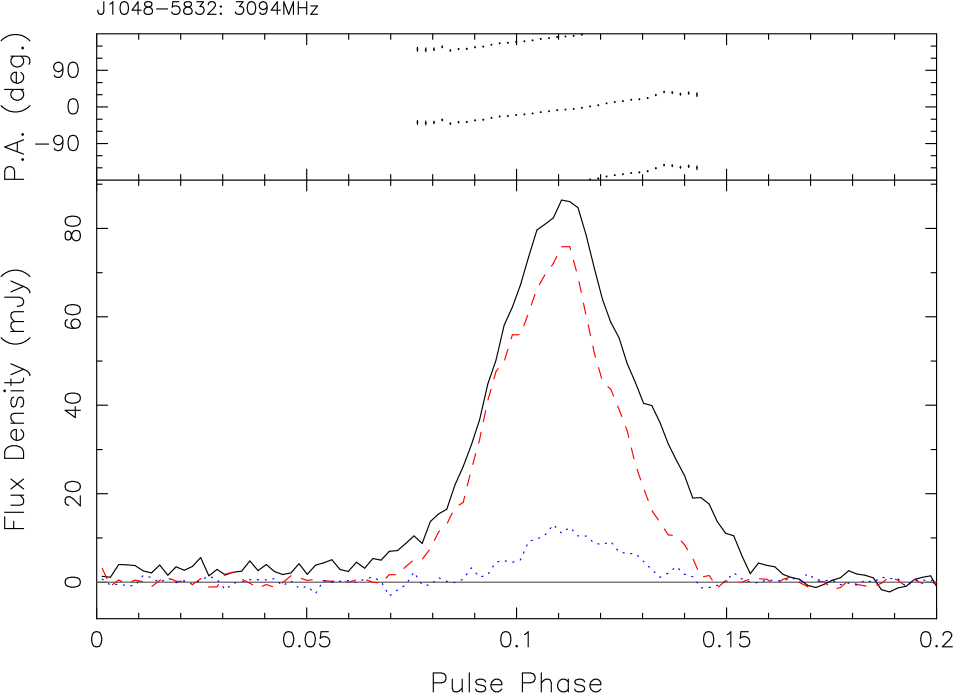
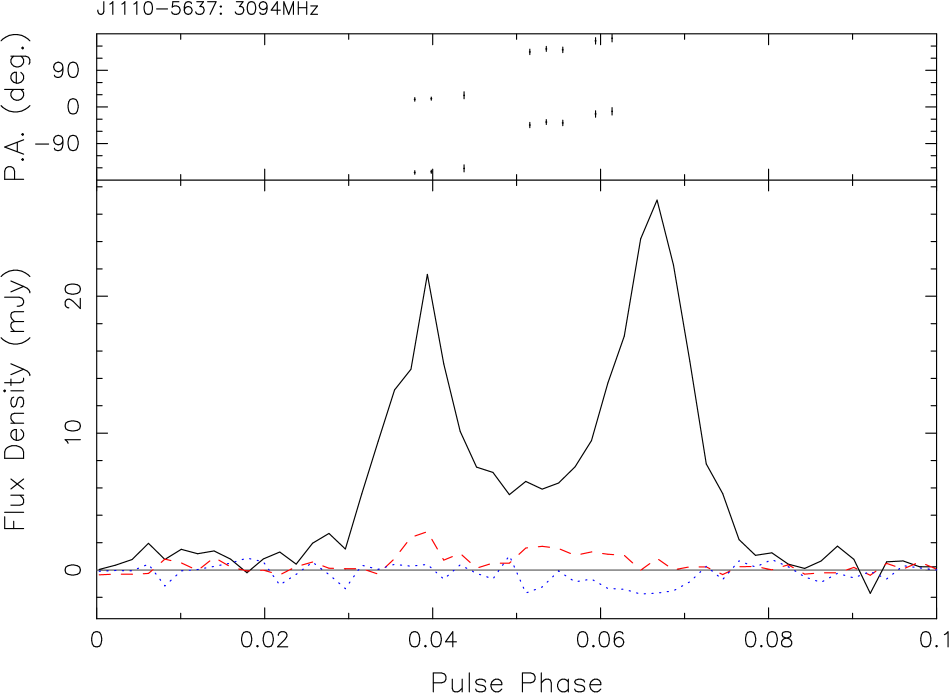
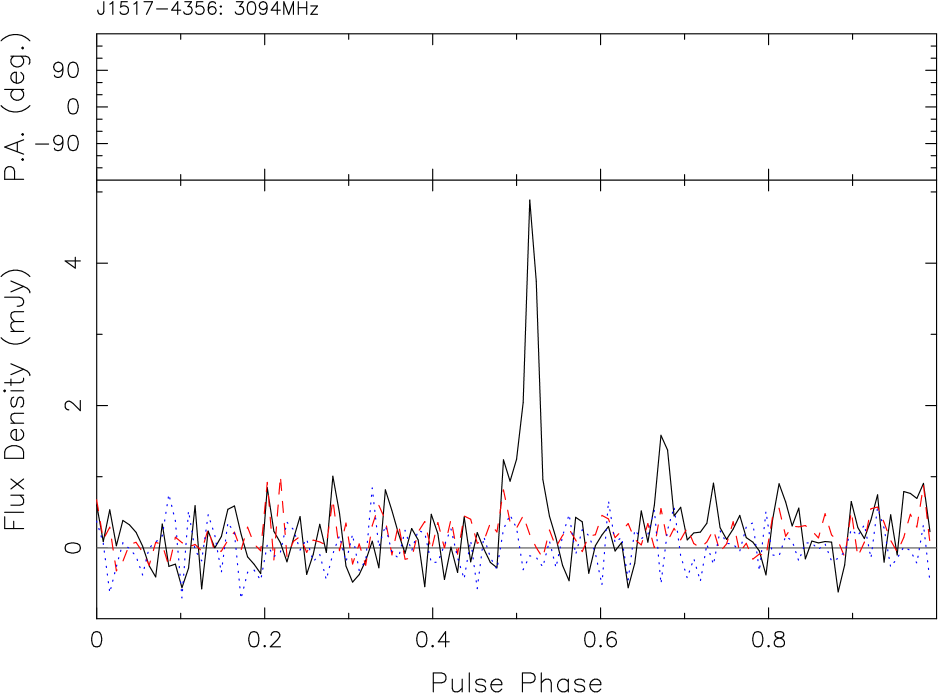
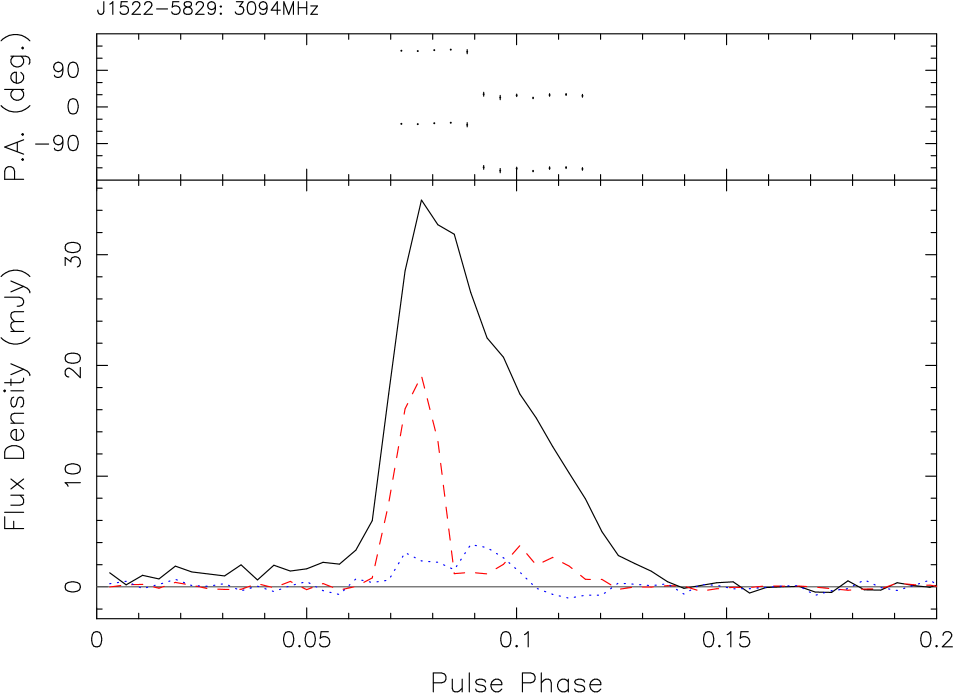
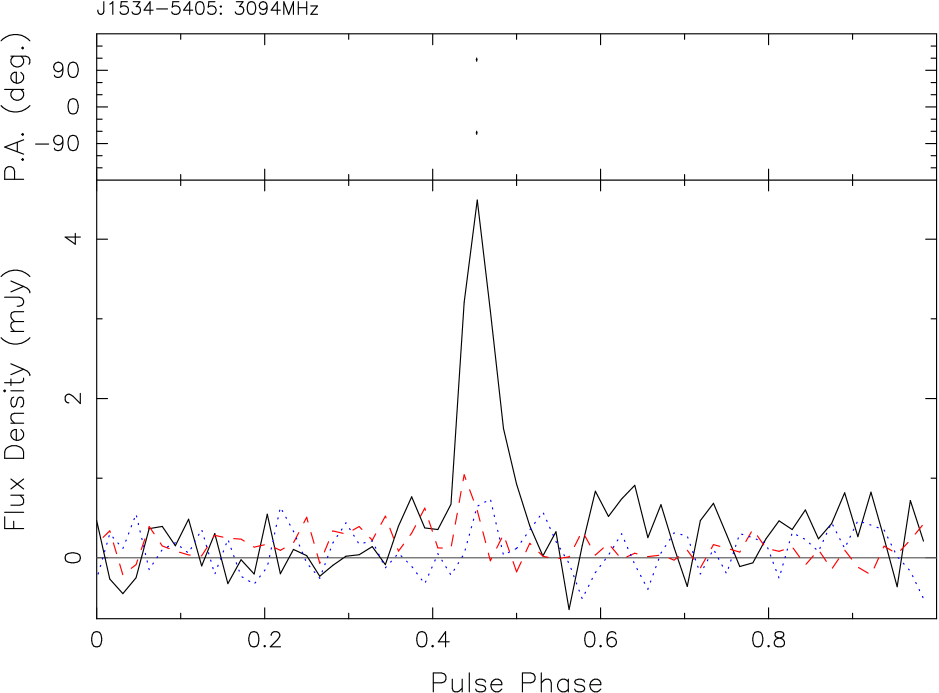
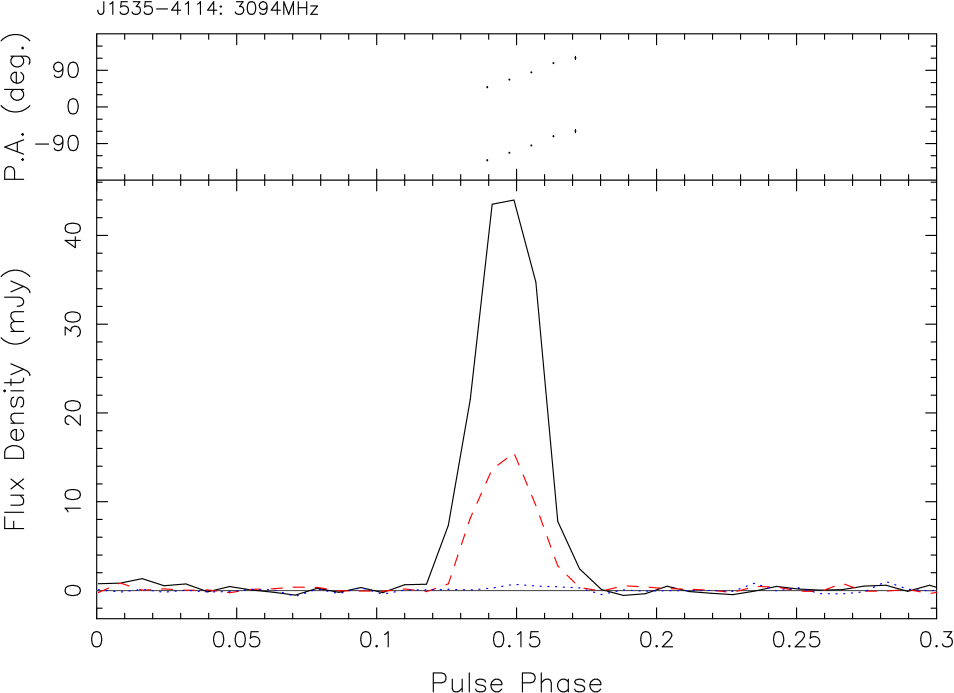
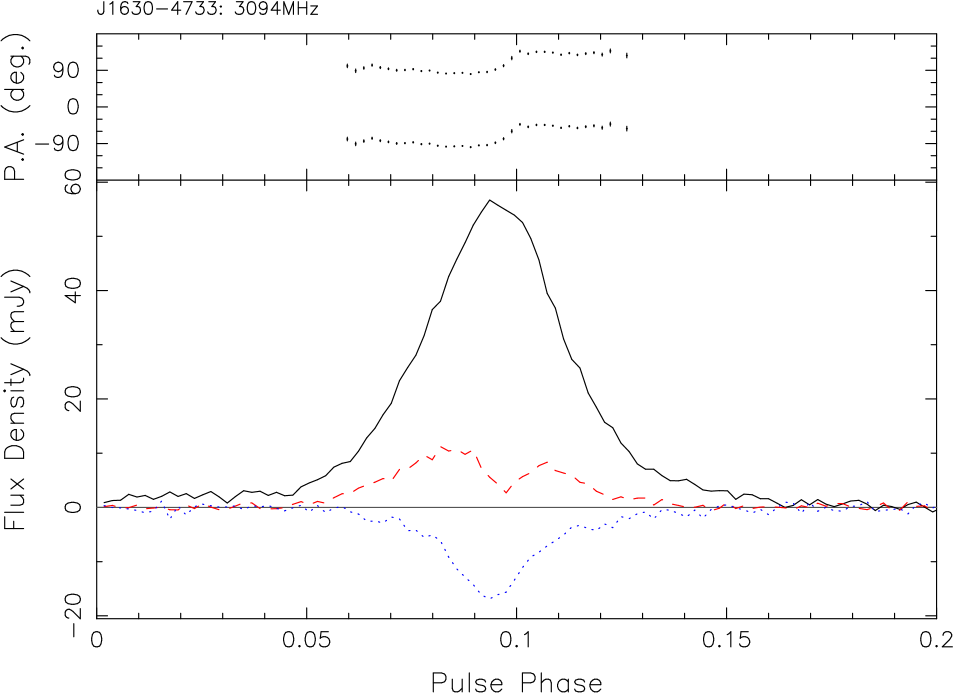
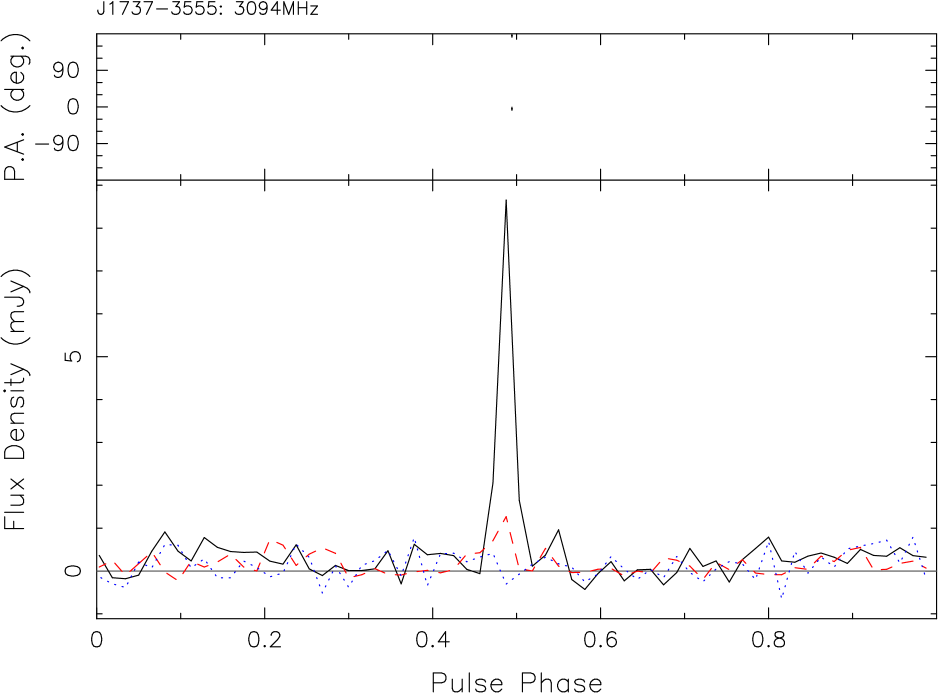
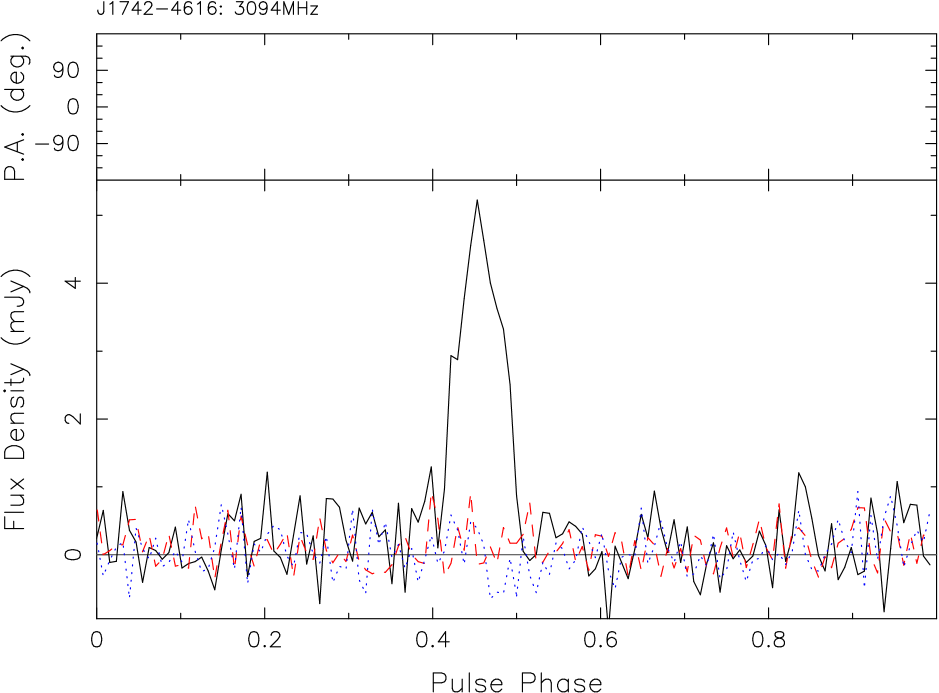
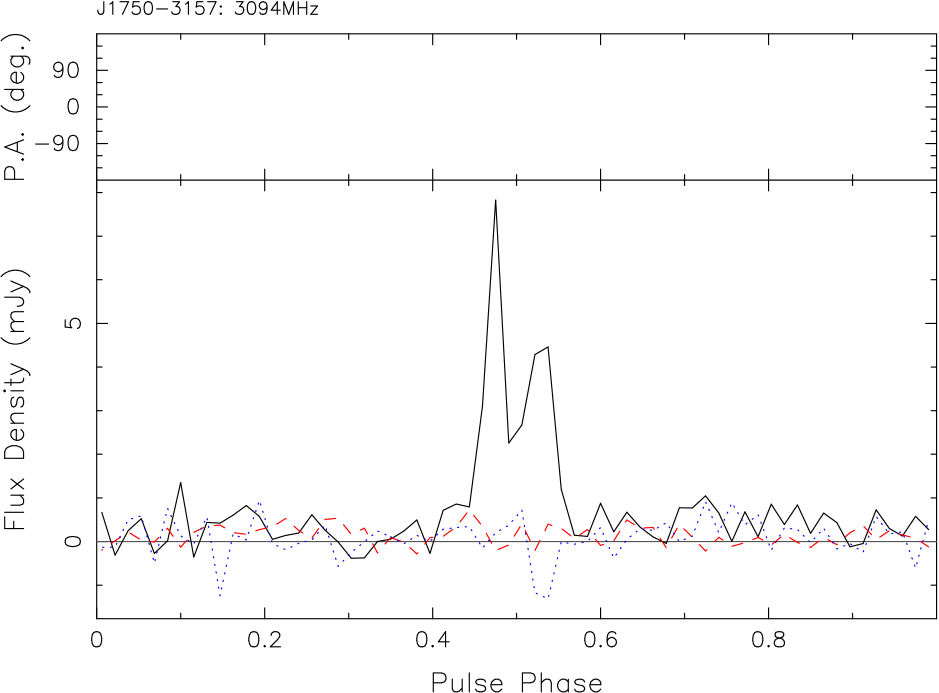
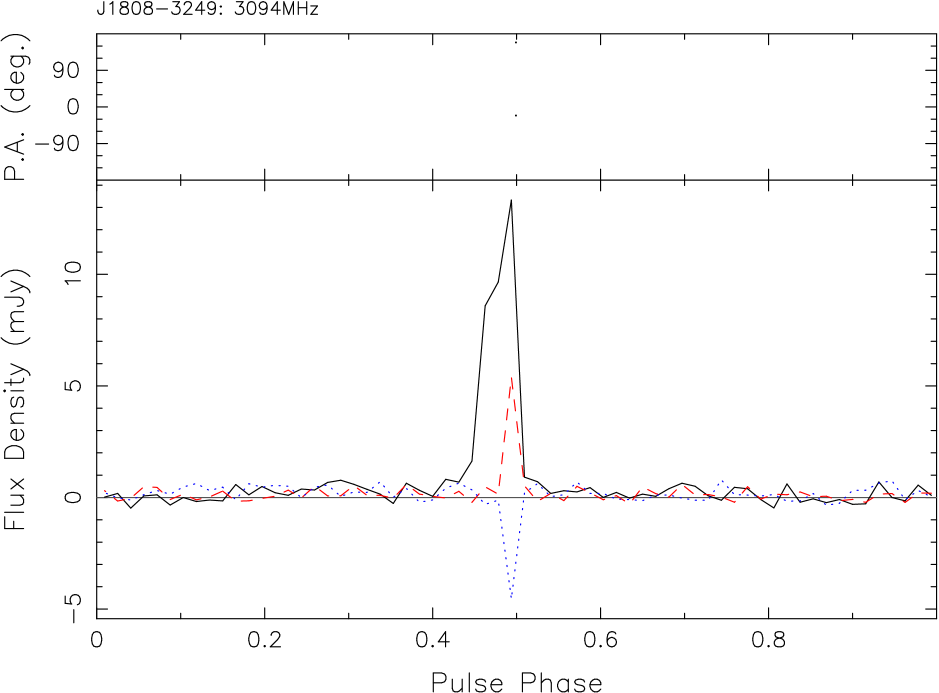
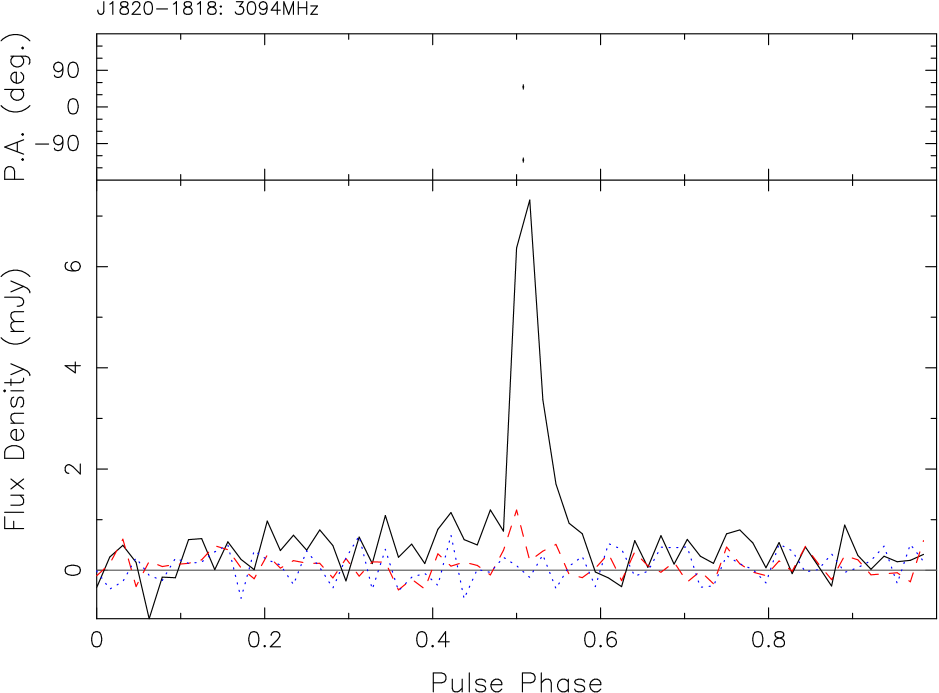
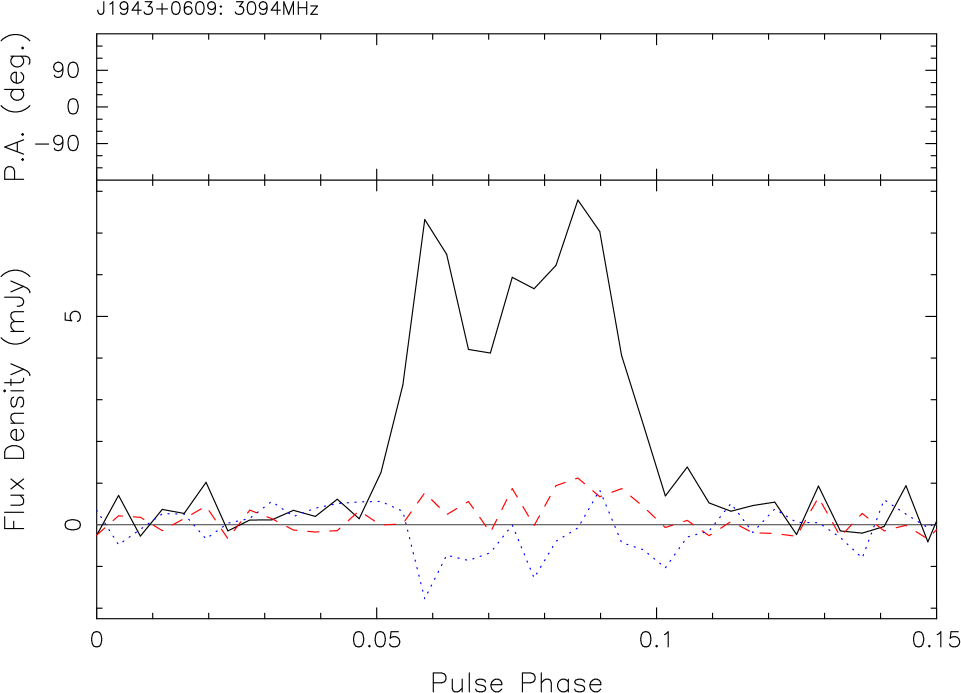
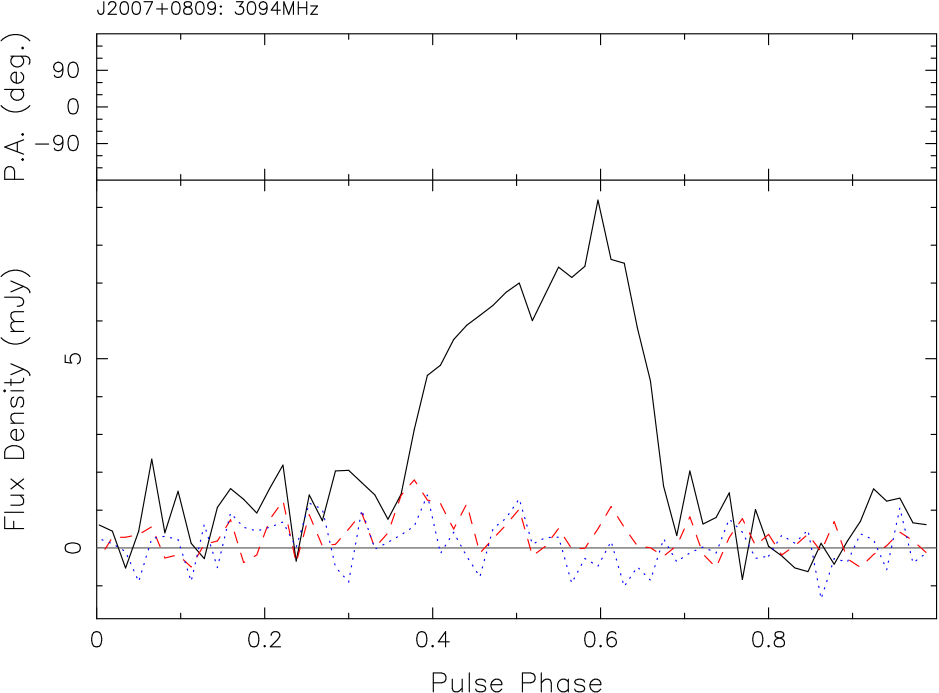
The pulsars we observed at 3.1 GHz are listed in Table 1 along with their periods and continuum flux densities at 1.4 GHz (Hobbs et al., 2004) and 3.1 GHz. They are generally weak at 3.1 GHz, the brightest being J17213532 with a flux density of 6.4 mJy. The width and average degree of linear polarisation as a fraction of the continuum flux density is also given in the table. However, due to the different dependence on frequency, important changes in the polarisation of individual components may not be paid the attention they merit when using these average values. We present the polarimetric profiles at 3.1 GHz in Figure 1. In the following subsections, we describe the profiles in detail, starting with the highly polarised sources and ending with the sources with low polarisation.
3.1 Highly polarised sources
J10485832. This young pulsar was observed at 1.4 GHz by QMLG, and exhibits a high degree of linear polarisation and almost no circular. The 3.1 GHz profile has, somewhat surprisingly, even higher linear polarisation than at 1.4 GHz, contrary to the usual de-polarisation observed with increasing frequency. There is also significant circular polarisation at 3.1 GHz. It would be useful to follow up this unexpected behaviour with observations at higher frequencies.
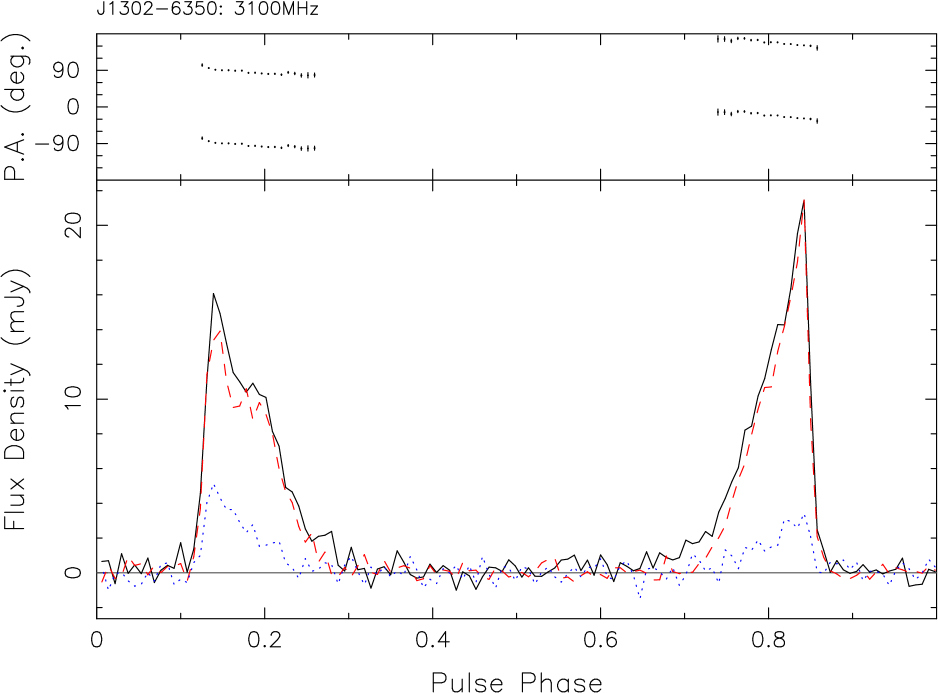
J13026350. This pulsar is well known to have a highly polarised, wide, double profile (Manchester & Johnston, 1995). The 3.1 GHz profile falls nicely between the 2.2 and 4.8 GHz profiles displayed in Wang et al. (2004). Although both components are virtually completely linearly polarised at all frequencies, there is a notable increase in the linear polarisation of the strongest of the two components above 1.5 GHz. The PA profiles at all frequencies are similar, with a negative slope in each component.
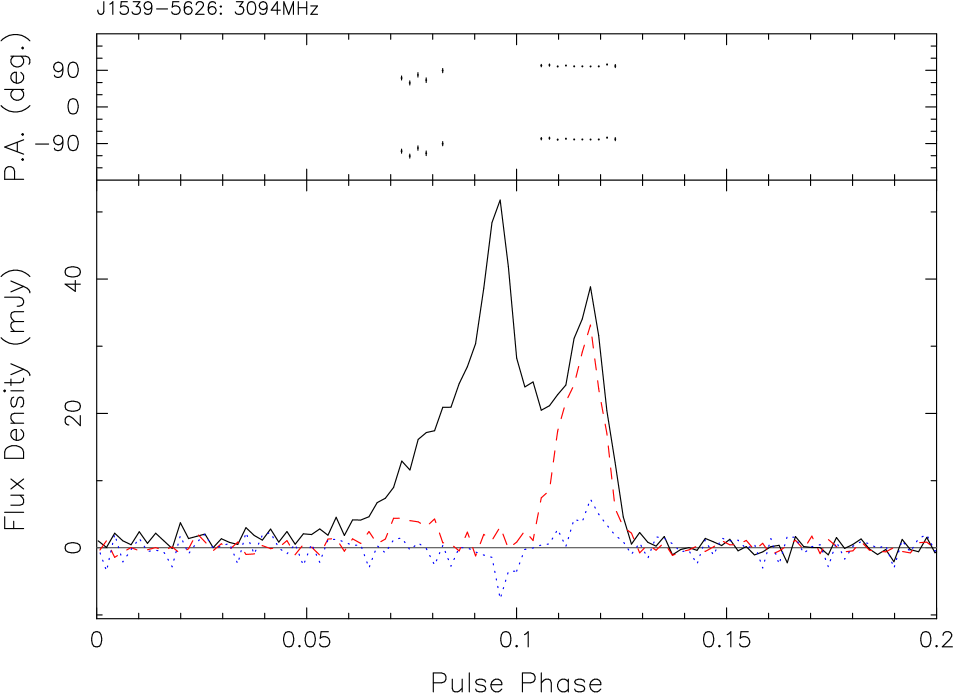
J1539-5626. The profile at 3.1 GHz is complex and consists of at least two components. The trailing component is very highly linearly polarised with a flat PA. There is a swing in the average circular polarisation from right handed in the middle, brightest component, to left handed in the trailing component and the pulse phase of the change in sense coincides with a minimum in linear polarisation. The poor temporal resolution of the 1.4 GHz profile (QMLG) precludes an accurate comparison, but it appears the trailing component is less polarised at the lower frequency.
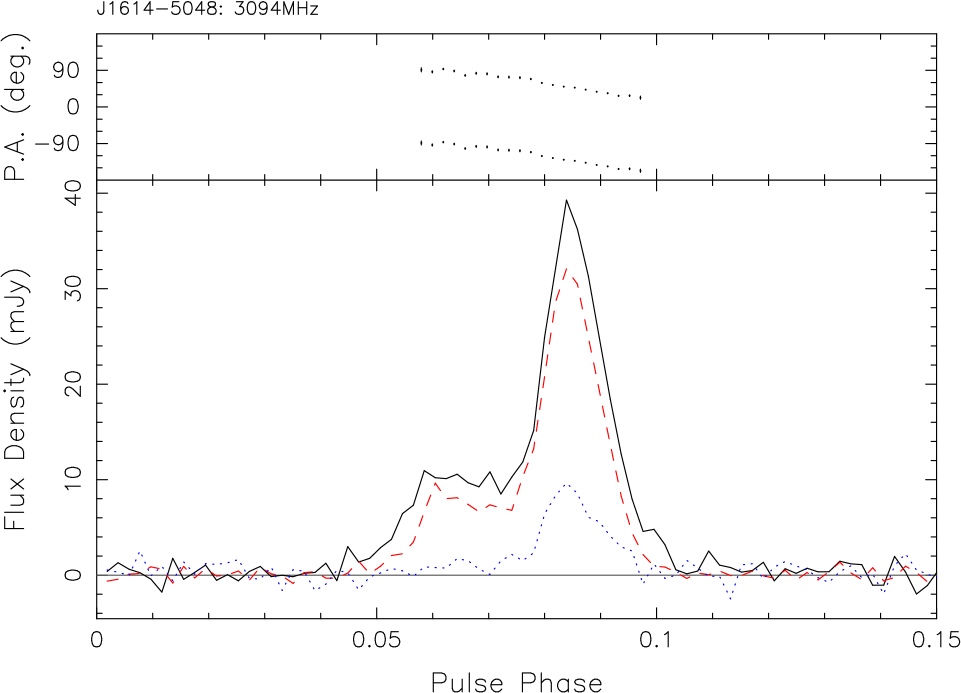
J16145048. At 3.1 GHz the profile consists of two components, both of which are highly linearly polarised. Relatively high circular polarisation is seen in the trailing component. The PA profile has a negative slope across the two bright components. The profile at 1.4 GHz shows only one component (QMLG), which we associate with the trailing component of the 3.1 GHz profile. Intermediate and higher frequency observations of this pulsar are warranted to study the frequency evolution.
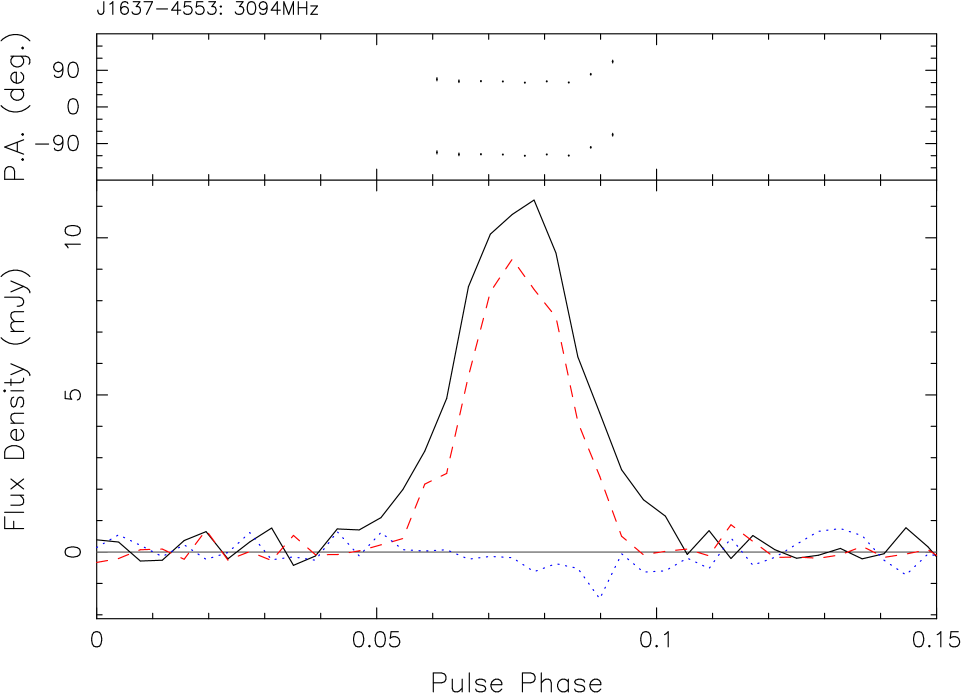
J16374553. The profile of this pulsar, which consists of a single component, exhibits a high degree of linear polarisation at 3.1 GHz, with a flat PA across the pulse. The swing in PA at the trailing edge is common between this profile and unpublished data at 1.4 GHz. The profile also appears narrower in linear polarisation than in total power: the fractional linear polarisation is significantly less at the edges of the profile than in the middle. A small fraction of right-hand circular polarisation is seen.
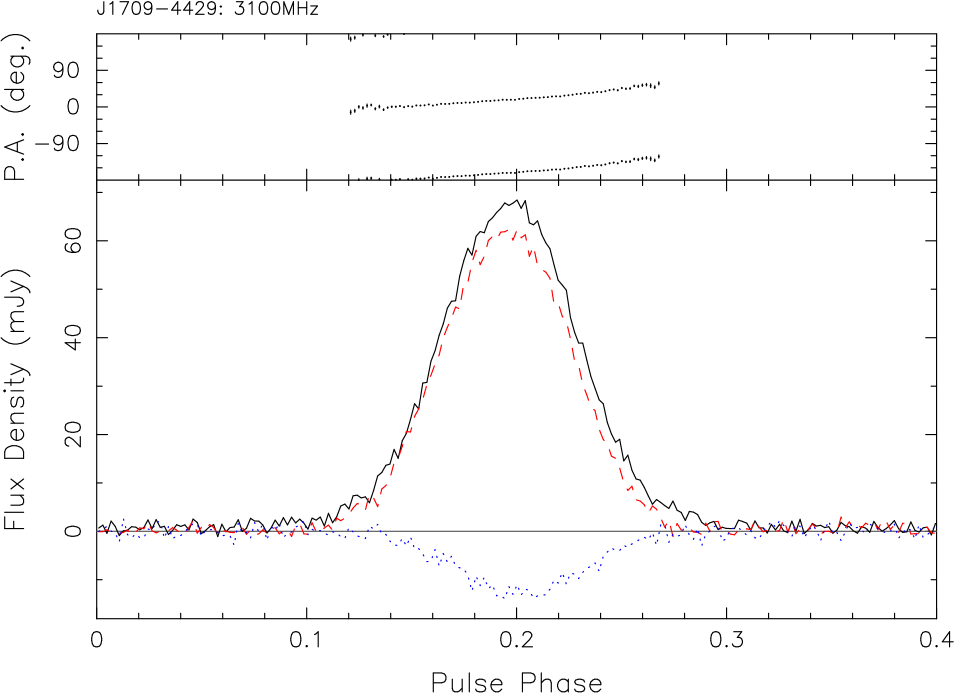
J17094429. High linear polarisation and moderate, right-handed circular polarisation are observed in the mean profile of this young pulsar at 3.1 GHz. The wide single-component pulse is identical to the 1.4 GHz profile in QMLG, with a smooth PA profile of positive slope.
3.2 Moderately polarised sources
J10385831. The linear polarisation is high enough to permit a determination of the PA across most of the pulse. The kinkiness in the PA profile of QMLG at 1.4 GHz can be seen in the 3.1 GHz profile, where it resembles an orthogonal jump. More specifically, just before the peak of the brightest component, the linear polarisation has a sharp dip which occurs simultaneously with a jump of the PA. A comparison of the linear polarisation profiles at 3.1 GHz and 1.4 GHz reveals some de-polarisation at the leading edge of the pulse.
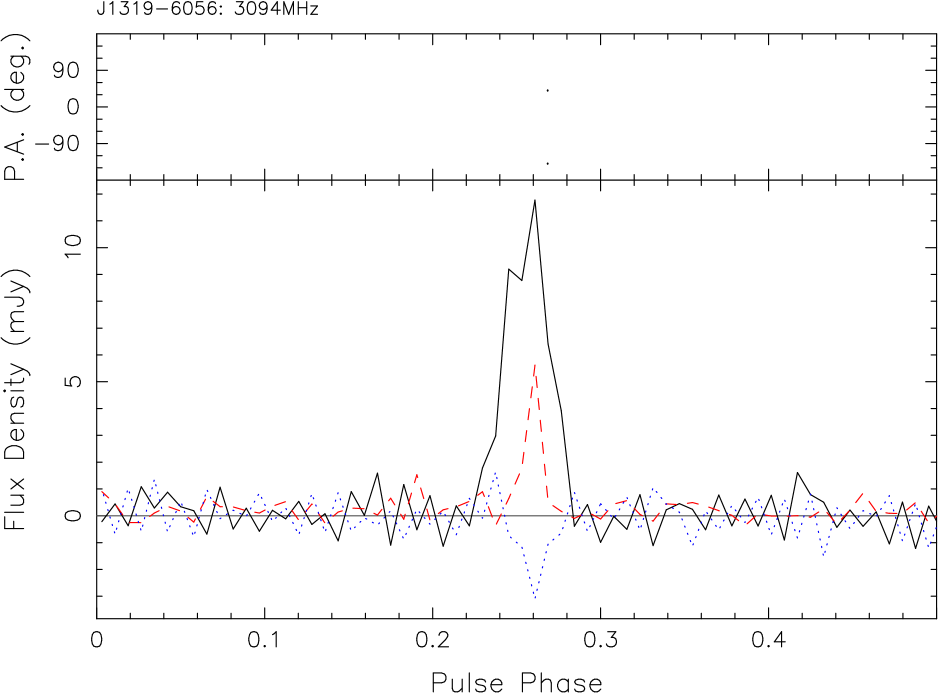
J13196056. The 3.1 GHz profile suggests moderately high degrees of linear and circular polarisation, similar to the 1.4 GHz profile of QMLG.
J14136307. QMLG remark that this pulsar shows no linear or circular polarisation at 1.4 GHz. However, at 3.1 GHz the profile exhibits moderate linear polarisation towards the trailing edge of the pulse. The mean circular polarisation shows a swing of sense from left- to right-handed. The PA follows a smooth curve across the pulse.
J15225829. The leading component of the 3.1 GHz profile is substantially more polarised than its counterpart at 1.4 GHz in QMLG. At 3.1 GHz the PA profile consists of two flat segments, offset from each other, whereas, at 1.4 GHz, the PA profile shows a constant negative slope in both segments. Such differences imply a degree of independence of the PA from the geometry of the pulsar and point towards propagation effects in the pulsar magnetosphere.
J15354114. The moderately high linear polarisation in this pulse profile at 3.1 GHz is characterised by a PA curve with a steep positive gradient. A small amount of left-hand circular polarisation can also be discerned.
J16304733. At 1.4 GHz, the profile of this pulsar is severely scattered. At 3.1 GHz, the high average right-hand circular polarisation resembles the total power profile. The linear polarisation consists of two components, with a small swing at the pulse phase of the local minimum in linear polarisation.
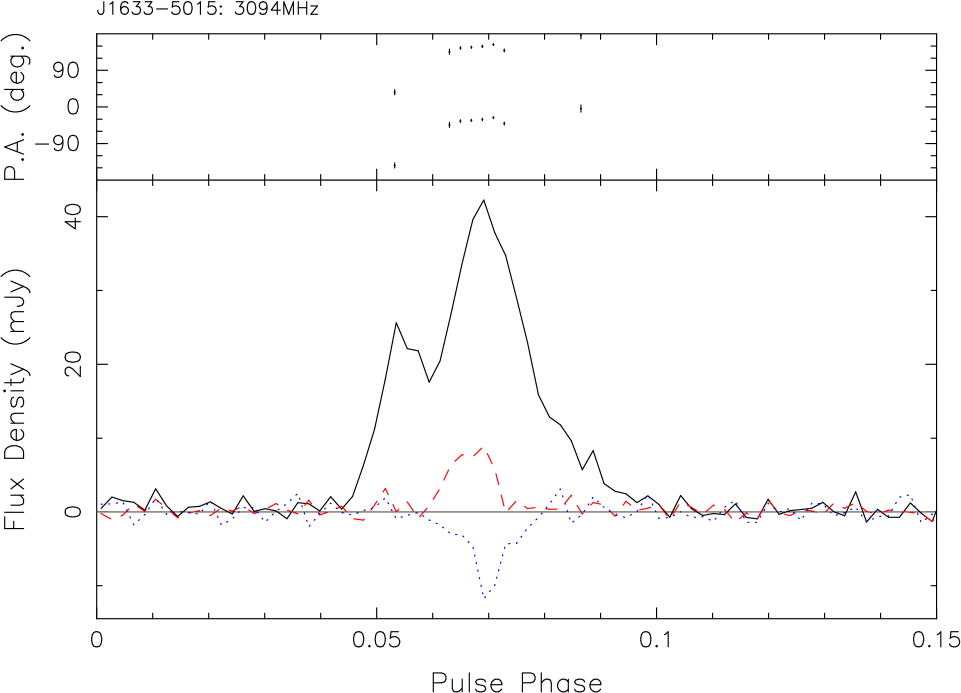
J16335015. At 1.4 GHz, the single-component profile of this pulsar has both high linear and circular polarisation (QMLG). At 3.1 GHz, this component has less linear polarisation. The profile also has a leading component, not seen at 1.4 GHz, which is unpolarised. An orthogonal PA jump can be inferred at the leading edge of the profile, whereas the PA profile is flat over the middle component.
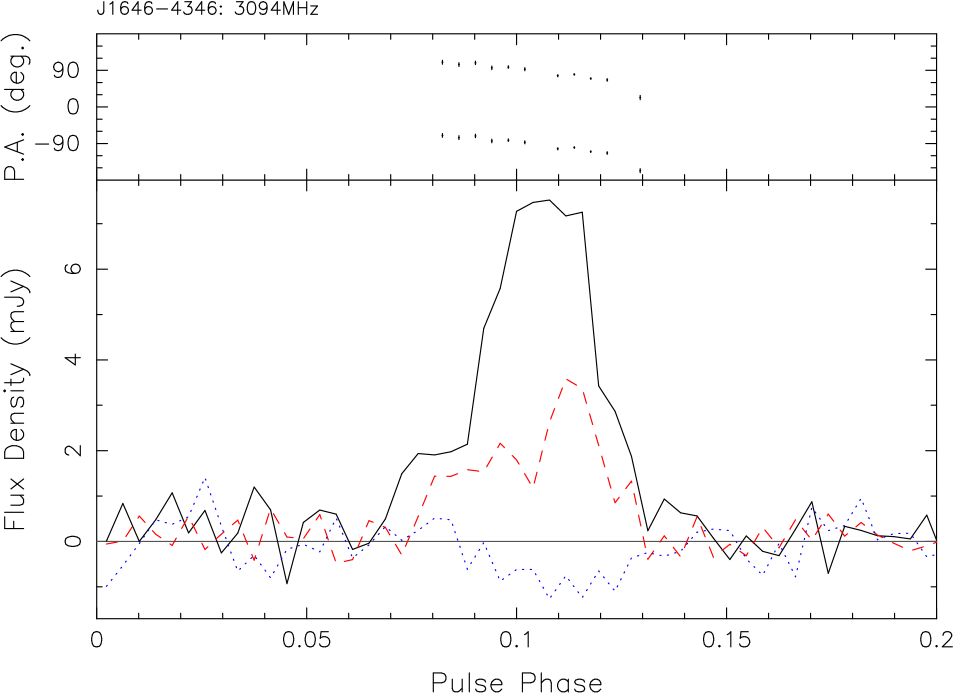
J16464346. This weak pulsar has a profile which consists of multiple components at 3.1 GHz. The degree of linear polarisation is highest at the leading and trailing edges of the pulse, although it remains moderately high under the pulse peak. The PA profile is linear with a negative slope. There is a small amount of right-hand circular polarisation. This pulsar was observed at 1.4 GHz by Crawford et al. (2001). Although weak, it shows similar characteristics to the higher frequency profile with a somewhat higher degree of linear polarisation.
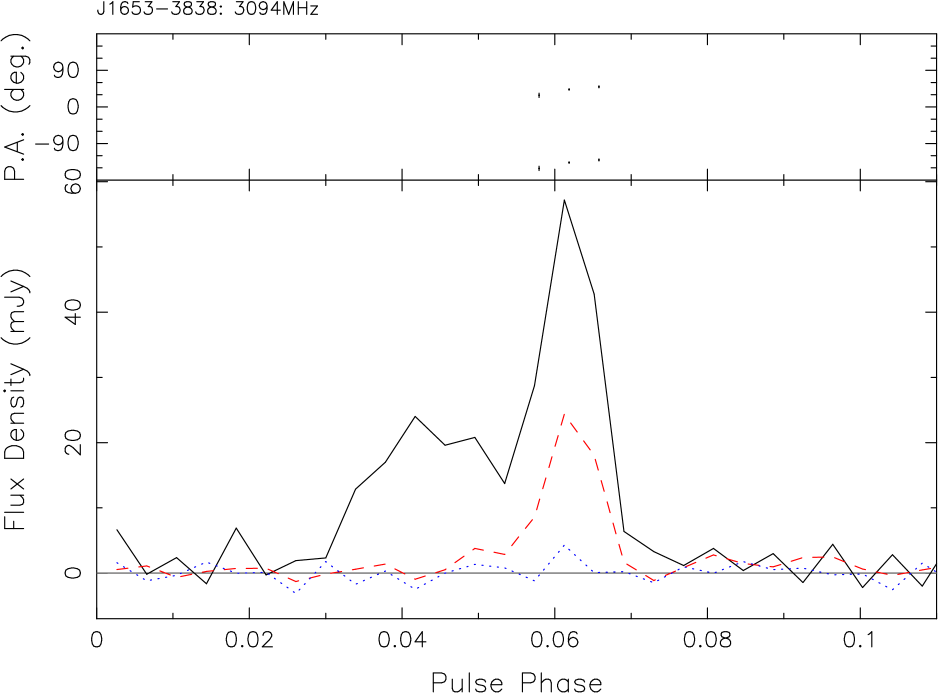
J16533838. The profile of this pulsar at 3.1 GHz shows a moderate amount of linear polarisation in the trailing component, characterised by a slightly rising PA. The leading component is not linearly polarised and the circular polarisation is not significant across the entire pulse. At 1.4 GHz the profile is similar, although there is a high degree of circular polarisation in the trailing component.
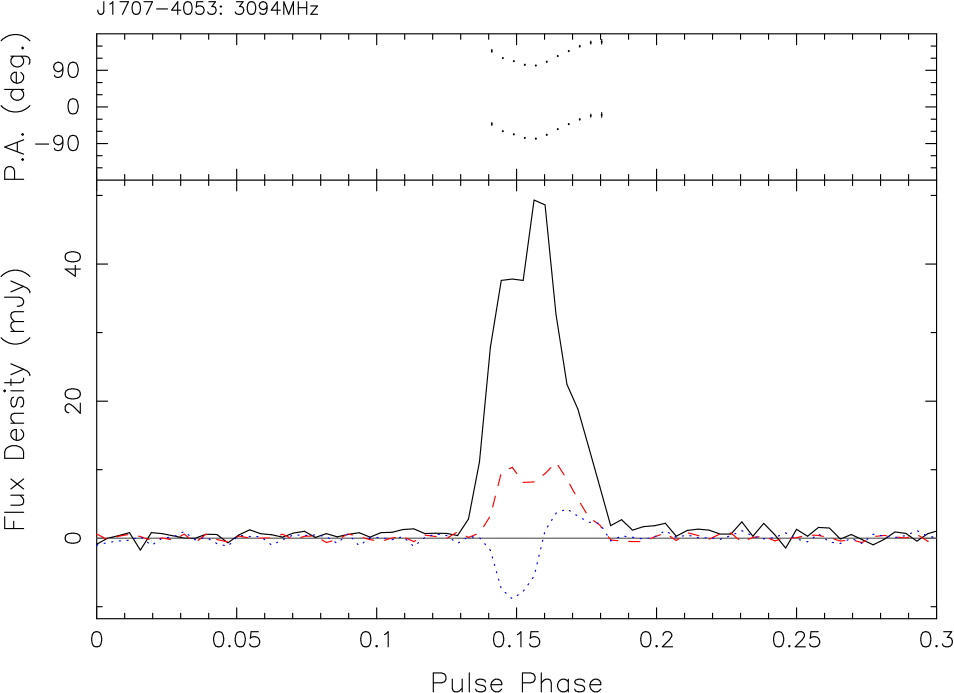
J17074053. The 3.1 GHz profile is characterised by moderate linear polarisation and circular polarisation that swings from right to left handedness. The gradient of the PA profile changes sign at approximately the pulse phase of the profile peak. At 1.4 GHz, the pulse profile is very wide and the PA is flat (QMLG), both most likely caused by interstellar scattering.
J17213532. The total power profile of this pulsar at 3.1 GHz consists of two overlapping components, both with moderately high linear polarisation. Both components can be identified in the scattered 1.4 GHz profile (QMLG), but the trailing one is less linearly polarised at that frequency. The PA profile consists of two, approximately linear segments with a negative slope, each apparently associated to a profile component. There is moderate right-hand circular polarisation across the pulse.
J17333716. Each of the two components of this profile at 3.1 GHz is characterised by a moderate degree of linear polarisation and some right-hand circular polarisation. The PA has a slightly positive slope in the leading component and a slightly negative slope in the trailing component. At 1.4 GHz, the profile looks similar.
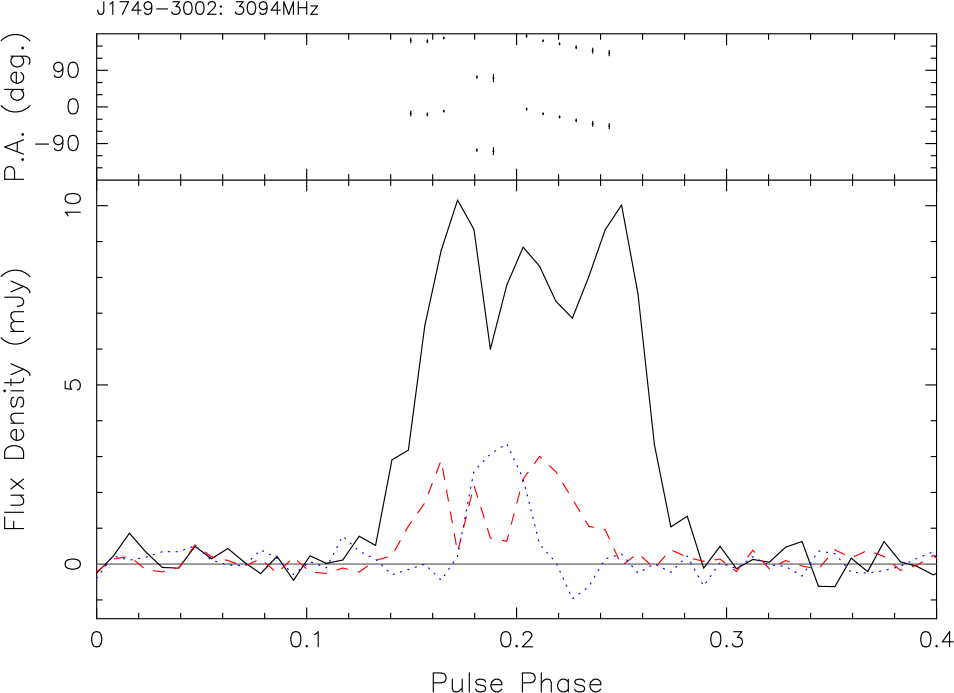
J17493002. A comparison of the total power profile at 3.1 GHz to the 1.4 GHz profile in QMLG, shows that the outriders have flatter spectra than the middle component. At 3.1 GHz, there are two orthogonal PA transitions which coincide with the minima in linear polarisation. The circular polarisation shows a left-handed maximum between the leading and middle components.
J18083249. The profile of this weak pulsar at 3.1 GHz shows equal amounts of linear and circular polarisation in the trailing component.
3.3 Sources with low polarisation
J10125857. At 1.4 GHz, the profile of this pulsar shows no measurable linear and circular polarisation (QMLG). However, at 3.1 GHz, the measured linear polarisation is sufficient to provide a PA profile across the central part of the profile. The PA exhibits a discontinuity just prior to the peak of the total power profile, where the linear polarisation profile also shows a local minimum.
J11105637. At 3.1 GHz there is measurable linear polarisation in the leading and middle parts of the profile and circular polarisation in the trailing component. The PA has a positive slope in both of these components, with a quasi-orthogonal discontinuity. The 1.4 GHz profile of QMLG has poor resolution and signal-to-noise but better quality (unpublished) data shows the 1.4 and 3.1 GHz profiles to be similar.
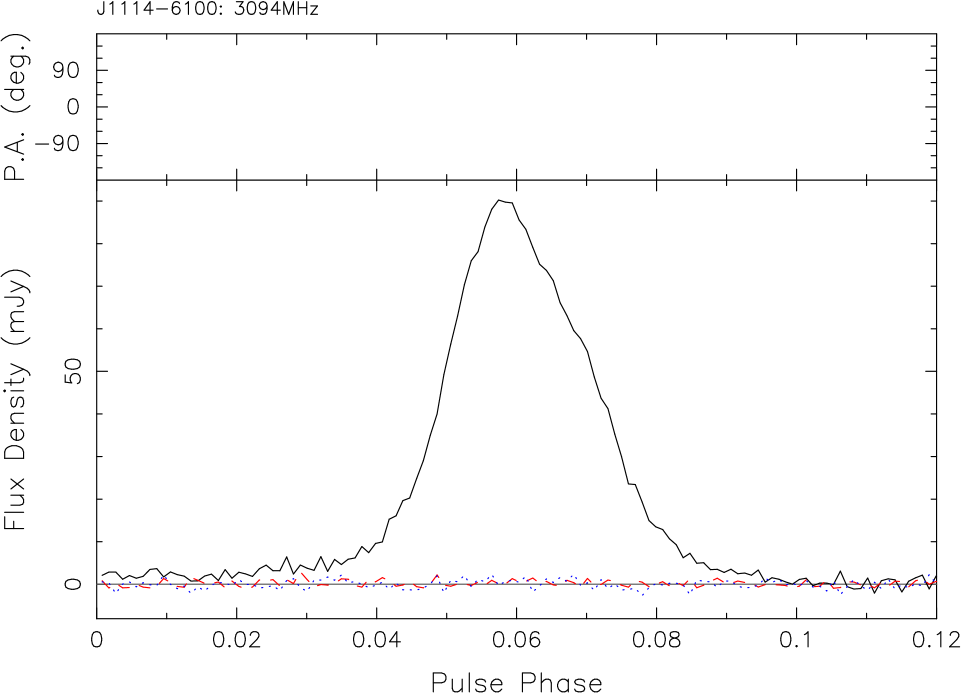
J11146100. The profile of this pulsar at 3.1 GHz resembles the profile at 1.4 GHz. It consists of a single, total power component with no measurable linear and circular polarisation.
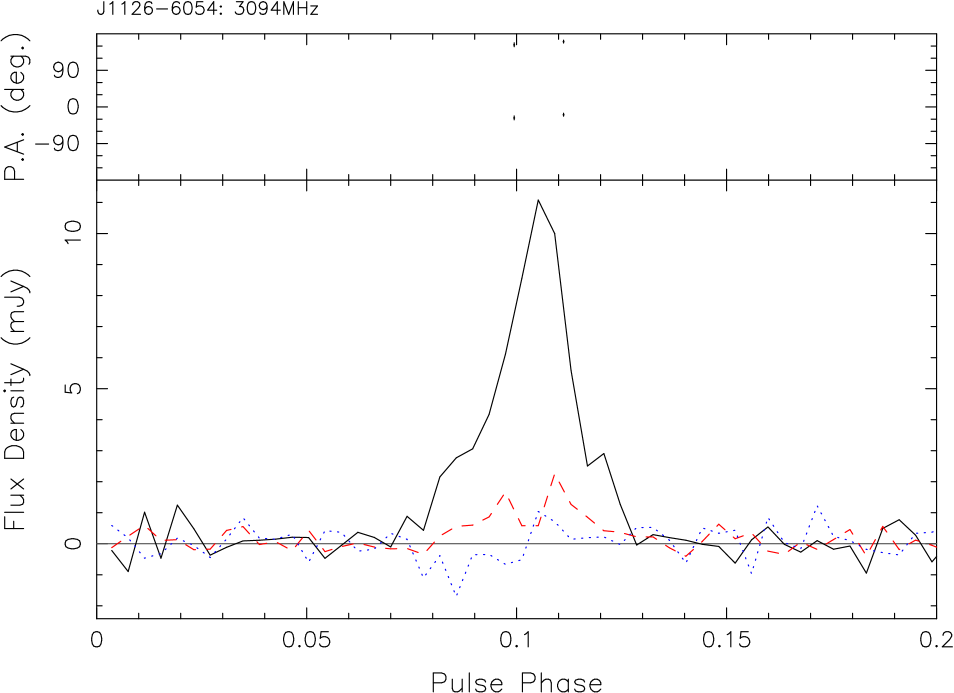
J11266054. The total power profile of this pulsar at 3.1 GHz has more pronounced “outriders” than the 1.5 GHz profile in Johnston et al. (1992). There is a small degree of linear and circular polarisation across the profile. On average, the circular polarisation is right-handed in the leading part of the profile and left-handed in the trailing part of the profile.
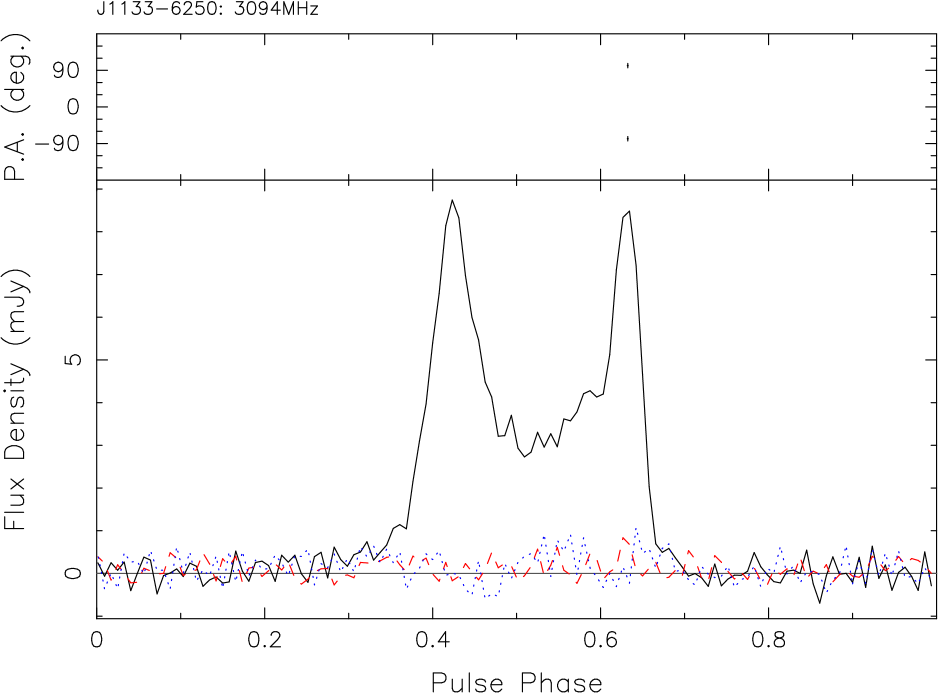
J11336250. This pulsar shows no detectable polarisation at 3.1 GHz and is similar to the 1.4 GHz profile in QMLG, except for the fact that leading component is brighter with respect to the trailing component at 3.1 GHz.
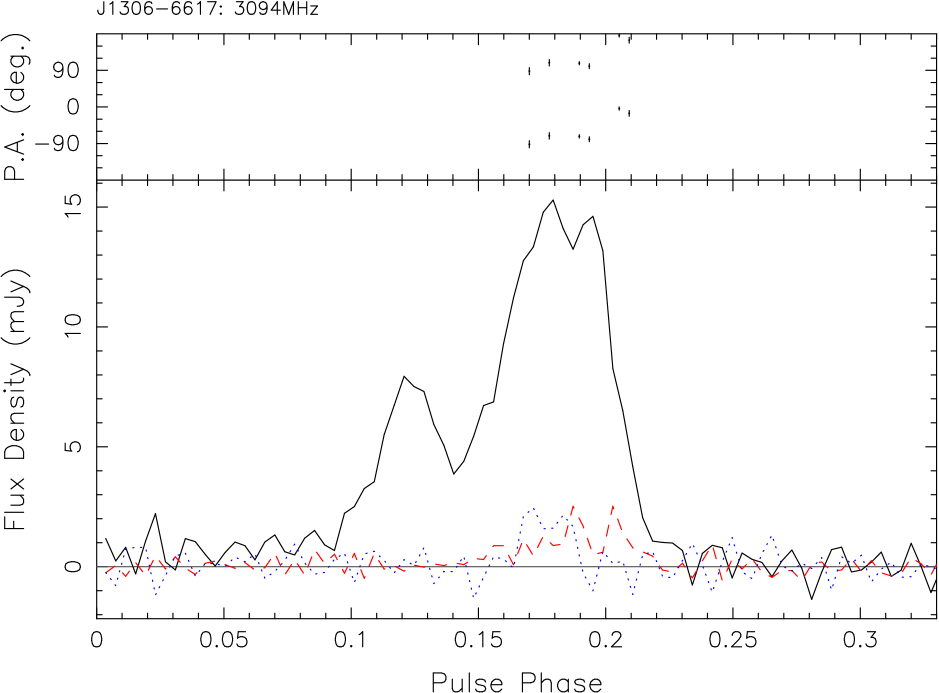
J13066617. There is an orthogonal jump in the PA profile of this pulsar at 3.1 GHz, at the trailing edge of the pulse. Both the total power and the polarisation at 3.1 GHz are similar to the 1.4 GHz profile in QMLG, with minor differences mainly due to different temporal resolution.
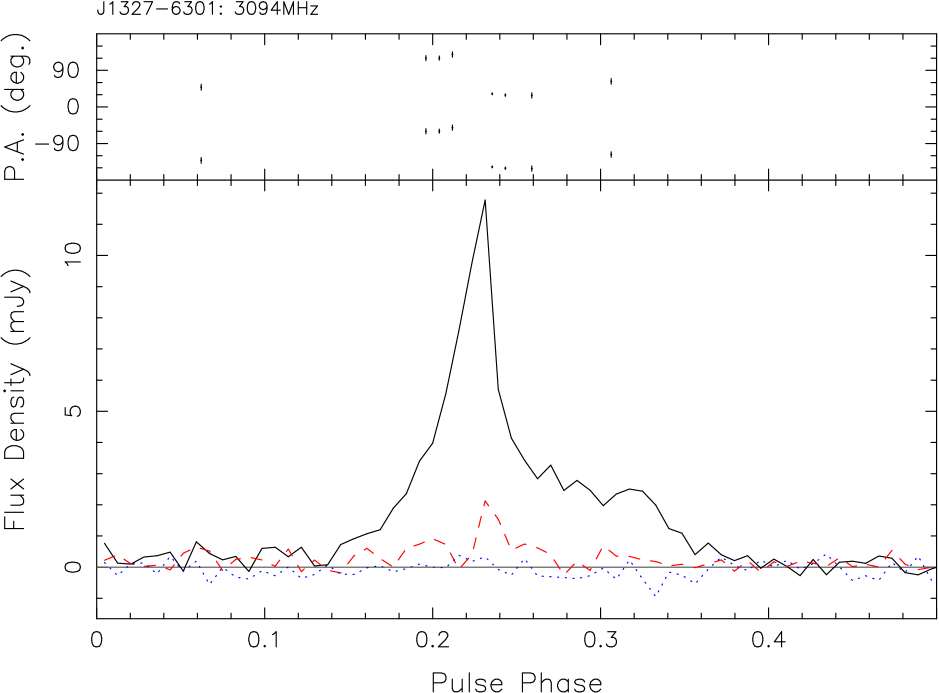
J13276301. The linear polarisation of the pulsar at 3.1 GHz shows a number of local minima. At the pulse phase of the second minimum, there is an orthogonal PA jump. Both linear and circular polarisation are otherwise low across the pulse. At 1.4 GHz, the total power profile looks the same, however, there is significant circular polarisation that swings from left to right handedness.
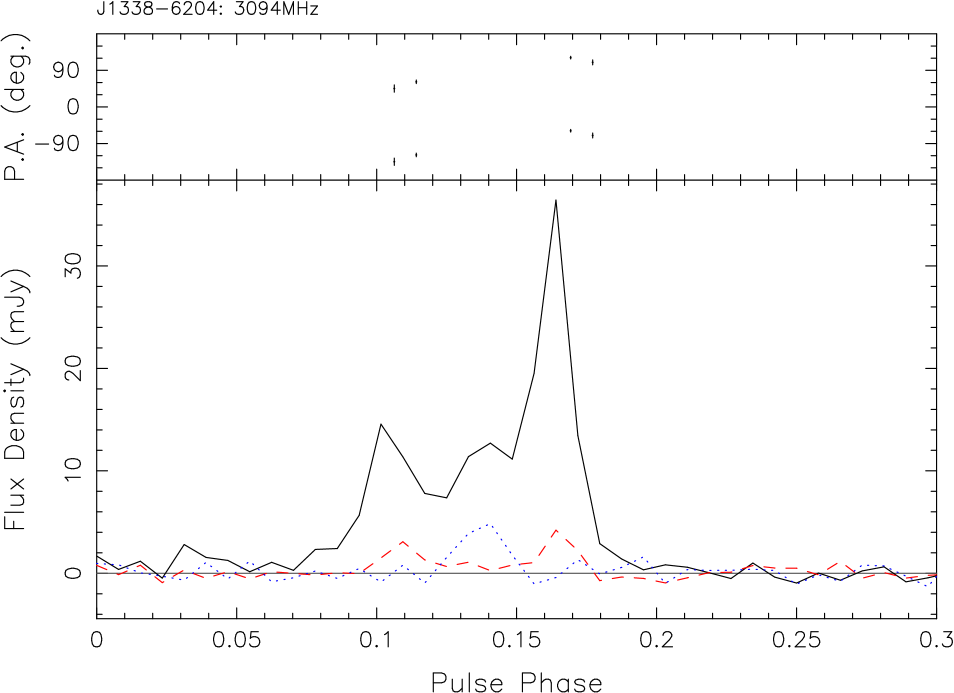
J13386204. This profile consists of a middle component flanked by two outriders. Both the linear and circular polarisation profiles appear symmetrical about the peak of the middle component. A comparison with the 1.4 GHz profile of QMLG demonstrates flatter spectra in the outriders with respect to the middle component. It also reveals an increase in linear polarisation of the trailing component. Also, the PA appears to be ascending in the leading component and descending in the trailing component.
J14107404. The profile of this pulsar is very narrow at 3.1 GHz and only slightly linearly polarised. No significant circular polarisation was observed.
J15125759. The simple total-power pulse is characterised by an absence of linear polarisation at 3.1 GHz. There is a hint that the average circular polarisation may be changing sense shortly after the middle of the pulse.
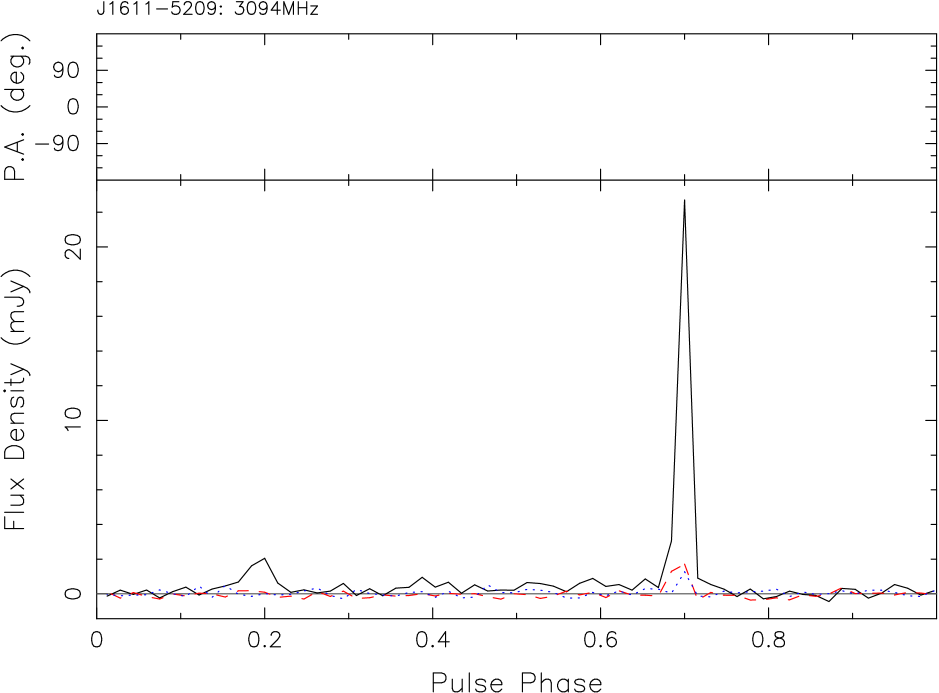
J16115209. At 3.1 GHz, there is an inter-pulse in the profile, exactly away from the strongest peak. There is little linear and circular polarisation detected in the main pulse and none in the inter-pulse. At 1.4 GHz, the linear polarisation of the main pulse is higher and the PA shows a significant swing.
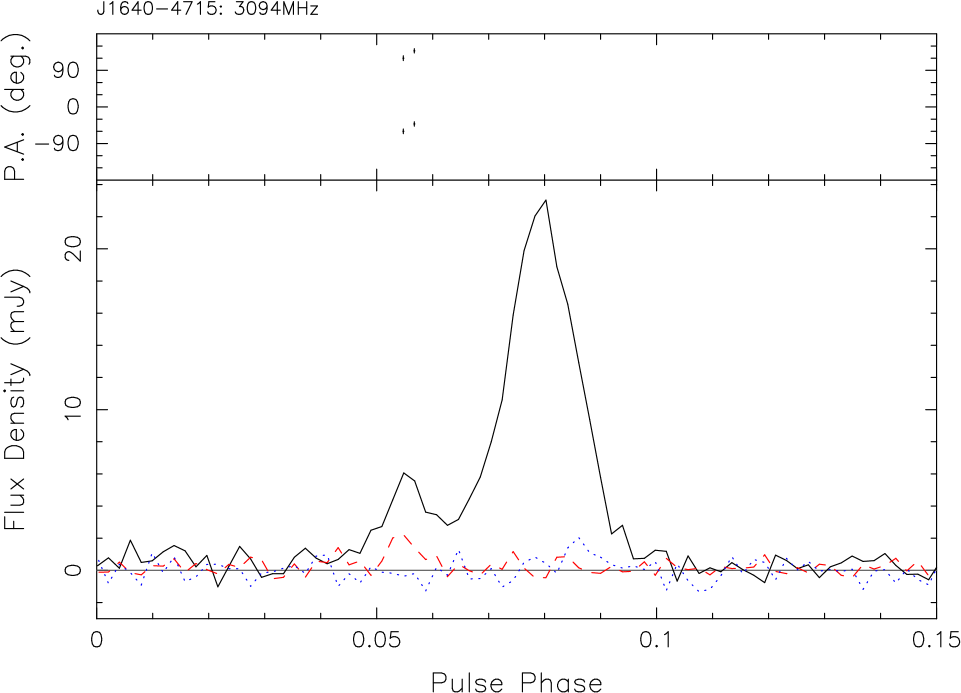
J16404715. The double component profile of this pulsar at 3.1 GHz shows some linear polarisation in the leading, weak component and no linear or circular polarisation in the strong component. The two measured values of PA in the leading component indicate a positive slope.
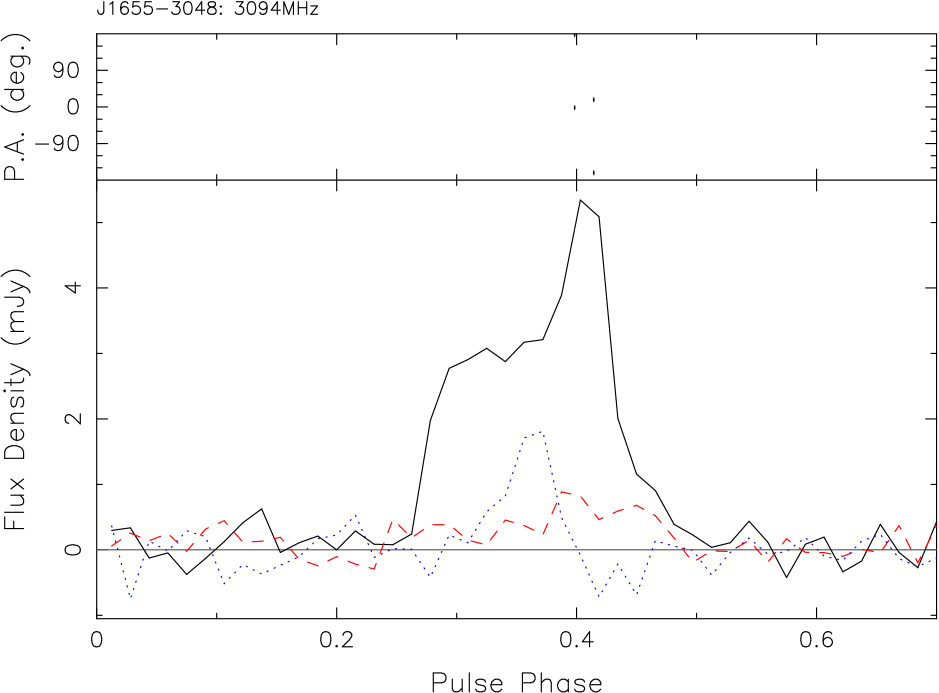
J16553048. Despite being weak at 3.1 GHz, significant left- and right-hand average circular polarisation is observed in this profile. The pulse phase of the change in sense approximately coincides with the peak of the profile. Some linear polarisation is observed towards the trailing edge of the profile.
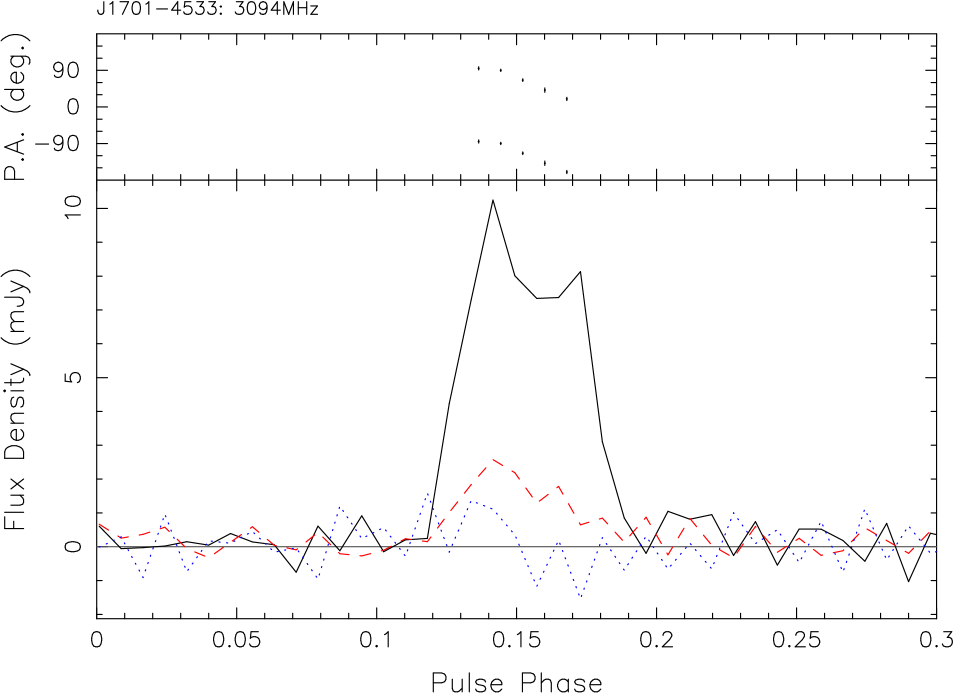
J17014533. The profile of this pulsar at 3.1 GHz resembles the 1.4 GHz profile in QMLG, in that it exhibits small detectable linear and circular polarisation. The PA swing has a negative slope.
J17223632. At 3.1 GHz, this double component profile shows no significant linear polarisation or circular polarisation.
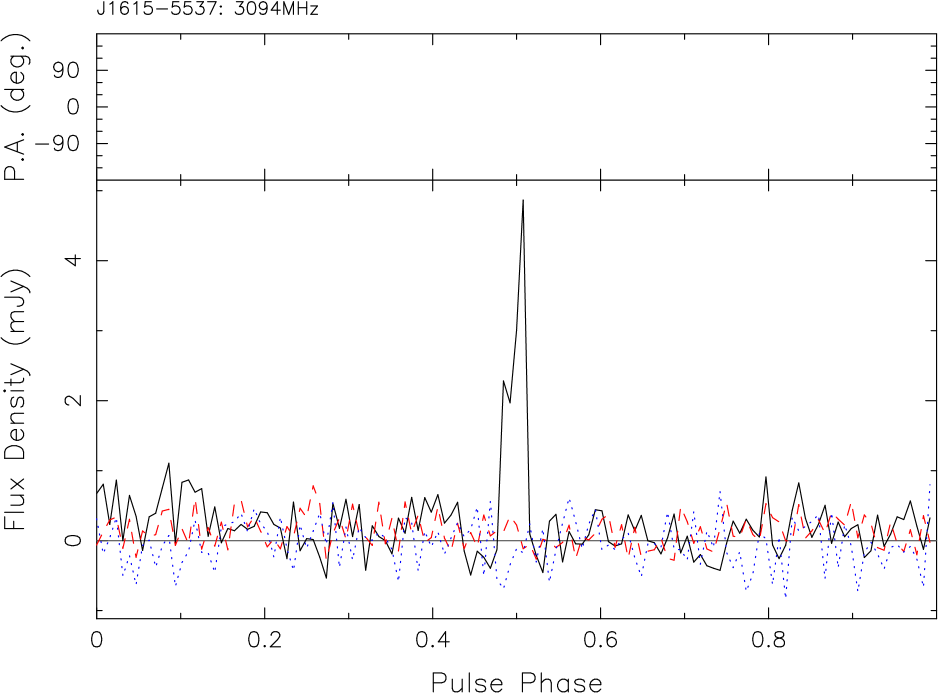
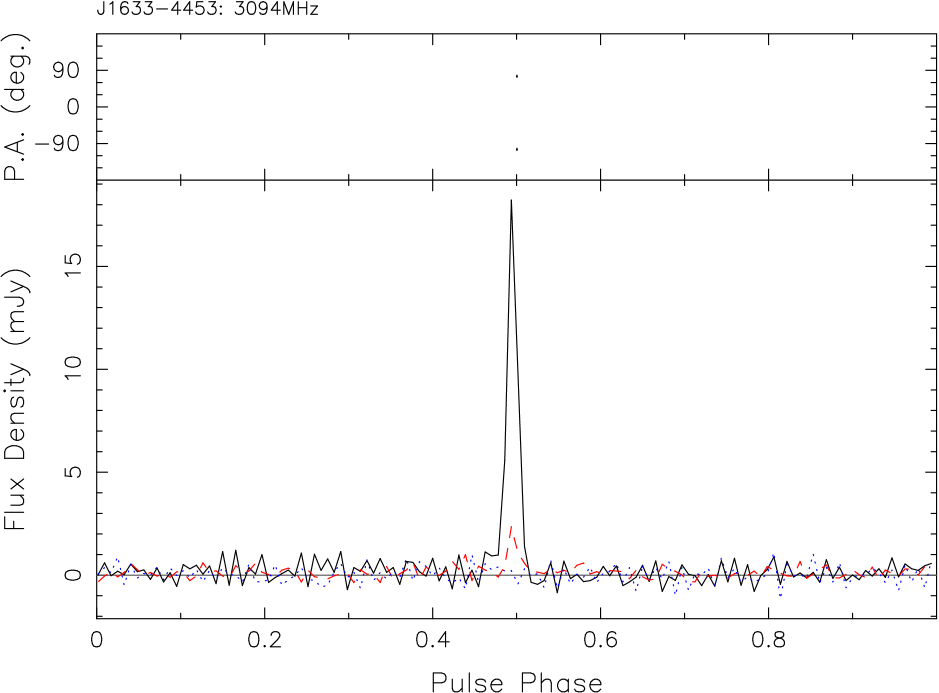
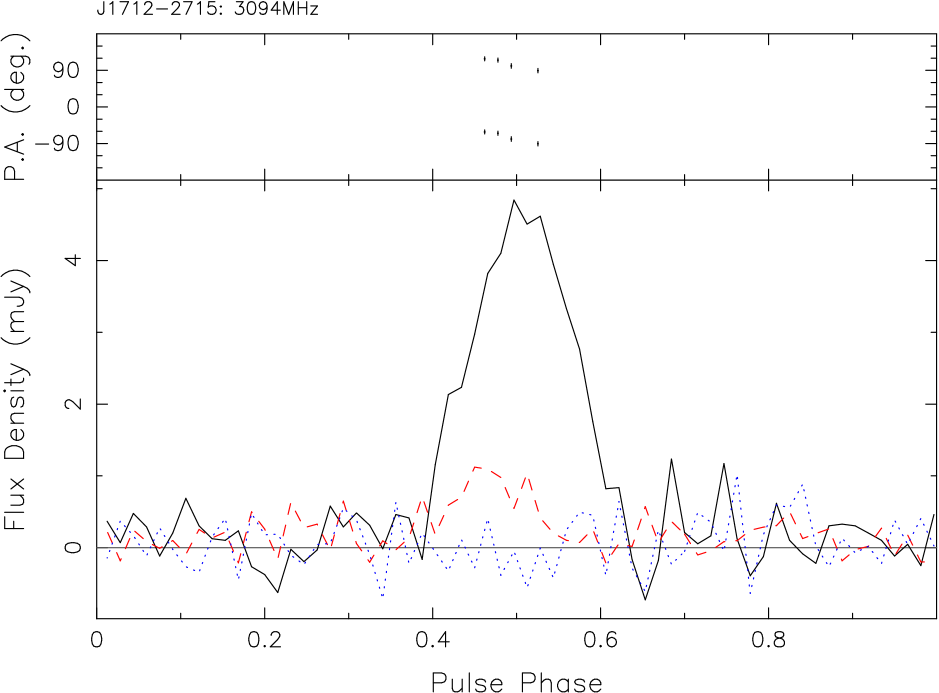
The following pulsars are all weak at 3.1 GHz and their profiles exhibit very little or no detectable polarisation: J13526803, J15174356, J15345405, J16155537, J16334453, J17122715, J17194006, J17373555, J17424616, J17503157, J18201818, J1943+0609, J2007+0809.
4 Discussion

The 48 profiles shown in Figure 1 demonstrate the diversity of polarisation properties seen in pulsars. However, systematic features are also present in the data. A well–known example is the fact that abrupt changes in the PA - often approximately orthogonal jumps - occur at the pulse phase of local minima in the linear polarisation. This suggests that one cause of the general de-polarisation with increasing frequency is the superposition of linearly polarised rays with different planes of polarisation. Also, our observations re-enforce the fact that different components of pulse profiles often exhibit different spectral behaviour. This leads to changes in the overall shape of profiles with frequency beyond that of simple radius–to–frequency mapping expectations, as detailed in Kramer (1994).
We use our results in the context of the model for polarised emission proposed by McKinnon & Stinebring (1998). In that model, the emission consists of two completely polarised modes which are orthogonal to each other. If circular polarisation is ignored then the superposition of these modes at any instant yields the total power (the sum of the intensity of the modes) and the linear polarisation (the difference of the mode intensities). Clearly then, if the mode intensities are roughly equal the linear polarisation is very low; if they are very disparate the linear polarisation will be close to 100 per cent. The question then arises as to how the relative intensities of the modes varies as a function of frequency and/or component type (Karastergiou et al., 2002).
We propose a component classification scheme based on three possible scenarios for the spectral index behaviour of the modes as shown schematically in Figure 2. Note that the sketches are conceptually similar; one mode has a relatively flat spectrum and the other a relatively steep spectrum, that flattens off at low frequencies. In more detail, the scenarios are as follows.
-
1.
The intensity of the flat spectrum mode is always greater than the steep spectrum mode. In this case, the difference between the strengths of the OPM will increase with increasing frequency, which results in higher degrees of linear polarisation at higher frequencies. The total power spectral index is dominated by the mode with the flatter index. Examples from the current work are PSRs J10485832 and J15395626 (high polarisation), J14136307, J15225829 and J17213532 (moderate polarisation) and J10125857 and J13386204 (low polarisation), where an increase of the degree of linear polarisation is seen in individual components at 3.1 GHz compared to 1.4 GHz. PSRs J13026350, J16145048, J16374533 and J17094429 are examples of pulsars in this category which have virtually 100 per cent linear polarisation over a large frequency range. Support for this picture also comes from the fact that many pulsars in this category have rather flat spectral indices, especially those with single–component profiles. The average spectral index of pulsars is 1.8 (Maron et al., 2000); in the current sample, PSRs J10485832, J13026350, J14136307, J17094429 and J17213532 all have spectral indices flatter than 1.0, two pulsars, PSRs J1614–5048 and J1637–4553 have spectral indices of 1.3 and 1.6 and the remaining have complex profiles making it hard to determine individual component spectra.
-
2.
The intensity of the steep spectrum mode is initially greater than the flat spectrum mode and the intersection of the two spectra occurs at a high frequency. The consequence of this is high linear polarisation at low frequencies, decreasing towards higher frequencies as a power-law. Decreasing polarisation with frequency is commonly observed and Xilouris et al. (1995) present evidence for power-law behaviour of fractional polarisation. Under this scenario we predict that the polarisation will eventually increase again at some high frequency.
-
3.
The spectra cross at a frequency near 1 GHz, within the window where the bulk of current observations lie. Then, when observing from low to high frequencies, the linear polarisation should decrease to zero at the frequency of the intersection and increase again beyond that frequency with an associated orthogonal PA jump. The total power spectrum flattens after the intersection point. There exist a number of pulsars with components that show orthogonal PA jumps at around 1 GHz and as such are candidates for this scenario. We intend to investigate their polarisation behaviour over a wide frequency range.
A classification scheme for the polarisation of pulsar profiles was proposed by von Hoensbroech et al. (1998), wherein they recognised examples that constitute both type (i) and type (ii) cases. However, their scheme was based on the global profile properties rather than individual components and was not based on the properties of orthogonally polarised modes. Their observations of PSR B0355+54 at frequencies up to 32 GHz strongly support our picture. In that pulsar, the first component remains highly polarised at all frequencies (i.e. it is of type i), whereas the second component has decreasing polarisation (it is of type ii). The first component has a flatter spectral index than the second component and begins to dominate the profile above 5 GHz exactly as expected in our simple model. Taking the profile as a whole (e.g. Kramer et al., 1996), the spectrum apparently shows a break around 5 GHz but this is simply due to the difference in spectral index between the two components and shows the importance of treating components individually.
Counter-examples to our model may come from the high frequency observations of Xilouris et al. (1996). They present some evidence that the polarisation fraction appears to have a spectral break in some pulsars (e.g PSRs B0329+54 and B1133+16). A direct comparison with our ideas is however difficult as our model is based on individual components whereas their study treated the pulse profile as a whole. In any case, it has been mooted that other factors, such as a loss of coherence (Xilouris et al., 1994), are behind the polarisation effects that are seen at frequencies above 10 GHz, which our model does not account for.
The approach we use is based on the linear polarisation and total power spectra resulting from superposed OPM. In this model, the degree of linear polarisation and the total power are therefore tied at a given frequency. The fact that the highly linearly polarised pulsars described in Section 3.1 have flatter spectra than the average (the spectral indices range from to , compared to the average ) is a good indication of this tie. OPM intensities are frequency dependent, which is well documented from previous studies (Karastergiou et al., 2002), and the theoretical interpretations largely involve propagation effects in the magnetosphere. Our challenge to this picture is if and where there is a well defined frequency at which the OPM spectra cross. We expect different physical conditions determining the OPM spectra for components in the different scenaria of our model. Those differences may be due to the location of the component in the emission region or other parameters, such as age or spin-down energy.
The geometrical elegance of the rotating vector model and its predictions about PA profiles (Radhakrishnan & Cooke, 1969) provide a basis for understanding the profiles observed. A consequence of the PA being determined purely by geometry is that the PA profiles should be identical at all observing frequencies (apart from relativistic effects, see Mitra & Li 2004). A known deviation from the pure geometrical interpretation of the PA comes from the frequency dependence of OPM, with the possibility of offsets in PA between parts of the profile at different frequencies. Also, the PA tends to deviate from the simple model at pulse phases where individual components overlap. In the data presented here, we identify two pulsars with notable differences in the PA profiles that go beyond simple orthogonal (or even non-orthogonal) deviations. PSRs J15225829 and J17074053 show complicated differences in the PA profiles at 3.1 and 1.4 GHz, which suggest new interpretations are necessary. Recent theoretical advances in understanding the effects of strong refraction in the pulsar magnetosphere (Petrova, 2000; Weltevrede et al., 2003) have shown the potential of such effects on the total power profiles, but the exact effects on polarisation are yet to be explored.
Also, there exists an interesting subset of pulsars with a virtually flat PA profile. These pulsars show very high linear polarisation over a wide frequency range and relatively flat spectral index. Many (but not all) are high spin-down, young objects. Most have simple single Gaussian profiles (e.g. PSR J10485832), occasionally two widely separated components are seen (e.g. PSR J13026350). Also, the circular polarisation in these objects tends to have a single handedness. We concur with Manchester (1996) that the components in these young pulsars likely originate far from the magnetic pole.
Acknowledgments
We would like to thank Alex Judge and the staff at the Parkes telescope for help with the observations. The Australia Telescope is funded by the Commonwealth of Australia for operation as a National Facility managed by the CSIRO.
References
- Backer et al. (1976) Backer D. C., Rankin J. M., Campbell D. B., 1976, Nature, 263, 202
- Clemens & Rosen (2004) Clemens J. C., Rosen R., 2004, ApJ, 609, 340
- Cordes & Hankins (1977) Cordes J. M., Hankins T. H., 1977, ApJ, 218, 484
- Cordes et al. (1978) Cordes J. M., Rankin J. M., Backer D. C., 1978, ApJ, 223, 961
- Crawford et al. (2001) Crawford F., Manchester R. N., Kaspi V. M., 2001, A. J., 122, 2001
- Edwards et al. (2001) Edwards R. T., Bailes M., van Straten W., Britton M. C., 2001, MNRAS, 326, 358
- Edwards & Stappers (2002) Edwards R. T., Stappers B. W., 2002, A&A, 393, 733
- Edwards & Stappers (2003) Edwards R. T., Stappers B. W., 2003, A&A, 410, 961
- Everett & Weisberg (2001) Everett J. E., Weisberg J. M., 2001, ApJ, 553, 341
- Granet et al. (2004) Granet C., Zhang H. Z., Forsyth A. R., Graves G. R., Doherty P., Greene K. J., James G. L., Sykes P., Bird T. S., Sinclair M. W., Moorey G., and Manchester R. N., IEEE Antennas and Propagation Magazine, In Press.
- Hamilton et al. (1977) Hamilton P. A., McCulloch P. M., Ables J. G., Komesaroff M. M., 1977, MNRAS, 180, 1
- Han et al. (1998) Han J. L., Manchester R. N., Xu R. X., Qiao G. J., 1998, MNRAS, 300, 373
- Hobbs et al. (2004) Hobbs G., Faulkner A., Stairs I. H., Camilo F., Manchester R. N., Lyne A. G., Kramer M., D’Amico N., Kaspi V. M., Possenti A., McLaughlin M. A., Lorimer D. R., Burgay M., Joshi B. C., Crawford F., 2004, MNRAS, 352, 1439
- Hotan et al. (2004) Hotan A., van Straten W., Manchester R. N., 2004, PASA, 21, 302
- Johnston et al. (1992) Johnston S., Lyne A. G., Manchester R. N., Kniffen D. A., D’Amico N., Lim J., Ashworth M., 1992, MNRAS, 255, 401
- Johnston & Romani (2003) Johnston S., Romani R. W., 2003, ApJ, 590, L95
- Karastergiou & Johnston (2004) Karastergiou A., Johnston S., 2004, MNRAS, 352, 689
- Karastergiou et al. (2003) Karastergiou A., Johnston S., Mitra D., van Leeuwen A. G. J., Edwards R. T., 2003, MNRAS, 344, L69
- Karastergiou et al. (2002) Karastergiou A., Kramer M., Johnston S., Lyne A. G., Bhat N. D. R., Gupta Y., 2002, A&A, 391, 247
- Kramer (1994) Kramer M., 1994, A&AS, 107, 527
- Kramer et al. (1996) Kramer M., Xilouris K. M., Jessner A., Wielebinski R.; Timofeev M., 1996, A&A, 306, 867
- Lyne & Manchester (1988) Lyne A. G., Manchester R. N., 1988, MNRAS, 234, 477
- Lorimer et al. (1995) Lorimer D. R., Yates J. A., Lyne A. G., Gould D. M., 1995, MNRAS, 273, 411
- McCulloch et al. (1978) McCulloch P. M., Hamilton P. A., Manchester R. N., Ables J. G., 1978, MNRAS, 183, 645
- McKinnon (1997) McKinnon M., 1997, ApJ, 475, 763
- McKinnon & Stinebring (1998) McKinnon M., Stinebring D., 1998, ApJ, 502, 883
- Manchester (1996) Manchester R. N., 1996, in Johnston S., Walker M. A., Bailes M., eds, IAU Colloquium 160, Pulsars: Problems and Progress, Astronomical Society of the Pacific, San Francisco, p. 193
- Manchester et al. (1980) Manchester R. N., Hamilton P. A., McCulloch P. M., 1980, MNRAS, 192, 153
- Manchester & Johnston (1995) Manchester R. N., Johnston S., 1995, ApJL, 441, L65
- Manchester et al. (1975) Manchester R. N., Taylor J. H., Huguenin G. R., 1975, ApJ, 196, 83
- Maron et al. (2000) Maron O., Kijak J., Kramer M., Wielebinski R., 2000, A&AS, 147, 195
- Melrose & Luo (2004) Melrose D. B., Luo Q., 2004, MNRAS, 352, 915
- Mitra & Li (2004) Mitra D., Li X. H., 2004, A&A, 421, 215
- Morris et al. (1981) Morris D., Graham D. A., Seiber W., Bartel N., Thomasson P., 1981, A&AS, 46, 421
- Petrova (2000) Petrova S. A., 2000, A&A, 360, 592
- Petrova (2001) Petrova S. A., 2001, A&A, 378, 883
- Qiao et al. (1995) Qiao G. J., Manchester R. N., Lyne A. G., Gould D. M., 1995, MNRAS, 274, 572
- Radhakrishnan & Cooke (1969) Radhakrishnan V., Cooke D. J., 1969, ApL, 3, 225
- Rankin (1983a) Rankin J. M., 1983a, ApJ, 274, 333
- Rankin (1983b) Rankin J. M., 1983b, ApJ, 274, 359
- Rankin (1986) Rankin J. M., 1986, ApJ, 301, 901
- Stinebring et al. (1984) Stinebring D. R., Cordes J. M., Rankin J. M., Weisberg J. M., Boriakoff V., 1984, ApJS, 55, 247
- Taylor et al. (1993) Taylor J. H., Manchester R. N., Lyne A. G., 1993, ApJS, 88, 529
- van Ommen et al. (1997) van Ommen T. D., D’Alesssandro F. D., Hamilton P. A., McCulloch P. M., 1997, MNRAS, 287, 307
- von Hoensbroech et al. (1998) von Hoensbroech A., Kijak J., Krawczyk A., 1998, A&A, 334, 571
- von Hoensbroech & Xilouris (1997) von Hoensbroech A., Xilouris K. M., 1997, A&AS, 126, 121
- Wang et al. (2004) Wang N., Johnston S., Manchester R. N., 2004, MNRAS, 351, 599
- Weltevrede et al. (2003) Weltevrede P., Stappers B. W., van den Horn L. J., Edwards R. T., 2003, A&A, 412, 473
- Xilouris et al. (1994) Xilouris K. M., Kramer M., Jessner A., Wielebinski R., 1994, A&A, 288, L17
- Xilouris et al. (1996) Xilouris K. M., Kramer M., Jessner A., Wielebinski R., Timofeev M., 1996, A&A, 309, 481
- Xilouris et al. (1995) Xilouris K. M., Seiradakis J. H., Gil J. A., Sieber W., Wielebinski R., 1995, A&A, 293, 153