Swift XRT and VLT Observations of the Afterglow of GRB 041223
Abstract
The Swift Gamma-Ray Burst Explorer, launched on 2004 November 20, is a multiwavelength, autonomous, rapid-slewing observatory for gamma-ray burst (GRB) astronomy. On 2004 December 23, during the activation phase of the mission, the Swift X-Ray Telescope (XRT) was pointed at a burst discovered earlier that day by the Swift Burst Alert Telescope. A fading, uncataloged X-ray source was discovered by the XRT and was observed over a period of about 3 hours, beginning 4.6 hours after the burst. The X-ray detection triggered a VLT observation of the optical/NIR counterpart, located about 1.1 arcseconds from the XRT position. The X-ray counterpart faded rapidly, with a power law index of . The average unabsorbed X-ray flux 4.6–7.9 hours after the burst was erg cm-2 s-1 in the 0.5-10 keV band, for a power-law spectrum of photon index with Galactic absorption. The NIR counterpart was observed at three epochs between 16 and 87 hours after the burst, and faded with a power-law index of with a reddening-corrected SED power-law slope of . We find that the X-ray and NIR data are consistent with a two-component jet in a wind medium, with an early jet break in the narrow component and an underlying electron index of 1.8–2.0.
1 Introduction
The Swift Gamma-Ray Burst Explorer (Gehrels et al., 2004) was launched on 2004 November 20 to begin its mission of discovering and studying gamma-ray bursts (GRBs). For over 25 years following their discovery by the Vela satellites (Klebesadel, Strong, & Olson, 1973), GRBs remained one of the greatest mysteries in astrophysics, largely due to a frustrating inability to pinpoint their locations on the sky and to detect any counterparts at longer wavelengths. This situation changed dramatically in February 1997, when the Beppo-SAX satellite discovered the first X-ray afterglow of a GRB (Costa et al., 1997), confirming the predictions of Mészáros & Rees (1997) that X-ray, optical, and radio afterglows are produced by the expanding relativistic fireball that produces the burst itself. By the end of 2004 Beppo-SAX, RXTE, ASCA, Chandra, and XMM-Newton had found 55 X-ray afterglows111http://www.mpe.mpg.de/jcg/grbgen.html. The mission planning requirements of these satellites have typically led to delays of 6 – 24 hours between the burst and the afterglow detection, during which time the afterglow emission fades by many orders of magnitude. The Swift X-ray Telescope (XRT) was designed to fill in the gap by making very early observations of X-ray afterglows, beginning approximately a minute after the discovery of a GRB by the Swift Burst Alert Telescope (BAT).
We report on the first GRB afterglow discovered by the XRT, on 2004 December 23, and on subsequent followup observations in the optical and near-IR bands with the VLT. GRB 041223 was discovered by the Swift BAT instrument at 14:06:18 UT on 2004 December 23 (Tueller et al., 2004). The burst lasted a total of 130 seconds, with most of the emission occurring in a 60 second interval around the main peak. The peak brightness was about erg cm-2 s-1 in the 15–350 keV band (Markwardt et al., 2004). The Swift observatory was still in its check-out and activation phase, and automated slewing had not yet been enabled. The spacecraft was commanded to slew to the position reported by the BAT about 4.6 hours after the burst occurred and XRT observations began immediately following target acquisition (Burrows et al., 2004; Tagliaferri et al., 2004).
2 XRT and VLT Observations
The XRT instrument is described in detail in Burrows et al. (2003) and Burrows et al. (2005). The instrument is designed to obtain automated observations of newly-discovered bursts. However, the XRT was collecting calibration/test data in Photon-Counting mode (similar to Timed Exposure mode on the Chandra/ACIS instrument) under manual control when the slew began, and continued in this same readout mode throughout the slew and the subsequent observation of the GRB field, which began at 18:43:59 UT. The GRB field was observed on three consecutive orbits, with the second and third observations scheduled autonomously on-board. Details of the XRT observations are given in Table 1.
As soon as the X-ray position was communicated via the Gamma-ray burst Coordinate Network (GCN), we initiated VLT observations as part of the MISTICI (Multiwavelength Italian Swift Team and International Co-Investigators) team to look for the near-infrared (NIR) afterglow (Malesani et al., 2004a, b). Observations were carried out with the infrared spectrometer array and camera (ISAAC) installed on the VLT-UT1, starting on 2004 Dec 24 at 06:09 UT (16.1 hr after the GRB). No new objects were found in comparison with the 2MASS catalog. However, the object discovered in the band by Berger et al. (2004) was immediately recognized in our frames, at a brightness below the 2MASS catalog limit. Multi-band observations carried out on the following nights clearly showed that the object was fading, confirming its afterglow nature. -band data were collected using the focal reducer/low dispersion spectrograph (FORS2) installed on the VLT-UT1. The observation log is reported in Table 2.
3 Data Analysis
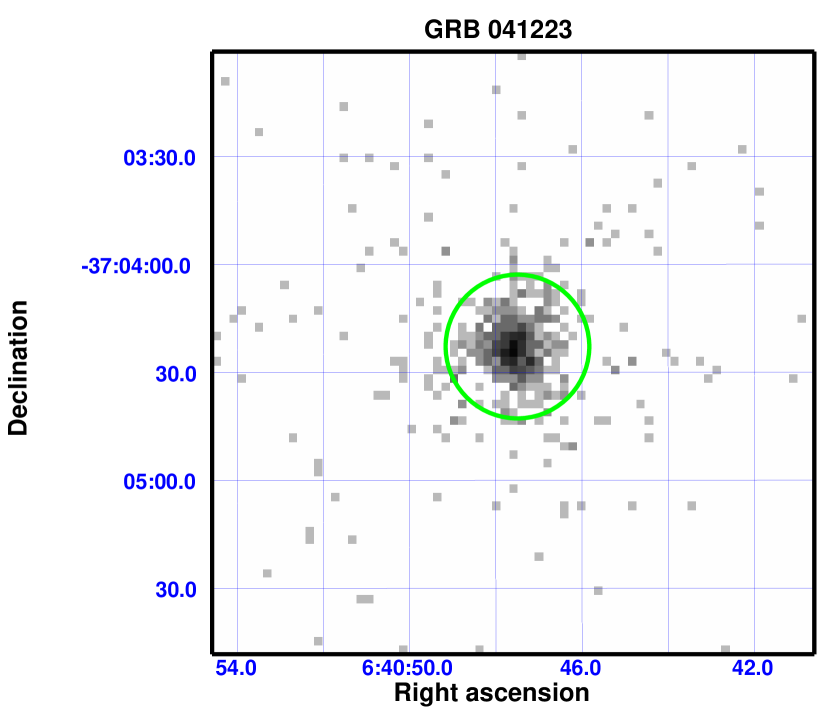
The XRT data were processed by the Swift Data Center at NASA/GSFC to Level 1 data products (calibrated and quality-flagged event lists), which were then further processed by hand, using the XRTDAS software package produced by the ASI Science Data Center. We used XRT event grades 0-4, which provide the best combination of spectral resolution and detection efficiency. Because of the unusual data collection mode, we had to perform several nonstandard data selections to ensure that the data were all taken while the observatory was pointed accurately at the target, and to remove some times with anomalously high background rates. The CCD temperature was between –47.4 and –51.8 C, about 50 degrees warmer than the design temperature due to a failure in the active cooling system. As a result of this high temperature, a large number of hot and flickering pixels are present; these were eliminated by the XRTDAS FTOOL xrthotpix. The total exposure time after data screening was 3518 s. The final 0.2–10 keV image is shown in Figure 1.
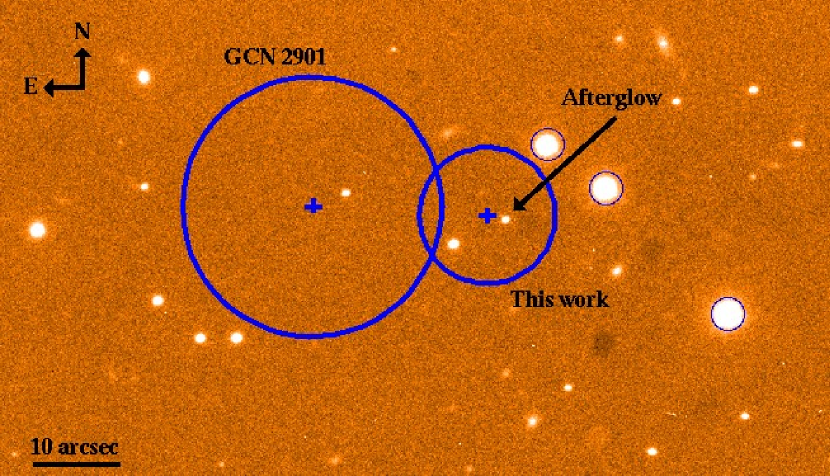
The X-ray afterglow position determined using the X-ray image analysis tool ximage is RA(J2000) = 06h40m475, Dec(J2000) = –37°04′229. This position is indicated on Figure 2, along with the initial position given in Burrows et al. (2004). We estimate a position uncertainty of 8 arcseconds ( confidence). This includes a systematic error of about 5 arcseconds due to residual misalignment between the XRT and the star trackers, which is still being calibrated. The position determined by the XRT for this afterglow is 50 arcseconds from the BAT position and only 1.1 arcseconds from the position of the optical/NIR counterpart. The X-ray afterglow designation is SWIFT J064047.5–370423.
The 0.5 – 10 keV band lightcurve measured by the XRT is shown in Figure 3. The data were extracted from a 20 arcsecond radius circle. The background measured in a circular region of 47.2 arcseconds radius, located away from any hot or flickering pixels, was subtracted. The X-ray source is clearly fading with a power law slope of (68% confidence level) for a decay law of the form .
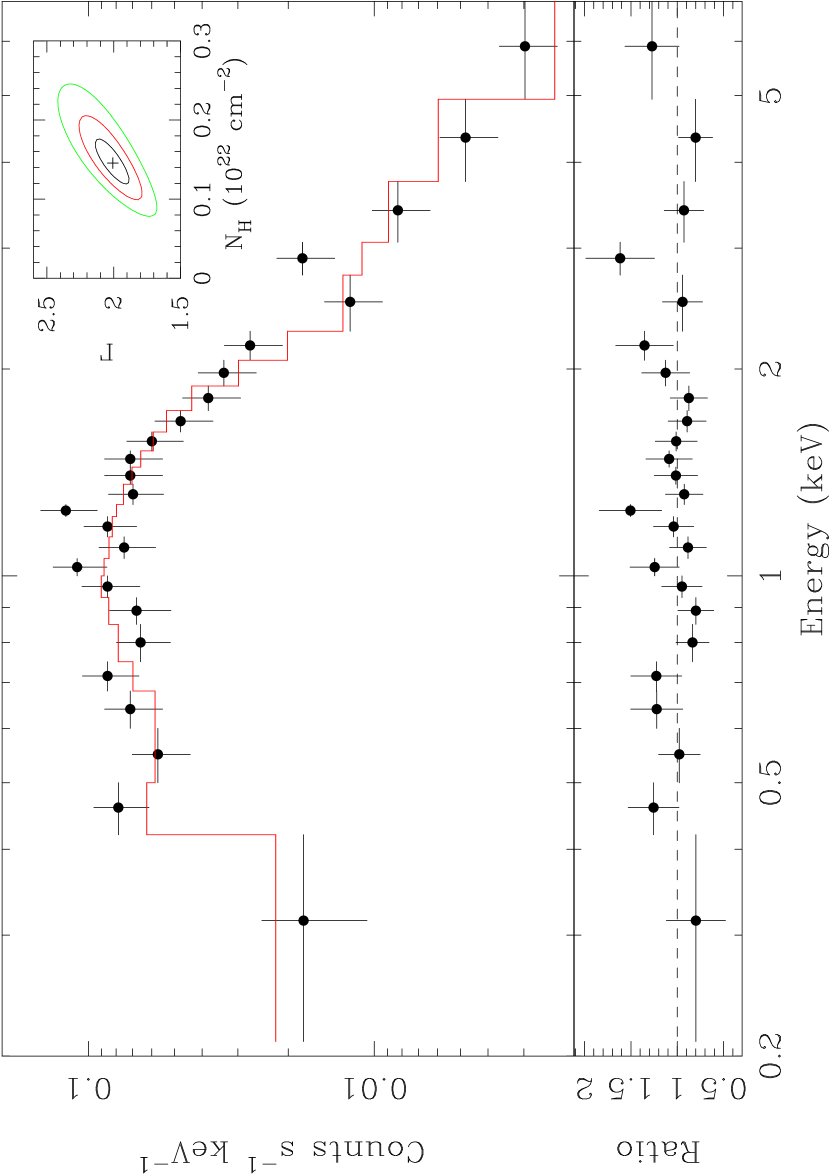
The XRT spectrum of the combined data set is shown in Figure 4. The XRT in-flight calibration has not yet begun, and the spectral fit was based on ground calibration data taken at the intended operating temperature of -100C. The only modification to the pre-launch calibration parameters was a change of 2% in gain, based on preliminary analysis of our first-light observation of Cas A. The spectral results should therefore be treated with some caution until a reanalysis can be performed, following on-orbit instrument calibration observations scheduled to begin in mid-January 2005. However, preliminary spectral analysis of an XRT observation of the Crab nebula yielded spectral parameters in reasonable agreement with recent measurements from Beppo-SAX/MECS (G. Cusumano, private communication), XMM-Newton/EPIC (Willingale et al., 2001), and Chandra/ACIS (Mori et al., 2004), providing some confidence in these preliminary spectral fits. We estimate that the systematic errors in spectral index and are no more than 10%. (The uncertainties quoted below do not include systematic errors.)
With these caveats, we were able to fit the background-subtracted spectrum to an absorbed power-law. The spectrum was processed with a minimum of 20 counts per bin, ignoring channels below 0.2 keV and above 10 keV. The spectral analysis used the same screening as the light-curve and is based on 520 events, all of which were found below keV. We fit the spectrum with a simple power law, yielding a good fit with for 22 degrees of freedom (providing a null hypothesis probability of 0.84). The fitted column density is cm-2 ( confidence level), in good agreement with the Galactic value of cm-2 (Dickey & Lockman, 1990). The power law photon index is (90% confidence; the 68% confidence contours give for the photon index.) The 0.5–10 keV unabsorbed flux, averaged over the time of our observations, is erg cm-2 s-1.
Our combined -band image from 2004 December 24.261 is shown in Figure 2. The coordinates of the -band afterglow are RA(J2000) = 06h40m4733, Dec(J2000) = –37°04′2314, with an estimated error of 0.16 arcseconds, consistent with those reported by Berger et al. (2004). Absolute photometric calibration was performed against three bright, nonsaturated stars from the 2MASS catalog (circled in Figure 2). The -band afterglow has magnitude (Table 2). This object had faded to by 01:40 UT on 2004 December 25, clearly marking it as the GRB afterglow. In our latest image (3.6 d after the GRB), the object is still point-like at the resolution of the VLT images (0.55 arcseconds), with no signs of diffuse emission. The -band decay index is (16 – 87 hours after the burst).
We also obtained -band and -band observations on 25 December 2004. The -band data were calibrated by observing the standard field PG 0231+051. We used the -band decay law to extrapolate the NIR data to a common epoch (1.50 days after the GRB). The photometric spectral energy distribution (SED) for these data is very well reproduced with a hard power-law of spectral index for , after correcting for Galactic extinction of mag (Schlegel, Finkbeiner, & Davis, 1998), and assuming a 10% uncertainty in the extinction. Such hard values are not common for afterglows at these stages (even without any reddening correction the spectrum is still hard, with ).
4 Discussion and Conclusions
The observed decay and spectral indices are summarized in Table 3. The X-ray properties of the afterglow are similar to other X-ray afterglows in the literature. For example, the X-ray decay index, , is steeper than average but consistent with the distribution of Beppo-SAX afterglows (Piro, 2004). The NIR lightcurve is much flatter. These data cannot be explained in terms of any of the standard afterglow models summarized in Table 1 of Zhang & Mészáros (2004). Fast cooling models do not fit the observed values of and and are ruled out for this afterglow. Slow cooling models have for frequencies below the synchrotron injection frequency, , which is also inconsistent with our data. The spectral break between the NIR and X-ray bands then requires . Table 4 shows the remaining cases for three different afterglow models, in which and are functions of the electron index, . For each band, we give the power-law index of the underlying electron distribution, , derived from the spectral index, . We then calculate the value of the electron index, , derived from the temporal index, , using the relationship222In cases where we use the relations for derived by Dai & Cheng (2001); were we instead to use the formulas applicable to , would change slightly but our conclusions would not be affected. applicable to the observationally-determined value of (Zhang & Mészáros, 2004). Finally, we give the least-squares weighted average, , of and ; its uncertainty (for ); the minimum ; and the corresponding probability that the spectral and decay indices both arise from the same electron distribution. We find that no single model is consistent with both the NIR and X-ray data: the NIR data are consistent only with a wind model, while the X-ray data are consistent only with a sideways-expanding jet model.
A more complex afterglow model is required to fully explain the data. Since the data in these bands are not contemporaneous, we consider the possibility of a more complex two-component jet structure similar to that proposed by Berger et al. (2003) for GRB 030329, with a narrow ultrarelativistic jet producing the early X-ray flux and a broader, mildly relativistic component producing the optical emission at later times; however, the jets in the case of GRB 041223 appear to be expanding into a wind medium instead of a uniform density ISM.
The steep X-ray light curve suggests that the X-ray jet break occurred before the XRT observation (i.e., less than 4.6 hours after the burst), which implies that the X-ray flux is dominated by a highly collimated jet (compare with the jet break times and opening angles given in Figure 1 and Table 1 of Frail et al., 2001, for example). The electron index derived from the X-ray data is , somewhat less than, but consistent with, the range found for most GRB afterglows (Panaitescu & Kumar, 2002). We note that the jet break roll-over timescale in a wind model is quite long, which could explain the shallower-than-expected value for found at our mean time of 6 hours post-burst (Kumar & Panaitescu, 2000); if so, the true electron index may be closer to the value , fully consistent with previous results.
The narrow component should also produce NIR emission, but we have no NIR data at this epoch to confirm this prediction. At later times the NIR data are consistent with a broader jet expanding into a wind cavity, powered by the same underlying electron distribution. We postulate that this broad jet has a much smaller Lorentz factor than the narrow component and begins decelerating between 8 and 16 hours post-burst (in our frame). It therefore does not contribute to the earlier X-ray observation, but dominates the later NIR observation in comparison with the rapidly fading narrow component.
References
- Berger et al. (2003) Berger, E., et al. 2003, Nature, 426, 154
- Berger et al. (2004) Berger, E., Krzeminski, W. and Hamuy, M. 2004, GCN 2902
- Burrows et al. (2003) Burrows, D. N. et al. 2003, Proc. SPIE, 5165, 201
- Burrows et al. (2004) Burrows, D. N., et al. 2004, GCN 2901
- Burrows et al. (2005) Burrows, D. N., et al. 2005, Space Science Rev., in press
- Costa et al. (1997) Costa, E. et al. 1997, Nature, 387, 783
- Dai & Cheng (2001) Dai, Z. G., & Cheng, K. S. 2001, ApJ, 558, L109
- Dickey & Lockman (1990) Dickey, J. M. & Lockman, F. J. 1990, ARA&A, 28, 215
- Frail et al. (2001) Frail, D. et al. 2001, ApJ, 562, L55
- Gehrels et al. (2004) Gehrels, N., et al. 2004, ApJ, 611, 1005
- Klebesadel, Strong, & Olson (1973) Klebesadel, R. W., Strong, I. B., and Olson, R. A. 1973, ApJ, 182, L85
- Kumar & Panaitescu (2000) Kumar, P., & Panaitescu, A. 2000, ApJ, 541, L9
- Malesani et al. (2004a) Malesani, D., et al. 2004a, GCN 2903
- Malesani et al. (2004b) Malesani, D., et al. 2004b, GCN 2913
- Markwardt et al. (2004) Markwardt, C., et al. 2004, GCN 2909
- Mészáros & Rees (1997) Mészáros, P., and Rees, M. J. 1997, ApJ, 476, 232
- Mori et al. (2004) Mori, K., Burrows, D. N., Hester, J. J., Pavlov, G. G., Shibata, S., & Tsunemi, H. 2004, ApJ, 609, 186
- Panaitescu & Kumar (2002) Panaitescu, A., & Kumar, P. 2002, ApJ, 571, 779
- Piro (2004) Piro, L. 2004, in 4th Rome workshop on GRBs in the Afterglow Era, ASP Conf Ser., 312, 149
- Schlegel, Finkbeiner, & Davis (1998) Schlegel, D. J., Finkbeiner, D. P., & Davis, M. 1998, ApJ, 500, 525
- Tagliaferri et al. (2004) Tagliaferri, G., et al. 2004, GCN 2910
- Tueller et al. (2004) Tueller, J., et al. 2004, GCN 2898
- Willingale et al. (2001) Willingale, R., Aschenbach, B., Griffiths, R. G., Sembay, S., Warwick, R. S., Becker, W., Abbey, A. F., and Bonnet-Bidaud, J.-M. 2001, /aa, 365, L212
- Zhang & Mészáros (2004) Zhang, B., & Mészáros, P. 2004, Int. J. of Modern Phys. A, 19, 2385
| Observation # | Start Timeaaon 2004 December 23. | Time since GRB | Duration |
|---|---|---|---|
| (UT) | (hours) | (s) | |
| 1 | 18:43:59 | 4.63 | 1479.3 |
| 2 | 20:16:24 | 6.17 | 1491.8 |
| 3 | 21:50:40 | 7.74 | 546.6 |
| Mean Date | Time since GRB | Filter | Exp. time | Seeing | Instrument | Magnitude |
|---|---|---|---|---|---|---|
| (UT) | (hours) | (# exp s) | (arcsec) | |||
| 2004 Dec 24.261 | 16.15 | 1260 | 0.56 | ISAAC | 19.510.05 | |
| 2004 Dec 25.046 | 34.99 | 2120 | 0.38 | FORS 2 | 21.600.04 | |
| 2004 Dec 25.070 | 35.57 | 2060 | 0.55 | ISAAC | 20.430.05 | |
| 2004 Dec 25.089 | 36.05 | 2060 | 0.48 | ISAAC | 19.120.10 | |
| 2004 Dec 27.213 | 87.0 | 2060 | 0.55 | ISAAC | 21.720.15 |
| Band | Decay Index, aa | Spectral Index, aa | Hours post-burst |
|---|---|---|---|
| -band | 16 – 87 | ||
| 0.5-10 keV | 4.6 – 7.9 |
| Model | Band | aa68% confidence limits | P | |||
|---|---|---|---|---|---|---|
| ISM, slow cooling | ||||||
| NIR () | 27.6 | |||||
| X-ray () | 6.02 | 0.014 | ||||
| Wind, slow cooling | ||||||
| NIR () | 0.96 | 0.33 | ||||
| X-ray () | 6.02 | 0.014 | ||||
| Jet, slow cooling | ||||||
| NIR () | 99 | |||||
| X-ray () | 0.95 | 0.33 | ||||