Further evidence for a merger in Abell 2218 from an XMM-Newton observation
The galaxy cluster Abell 2218, at , is well-known for the discrepancy between mass estimates derived from X-ray and strong lensing analyses. With the present XMM-Newton observation, we are able to trace the gas density and temperature profiles out to a radius of kpc (approximately the virial radius of the cluster). The overall surface brightness profile is well fitted over three orders of magnitude with a simple -model with a core radius of and . The projected temperature profile declines steeply with radius (by ), and is well described by a polytrope with parameters keV and . The temperature map shows a pronounced peak in the central arcminute, where the temperature rises by a factor of two (from to keV). The mass profile, calculated assuming hydrostatic equilibrium and spherical symmetry, is best fitted with a King approximation to an isothermal sphere, implying a dark matter distribution with a central core, in contrast with the cusped cores found in more obviously relaxed clusters. The X-ray mass is approximately two times less than the strong lensing mass at kpc, although the agreement between X-ray and weak lensing mass measurements at larger radius ( kpc) is slightly better. While the X-ray total mass estimates can vary by 30 per cent depending on the mass model, all measurements are significantly lower than the corresponding total mass from optical measurements. Given the X-ray results indicating considerable disturbance of the intracluster gas, leading to a probable violation of the assumption of hydrostatic equilibrium, and the observed substructure in the optical, suggesting a line-of-sight merger, it is unlikely that the different mass estimates of this cluster can be reconciled, at least with standard modelling assumptions.
Key Words.:
galaxies: clusters: individual: A2218, Galaxies: clusters: Intergalactic medium, Cosmology: observations, Cosmology: dark matter, X-rays: galaxies: clusters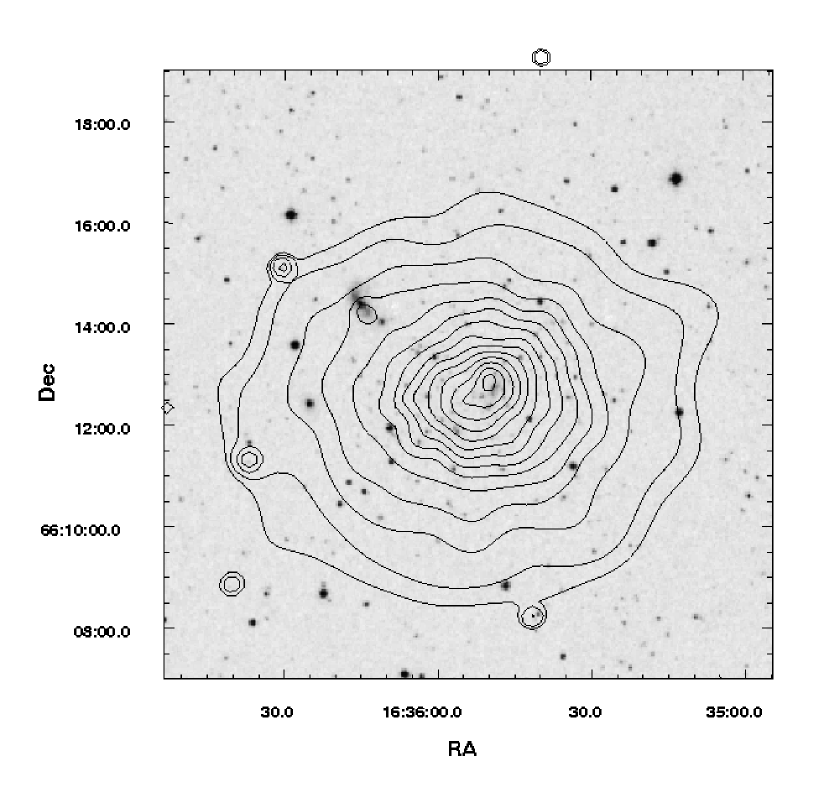
1 Introduction
In what has effectively become the standard scenario for the formation of structure in the Universe, galaxy clusters are born in the collapse of initial density fluctuations and grow under the influence of gravity. They are the nodes of cosmic structure, accumulating mass through a combination of continuous accretion of smaller subunits along the filaments between clusters, interrupted by the occasional violent merger. Cosmological simulations show that, in a given cosmological volume, the sample of clusters will span the range from those which are relatively relaxed to those which are clearly in the midst of a major merger (e.g., Ascasibar et al., 2003), not surprising given the hierarchical scenario.
Given a sufficiently large sample of galaxy clusters, constraints can be put on cosmological parameters. For instance, constraints on and can be found by observing the cluster mass function and its evolution (Perrenod 1980; see Henry 2004 for a recent review). Cluster masses can be estimated using traditional baryonic mass tracers such as the velocity dispersion of the galaxies (e.g., Girardi et al., 1998), or the X-ray emission of the intracluster medium (e.g., Reiprich & Böhringer, 2002), provided some assumptions are made about the relationship between the distribution of dark and luminous matter. For example, the fact that a given cluster is roughly spherical and in approximate hydrostatic equilibrium is a fundamental assumption when the total mass is derived from the X-ray data. On the other hand, gravitational lensing offers another view of the distribution of matter, allowing the calculation of the projected mass within a cluster, either from strong lensing at small scales or weak lensing on larger scales. However, because lensing measures the projected mass, strong lensing in particular is very sensitive to additional matter along the line of sight (Wambsganss, Bode & Ostriker, 2004), and to the detailed dynamical state of the cluster (Torri et al., 2004). Indeed, it has been suggested that strong lensing arcs occur predominantly in clusters which are dynamically more active than typical clusters (Bartlemann & Steinmetz, 1996).
Cluster mergers release vast amounts of energy into the X-ray emitting gas of the intracluster medium (ICM), leading to significant departures from hydrostatic equilibrium. Strong variations are produced in observable characteristics such as density, and, since much of the energy is dissipated in shocks, temperature and entropy. Temperature variations following a merger can survive times longer than density substructure, and so the temperature distribution is a strong diagnostic of the dynamical state of a given cluster (e.g., Markevitch et al., 1998).
A2218 was one of the first targets for a detailed mass study comparing X-ray and weak lensing data (Squires et al., 1996), which concluded that these mass estimates were in agreement (see also Allen 1998). However, the strong lensing mass (estimated using the remarkable arcs at a distance of kpc) was not in agreement with the X-ray estimate (e.g., Miralda-Escudé & Babul, 1995). ROSAT studies suggested complicated X-ray structure near the core (Markevitch, 1997; Neumann & Böhringer, 1999); recent Chandra observations have revealed this structure in greater detail (Machacek et al., 2002). This has given rise to the general conclusion that the cluster is dynamically active, which is also supported by the presence of mass substructure in subsequent lensing studies (the latest being Smith et al. 2004), and indeed substructure in the galaxy distribution in the optical (Girardi & Mezzetti, 2001). The recent Chandra temperature map of the central regions shows quite strong temperature variations (Govoni et al., 2004). The cluster also hosts a weak radio halo (Giovannini & Ferretti, 2000).
With the present XMM-Newton observations we derive gas density and temperature profiles out to large radius, generate a large scale temperature map, and, assuming hydrostatic equilibrium and spherical symmetry, calculate a mass profile of the cluster. As we will see, the assumptions inherent in the mass profile calculation are probably violated, at least in the cluster centre.
The cluster lies at a redshift of . In our chosen cosmology ( km s-1 Mpc-1, and ), 1′ corresponds to kpc. Errors are quoted at the level unless otherwise stated.
2 Observations and data reduction
A2218 was observed for ks on 2002 September 28. The observation showed no soft proton flares in the high energy ( keV) light curves. There is a slight ( per cent) increase in the broad-band [0.3 -10.0 keV] count rate at the beginning of the observation, lasting ks. Since the increase is very weak and of short duration, and has no effect on the derived normalisation at high energy, we have used the entire observation.
Except where noted, in the following analysis we use EMOS PATTERNs 1-12 and EPN PATTERN 0 events. To correct for vignetting, the photon weighting method as implemented in the SAS task evigweight was applied to each event file. The blank-sky event lists of Read & Ponman (2003) were used as background files, with these event lists being subjected to the same screening criteria, PATTERN selection and vignetting correction as the observation event files.
3 Gas density distribution
3.1 Morphology
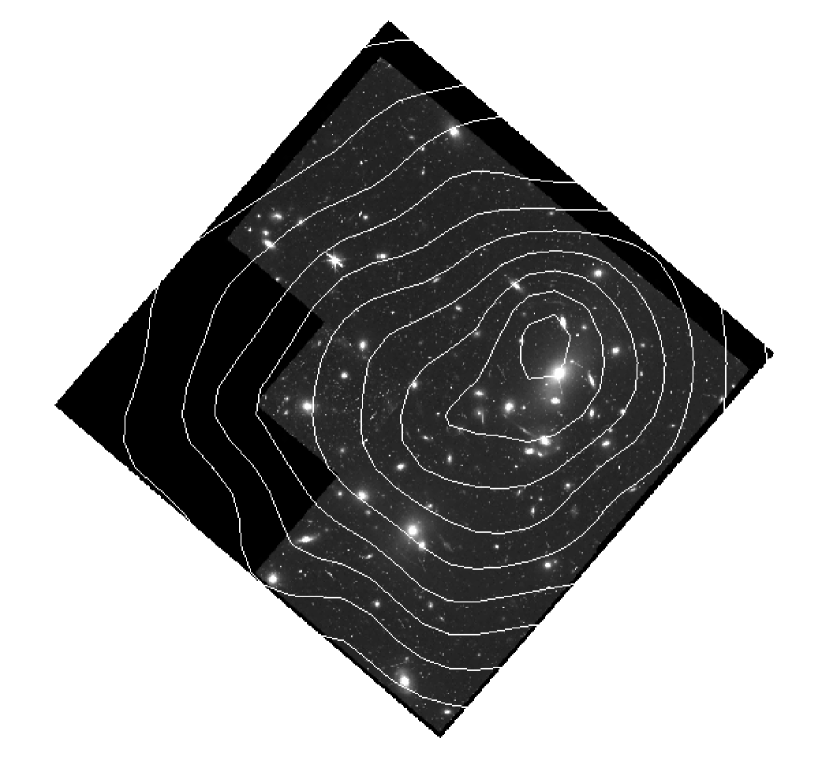
An XMM/DSS overlay image is shown in Fig. 1. The cluster exhibits slightly elliptical, symmetric X-ray emission at large scale. Near the core, the X-ray emission becomes elongated in the SE-NW direction, which is the same orientation as the line joining the two brightest cluster galaxies. As can be seen in the XMM/HST overlay image, the peak of the [0.5-2.0] keV band X-ray brightness is slightly offset from the cD galaxy. Both the cD and the [0.5-2.0] keV X-ray peak are offset from the large-scale centre of symmetry. Since the complicated X-ray morphology of the central regions has been extensively examined using both ROSAT HRI (Markevitch, 1997) and Chandra Machacek et al. (2002), we will not discuss this further.
3.2 Surface brightness profile
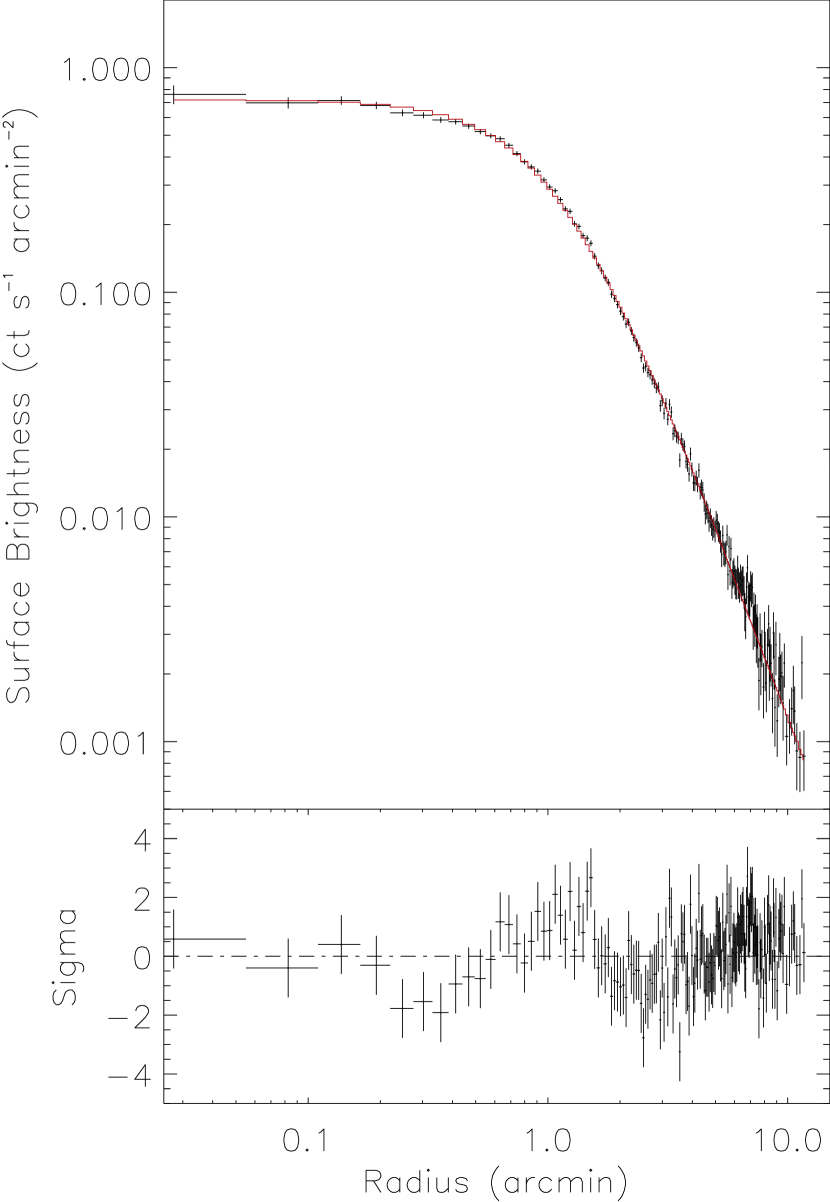
After identification and exclusion of 28 serendipitous sources, an azimuthally averaged surface brightness profile was generated from source and background event files of each camera in the 0.3-3.0 keV band. Events were extracted in circular annuli centred on the emission peak of the cluster. Background subtraction for each camera was undertaken as described in Pratt & Arnaud (2002). The EMOS and EPN profiles are in excellent accord and thus the individual camera profiles were coadded, and the total profile was then binned to a ratio of above background. This profile is shown in Figure 2. Cluster emission is detected out to slightly more than , corresponding to slightly less than 2 Mpc for our chosen cosmology. For comparison, the ROSAT profile of Cannon et al. (1999) was detected out to .
3.3 Density profile modelling
In order to calculate the gas density profile, we fitted the surface brightness profile with analytic models. The fitting process uses simplex minimisation and takes into account projection effects in the line of sight. The models we use are convolved with the XMM-Newton PSF and binned into the same bins as the observed profile. A standard isothermal -model is an acceptable fit to these data ( for 168 degrees of freedom), and the values found for and are in good agreement with ROSAT-derived values (e.g., Birkinshaw & Hughes 1994; Squires et al. 1996; Markevitch 1997; Cannon et al. 1999). In Figure 2 the best-fitting model is shown compared to the surface brightness profile. In Table 1 we give the -model parameters for this fit as well as for surface brightness profiles extracted in sectors defined anticlockwise from the positive Y-axis. In all instances bar the sector, a -model is an adequate fit to the surface brightness. As a further check we calculated surface brightness profiles centred on the broad-band X-ray peak found in the Chandra analysis of Machacek et al. (2002). These profiles yield best-fitting -model parameters which are in agreement with those in Table 1.
On close examination of Fig. 2, it can be seen that the -model is an excellent description of the data over three orders of magnitude in surface brightness. Related to this is the lack of evidence for a turnover in the surface brightness at very large radius (c.f., Vikhlinin et al. 1999), although this latter point is highly sensitive to the exact background subtraction method.
| Sector | /dof | ||
|---|---|---|---|
| (arcmin) | |||
| Full | 208.8/168 | ||
| 0-90 | 140.0/127 | ||
| 90-180 | 275.6/148 | ||
| 180-270 | 86.9/96 | ||
| 270-360 | 161.8/115 |
4 Spatially resolved spectroscopy
In the following, the background spectra were normalised using the count rates in the source-free [10.-12.] keV (EMOS) and [12.-14.] keV (EPN) bands. The normalisation factors used were 1.09, 1.11 and 1.15 for EMOS1, EMOS2 and EPN, respectively.
4.1 Global spectrum
We extracted a global spectrum from all events within a circle of radius to allow for direct comparison with the Chandra results. We fitted the data using a simple single temperature absorbed MEKAL model with the redshift fixed at the average redshift of the cluster ().
It was found that naive fitting of the spectra in the band [0.3-10.0] keV with the absorption fixed at the galactic level ( cm-2) produced results where the EPN temperature was significantly lower than that found by the EMOS. Conversely, if the absorption was let free, then the EPN absorption was significantly lower than that found by the EMOS (which was in good agreement with the galactic value). We thus adopted the ad hoc strategy discussed in Pratt & Arnaud (2002), fixing the low-energy cutoff at 0.6 keV for the EMOS and 1.0 keV for the EPN, which leads to good agreement between EPIC temperatures with the absorption fixed at the galactic value.
The global temperature in this case is , with an abundance of solar (90% confidence), the latter measured relative to Anders & Grevesse (1989). This is in good agreement with previously determined values, such as the Ginga analysis of McHardy et al. (1990), the ASCA analyses of Mushotzky & Loewenstein (1997),Allen (1998) and Cannon et al. (1999), and the Chandra analysis of Machacek et al. (2002).
4.2 Radial temperature profile
We then calculated a simple projected radial temperature profile. After exclusion of point sources, spectra were extracted in 10 annuli centred on the X-ray emission peak and extending to the radius of maximum detection of the surface brightness profile (i.e., 0′- 11′). The spectra were binned to to allow the use of Gaussian statistics. EPIC spectra were then simultaneously fitted in the [1.-10.] keV band with a single temperature MEKAL model with free abundances and the absorption fixed at the galactic value. We choose a relatively high low-energy cutoff to avoid problems related to the variation of the soft X-ray background with position on the sky.
While we have already normalised the background using the count rates in the source-free high energy bands, background subtraction is critical in spectroscopic studies at the lowest surface brightness levels, and can have significant effects on the radial profile at high radii. We thus re-fitted the spectra with the background at per cent of nominal, the variation seen in the typical quiescent background level. The temperatures of all annuli agree within the error bars whatever the normalisation.
The projected temperature profile is shown in Fig. 3. The error bars are the upper and lower limit temperatures for each annulus taking into account variations of percent in the background normalisation. These uncertainties are the total systematic plus statistical errors and should be viewed as very conservative estimates. As expected, the external annuli exhibit the largest uncertainties; however, the robustly determined lower limit of the temperature in the final annulus is 2.3 keV. The temperature profile is in excellent agreement with that found in the ASCA analysis of Cannon et al. (1999) and the more recent Chandra analysis of Markevitch et al. (2000), but extends to larger radius (albeit with large uncertainties).
A polytropic model, , with the gas density described with the -model discussed above (Sect. 3.3), is a good description of the projected temperature profile. The best-fitting values for the central temperature and polytropic index are keV and , respectively; this model is also shown in Fig. 3.
As a consequence of the high temperature, abundance measurements of this cluster are poorly-constrained, but are consistent with being flat at the average value () out to the detection limit.

4.3 Temperature map
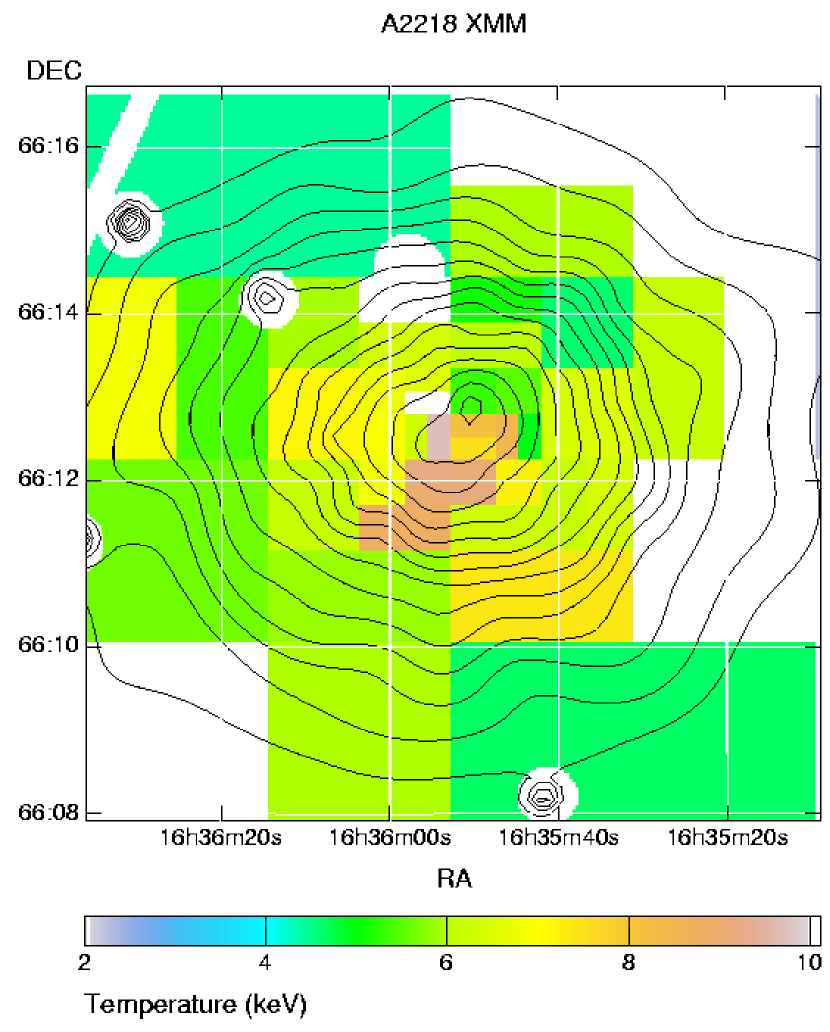
We next produced a temperature map using the adaptive binning technique described in Belsole et al. (2004a). A full energy band image with the sources excised was extracted from each camera, and the camera images coadded. Starting from the largest spatial scale (i.e., the entire image), the image was divided into cells. Each cell is divided by four until a certain threshold criterion is met (for this map, a total of 1000 counts in the full energy band prior to background subtraction). Spectra are then extracted from the source and background event lists with the resulting spatial binning, and background subtracted. The same absorbed MEKAL model was fitted to each spectrum in the bands described above (this time with the abundance fixed to ). The derived uncertainties are dependent on the temperature. In building the temperature map shown in Fig. 4, we only used cells with relative errors smaller than 50 per cent. The temperature structures in this map are very similar to those in the Chandra map of Govoni et al. (2004).
5 Mass analysis
5.1 Deprojection of temperature profile and correction for PSF effects
In order to have the best estimate of the mass profile it is necessary to take into account PSF and projection effects on the temperature profile. Since correction for these effects using simultaneous spectral fits under XSPEC tends to be unstable (Pointecouteau et al., 2004; Pratt & Arnaud, 2005), we use the method described in Pointecouteau, Arnaud & Pratt (2005). With the gas density represented by the best fitting -model (Sect. 3.3), we adopt a polytropic representation of the projected temperature profile (Sect. 4.2), and convolve this with a redistribution matrix which takes into account both PSF and projection effects. The projected profile was randomly sampled 1000 times within the observed errors, the gas density profile being allowed to vary within the uncertainties of the best fitting -model. The final deprojected, PSF-corrected temperature profile and associated errors were then the mean and standard deviation of the 1000 corrected values at each point.
Fitting a polytropic model to the deprojected, PSF-corrected temperature profile yields best-fitting values for the central temperature and polytropic index of keV and , respectively.
5.2 Total mass profile calculation
Combining the deprojected, PSF-corrected density and temperature profiles (Sects. 3.3 and 5.1), we can derive a total mass profile under the assumptions of hydrostatic equilibrium and spherical symmetry. Given the observed temperature structure, this is probably not a good assumption (certainly in the inner or so), but it is still interesting to see if X-ray and lensing mass estimates agree in the external regions. The mass profile was calculated using the Monte Carlo method described in Pratt & Arnaud (2003); the resulting total mass profile is shown in Fig. 5.
For easier comparison with previous analyses, particularly results from ASCA (Cannon et al., 1999) and Chandra (Machacek et al., 2002), we also show the mass profile obtained when the temperature profile is assumed isothermal and the gas density is parameterised by a -model. For this we assume a temperature of keV (Sect. 4.1) and the best fitting -model in Sect. 3.3. The mass profile obtained using this method is slightly different from the one we have derived using spatially resolved temperature information, being slightly lower in the inner regions, and higher in the outskirts.
5.3 Mass profile modelling

Since the mass profile is defined to very good precision, it is interesting to compare it with theoretical expectations. We thus tried fitting the mass profile with functional forms for the dark matter density, these being the King approximation to an isothermal sphere (e.g., Sarazin, 1986) and the NFW profile (Navarro, Frenk & White, 1997), given by:
| (1) | |||||
| (2) | |||||
| (3) | |||||
| (4) |
respectively, where we have followed Ettori, De Grandi & Molendi (2002), in expressing the normalisation of both mass models through the concentration parameter, . The King profile is clearly preferred in terms of , although the removal of the central mass point leads to an acceptable fit for the NFW mass model (see Table 2 for details). The best-fitting mass profile models are compared to the data in Fig. 5.
| Parameter | NFW Model | King model | |
| Full | Central point | ||
| removed | |||
| ( kpc) | |||
| ( kpc) | 1715 | 1669 | 1525 |
| 14.2/8 | 2.5/7 | 4.8/8 | |
6 Discussion
6.1 Temperature, entropy and pressure structure
It has been known for some time that the central regions of this cluster show signs of being morphologically disturbed in X-ray (Markevitch, 1997; Neumann & Böhringer, 1999; Machacek et al., 2002). The spatially resolved temperature maps from this work and from Chandra (Govoni et al., 2004) provide further evidence, if any were needed, that A2218 is undergoing (or has undergone) a merger. The centrally-peaked radial temperature profile has been resolved into a small region of significantly hotter gas in the core. The temperature varies by a factor of two in the central arcminute. The hottest parts of the cluster are only approximately spatially coincident with the weak radio halo (Govoni et al., 2004). Comparing the HST galaxy distribution (Fig. 1) and the temperature map (Fig. 4), the hottest region is spatially coincident with the two main galaxies, and thus with the two main mass peaks found in lensing analyses, but is offset from the X-ray surface brightness maximum.
We have also investigated the structure in entropy and pressure using masks created to resolve the observed fluctuations in (i) the temperature and surface brightness, and (ii) the entropy and pressure. Both masks have 16 regions, 8 regions covering the central , and 8 covering larger scales of . The method of mask generation and the calculation of the deprojected pressure and entropy in each region is described in Henry, Finoguenov & Briel (2004). The fluctuations on these scales are found to be statistically significant and amount to per cent in entropy and per cent in pressure, where the two values given for the entropy show the slight dependence on the mask. Note however that the results obtained using the two different masks are consistent. The scatter in the entropy and pressure in the central arcminute is per cent and per cent, respectively.
The temperature structure of a cluster has often been used to learn more about the merger kinematics in interacting clusters (e.g., Markevitch et al., 1999; Belsole et al., 2004a, b). This is very difficult in the present case, since, at least in X-ray, the merger geometry is not obvious. In particular, the X-ray surface brightness does not show more than one peak and is fairly symmetric at large radii.
6.2 Entropy profile
The entropy profile of the cluster shown in Figure 6 was calculated using the now-customary entropy definition, , where we have used the best-fitting -model for the gas density (Sect. 3.3) and the deprojected, PSF-corrected temperature profile (Sect. 5.1). Uncertainties due to gas density profile modelling are negligible compared to the temperature measurement errors. The radius has been scaled using the observed – relation of Arnaud, Pointecouteau & Pratt (2005)111The relation is , giving kpc for a global temperature of 6.6 keV (Sect. 4.1)., and the entropy has been scaled using the relation found by Ponman et al. (2003)222. We also show an analytically-derived profile obtained using the best fitting analytic description of the temperature and density data.
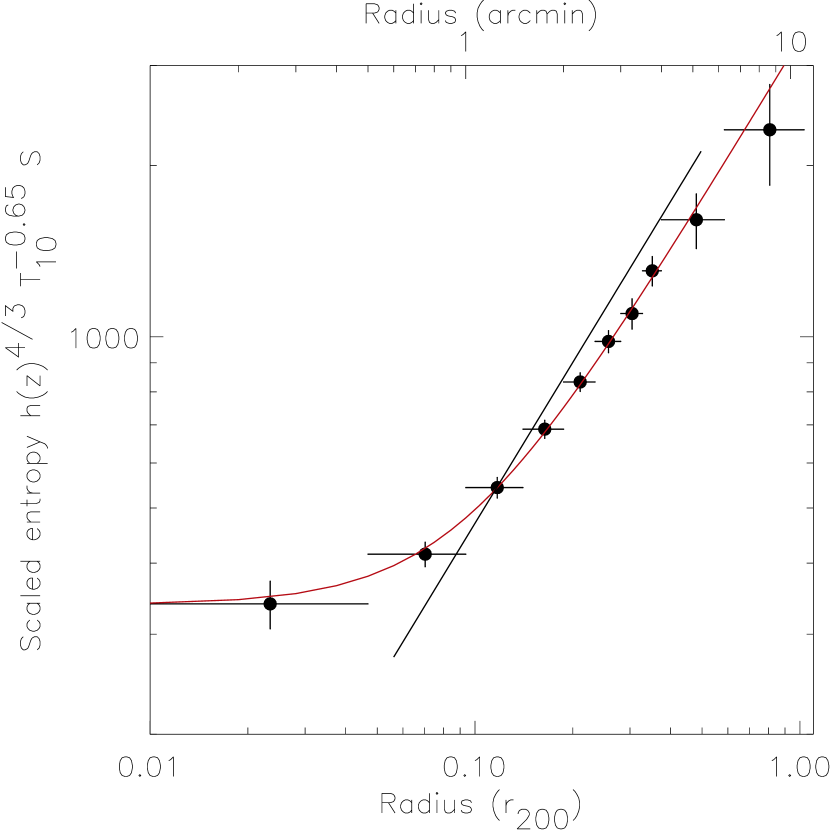
It is clear that the entropy profile of A2218 is rather flat in the inner regions ( kpc, or ), where the central entropy levels out to a value of keV cm2 at kpc. This flattening is driven by the large core in the gas density. Because of this, A2218 was found to be a significant outlier in the sample of Lloyd-Davies et al. (2000). In fact, the temperature map shows variations of a factor of two (from to keV) in the central arcminute. The complex entropy distribution in the central regions is smoothed out by the use of annular regions to produce the profile.
From an analysis of five clusters, Pratt & Arnaud (2005) found approximately 20 per cent dispersion in the scaled entropy profiles of their sample. Their mean scaled profile, obtained in the radial range [0.05 - 0.5] (Eqn. 4 of Pratt & Arnaud 2005) is also shown in Fig. 6. Excluding the inner three points, a power-law fit to the entropy profile of A2218 yields a slope of , slightly shallower than the mean scaled profile, although consistent within the uncertainties.
6.3 Mass estimates
6.3.1 Mass profile: comparison to theoretical expectations
It is becoming increasingly clear that the mass profiles of relatively relaxed, hot clusters are well described by the NFW profile (e.g., David et al. 2001; Allen et al. 2001; Arabadjis et al. 2002; Pratt & Arnaud 2002; Lewis et al. 2003; Pointecouteau et al. 2004, 2005). Such clusters generally exhibit strongly peaked surface brightness profiles, and regular density and temperature structure. In cases such as these, the standard assumptions in the X-ray mass analysis (hydrostatic equilibrium and spherical symmetry) are more than likely warranted.
An NFW model is not a good description of the total mass profile of A2218, particularly in the inner regions, as expected given the observed density and temperature structure. While exclusion of the central mass point improves the NFW fit considerably, the best fitting mass model to the entire profile remains the King model, a consequence more of the large core in the gas density than the radial temperature distribution.
6.3.2 Comparison with lensing

The considerable disagreement between the masses derived from X-ray and lensing analyses of this cluster has generated some debate in the past (e.g., Miralda-Escudé & Babul, 1995; Allen, 1998). In Fig. 7 we show the projected mass profile obtained from these XMM-Newton data, converted to the SCDM () cosmology used in previous analyses. The profile is compared to the masses obtained from strong lensing (Loeb & Mao, 1994; Kneib et al., 1995; Allen, 1998), weak lensing (Squires et al., 1996; Smail et al., 1997) and combined lensing (AbdelSalam et al., 1998; Smith et al., 2004).
Despite having a well constrained radial temperature distribution, the X-ray mass is approximately two times less than the strong lensing mass at kpc. At larger radius, the agreement between mass estimates is better, although still not perfect. The observed disagreement in the inner regions would be expected if either (i) there was a smaller subcluster in the line of sight, or (ii) the hydrostatic assumption is violated, possibilities we discuss in more detail below.
6.3.3 Total mass estimate
Depending on the adopted mass model, the virial mass, , varies by about 30 per cent (see Table 2). Arnaud et al. (2005) have recently derived an X-ray – relation derived from XMM-Newton observations of 10 clusters in the 2 – 9 keV range. Since the methods detailed in the present paper are very similar to their analysis, it forms an ideal comparison sample. The total mass, , predicted by the – relation of Arnaud et al. (2005), assuming a virial temperature of 6.6 keV (Sect. 4.1), is , about 25 per cent higher than the highest mass estimate from mass profile modelling (Table 2).
We can also compare the mass estimates from the different X-ray mass models with the optical virial mass estimates of Girardi & Mezzetti (2001). We note that the most distant galaxy from the cluster centre in Girardi & Mezzetti’s analysis is only at kpc, and so there is a fair amount of extrapolation needed in their mass estimate. These authors analyse 43 galaxies and find , for an optically-derived virial radius of Mpc. Our best-fitting mass models give (NFW/King) for the same radius. This is a very significant mass discrepancy. If there is indeed a line of sight merger, this will artificially increase the optical galaxy velocity dispersion if only one component is assumed, leading to a higher optical mass estimate.
7 Summary and conclusions
We have undertaken a detailed X-ray analysis of the well-known lensing cluster A2218. In the inner regions (, or kpc) the X-ray isophotes become elongated and oriented approimately SW-NE, the same direction as the line joining the two brightest cluster galaxies (which are also the mass peaks seen in lensing studies). There is a marked offset between the position of the cD galaxy and the X-ray brightness peak, as was seen in previous ROSAT and Chandra studies (Markevitch, 1997; Neumann & Böhringer, 1999; Machacek et al., 2002). In agreement with previous Chandra results (Markevitch et al., 2000), we find that the temperature profile decreases significantly from the centre. With the present observation, we find that this decrease continues to the virial radius of the cluster. From an adaptively-binned temperature map, we find similar temperature structure to that found in the Chandra observation (Govoni et al., 2004). There is a pronounced peak in the temperature in the inner , where the temperature rises from keV to keV. The peak is not correlated with any obvious surface brightness feature, and is offset from the surface brightness maximum. The scatter in deprojected entropy and pressure in the central arcminute is typically per cent.
The mass profile (determined assuming HE and spherical symmetry) is best fitted with a King mass model, in contrast with the results from more relaxed clusters. An NFW model is a particularly bad fit in the central regions. The X-ray mass estimate does not agree with the mass estimated from strong lensing arcs at , although the agreement improves when comparing X-ray and weak lensing masses at large radii. X-ray total mass estimates dependent on mass profile fitting can vary by 30 per cent depending on the mass model used. While the results must be viewed with caution, the total mass measurement is 20-60 per cent smaller than the mass expected from the – relation. X-ray and lensing mass measurements are significantly smaller than optical virial mass estimates by more than a factor of two.
An important clue to the merger geometry in this system comes from optical observations. The distribution of galaxy velocities in the optical study of Girardi et al. (1997) strongly indicates substructure in the line of sight. Given this and the observed X-ray characteristics, it is likely that A2218 is either an ongoing merger between a main cluster and a smaller subcluster, or a single cluster in a more advanced merger state. In either case, the central regions, at least, of the cluster are unlikely to be in hydrostatic equilibrium. As a result of this, X-ray mass estimates are highly uncertain. Discrepancies between X-ray and lensing mass estimates due to line of sight effects and/or mergers have also been discussed in Andersson & Madejski (2004, A1698) and Zhang et al. (2004, CL0024+17), and in the case of A2218 itself, by Machacek et al. (2002), in the context of the Chandra observation.
Perhaps the most significant result from our analysis is the calculation of a well-constrained radial temperature profile out to approximately the virial radius of the cluster. It is unfortunate in a way that A2218 is so obviously undergoing a merger event. In other circumstances it would have been an ideal benchmark object for mass measurements using the various methods in use today.
Acknowledgements.
GWP is grateful to J.-L. Sauvageot, M. Arnaud and E. Pointecouteau for useful discussions. We thank the referee for comments which allowed us to improve the paper. GWP acknowledges funding from a Marie Curie Intra-European Fellowship under the FP6 programme (Contract No. MEIF-CT-2003-500915). AF acknowledges support from BMBF/DLR under grant 50 OR 0207 and partial support from NASA grant NNG04GF686. The present work is based on observations obtained with XMM-Newton, an ESA science mission with instruments and contributions directly funded by ESA Member States and the USA (NASA). This research has made use of the NASA’s Astrophysics Data System Abstract Service; the SIMBAD database operated at CDS, Strasbourg, France; the High Energy Astrophysics Science Archive Research Center Online Service, provided by the NASA/Goddard Space Flight Center and the Digitized Sky Surveys produced at the Space Telescope Science Institute.References
- AbdelSalam et al. (1998) AbdelSalam, H.M., Saha, P., Williams, L.L.R., 1998, AJ, 116, 1541
- Allen (1998) Allen, S.W., 1998, MNRAS, 296, 392
- Allen et al. (2001) Allen, S.W., Schmidt, R.W., & Fabian, A.C. 2001, MNRAS, 328, L37
- Anders & Grevesse (1989) Anders, E., & Grevesse, N. 1989, GeCoA, 53, 197
- Andersson & Madejski (2004) Andersson, K.E., Madejski, G.M., 2004, ApJ, 607, 190
- Arabadjis et al. (2002) Arabadjis, J.S., Bautz, M.W., & Garmire, G.P. 2002, ApJ, 572, 66
- Arnaud et al. (2005) Arnaud, M., Pointecouteau, E., Pratt, G.W., 2005, A&A, submitted, (astro-ph/0502210)
- Ascasibar et al. (2003) Ascasibar, Y., Ypes, G., Müller, V., Gottlöber, S., 2003, MNRAS, 346, 731
- Belsole et al. (2004a) Belsole, E., Pratt, G.W., Sauvageot, J.-L., Bourdin, H., 2004, A&A, 415, 821
- Belsole et al. (2004b) Belsole, E., Sauvageot, J.-L., Pratt, G.W., Bourdin, H., 2004, A&A, in press (astro-ph/0409544)
- Bartlemann & Steinmetz (1996) Bartelmann, M., Steinmetz, M., 1996, MNRAS, 283, 431
- Birkinshaw & Hughes (1994) Birkinshaw, M., Hughes, J.P., 1994, ApJ, 420, 33
- Cannon et al. (1999) Cannon, D.B., Ponman, T.J., Hobbs, I.S., 1999, MNRAS, 302, 9
- David et al. (2001) David, L.P., Nulsen, P.E.J., McMamara, B.R., et al. 2001, ApJ, 557, 546
- Ettori et al. (2002) Ettori, S., De Grandi, S., Molendi, S., 2002, A&A, 391, 841
- Giovannini & Ferretti (2000) Giovannini, G., Ferretti, L., 2000, New Astronomy, 5, 335
- Girardi et al. (1997) Girardi, M., Fadda, D., Escalera, E., et al. 1997, ApJ, 490, 56
- Girardi et al. (1998) Girardi, M., Giuricin, G., Mardirossian, F., Mezzetti, M., Boschin, W., 1998, ApJ, 505, 74
- Girardi & Mezzetti (2001) Girardi, M., Mezzetti, M., 2001, ApJ, 548, 79
- Govoni et al. (2004) Govoni, F., Markevitch, M., Vikhlinin, A., VanSpeybroeck, L., Feretti, L., Giovannini, G., 2004, ApJ, 605, 695
- Henry (2004) Henry, J.P., 2004, ApJ, 609, 603
- Henry et al. (2004) Henry, J.P., Finoguenov, A., Briel, U.G., 2004, ApJ, 615, 181
- Kneib et al. (1995) Kneib, J.P., Mellier, Y., Pello, R., Miralda-Escudé, J., Le Borgne, J.-F., Böhringer, H., Picat, J.-P., 1995, A&A, 303, 27
- Kneib et al. (1996) Kneib, J.P., Ellis, R.S., Smail, I., Couch, W.J., Sharples, R.M., ApJ, 471, 643
- Lewis et al. (2003) Lewis, A.D., Buote, D.A., Stocke, J.T., 2003, ApJ, 586, 135
- Lloyd-Davies et al. (2000) Lloyd-Davies, E.J., Ponman, T.J., Cannon, D.B., 2000, MNRAS, 315, 689
- Loeb & Mao (1994) Loeb, A., Mao, S., 1994, ApJ, 435, L109
- Machacek et al. (2002) Machacek, M.E., Bautz, M.W., Canizares, C., Garmire, G.P., 2002, ApJ, 567, 188
- Markevitch (1997) Markevitch, M., 1997, ApJ, 483, L17
- Markevitch et al. (1998) Markevitch, M., Forman, W.R., Sarazin, C.L., Vikhlinin, A., 1998, ApJ, 503, 77
- Markevitch et al. (1999) Markevitch, M., Sarazin, C.L., Vikhlinin, A., 1999, ApJ, 521, 526
- Markevitch et al. (2000) Markevitch, M., Vikhlinin, A.,Mazzotta, P., VanSpeybroeck, L., 2000, astro-ph/0012215
- McHardy et al. (1990) McHardy, I.M., Stewart, G.C., Edge, A.C., Cooke, B., Yamashita, K., Hatsukade, I., 1990, MNRAS, 242, 215
- Miralda-Escudé & Babul (1995) Miralda-Escudé, J., Babul, A., 1995, ApJ, 449, 18
- Mushotzky & Loewenstein (1997) Mushotzky, R.F., Loewenstein, M., 1997, ApJ, 481, L63
- Navarro et al. (1997) Navarro, J.F., Frenk, C.S., & White, S.D.M. 1997, ApJ, 490, 493
- Neumann & Böhringer (1999) Neumann, D., & Böhringer, H. 1999, ApJ, 512, 630
- Perrenod (1980) Perrenod, S.C., 1980, ApJ, 236, 373
- Pointecouteau et al. (2004) Pointecouteau, E., Arnaud, M., Kaastra, J., De Plaa, J., 2004, A&A, 423, 33
- Pointecouteau et al. (2005) Pointecouteau, E., Arnaud, M., Pratt, G.W., 2005, A&A, in press (astro-ph/0501635)
- Ponman et al. (2003) Ponman, T.J., Sanderson, A.J.R., Finoguenov, A., 2003, MNRAS, 343, 331
- Pratt & Arnaud (2002) Pratt, G.W., Arnaud, M. 2002, A&A, 394, 375
- Pratt & Arnaud (2003) Pratt, G.W., Arnaud, M. 2003, A&A, 408, 1
- Pratt & Arnaud (2005) Pratt, G.W., Arnaud, M., 2005, A&A, 429, 791
- Read & Ponman (2003) Read, A.M., Ponman, T.J., 2003, A&A, 409, 395
- Reiprich & Böhringer (2002) Reiprich, T., Böhringer, H., 2002, ApJ, 567, 716
- Sarazin (1986) Sarazin, C., 1986, Rev. Mod. Phys., 58, 1
- Smail et al. (1997) Smail, I., Ellis, R.S., Dressler, A., Couch, W.J., Oemler, A., Sharples, R.M., Butcher, H., 1997, ApJ, 479, 70
- Smith et al. (2004) Smith, G.P., Kneib, J.-P., Smail, I., Mazzotta, P., Ebeling, H., Czoske, O., 2004, MNRAS, submitted (astro-ph/0403588)
- Squires et al. (1996) Squires, G., Kaiser, N., Babul, A., Fahlman, G., Woods, D., Neumann, D.M., Böhringer, H., 1996, ApJ, 461, 572
- Torri et al. (2004) Torri, E., Meneghetti, M., Bartlemann, M., Moscardini, L., Raisa, E., Tormen, G., 2004, MNRAS, 349, 476
- Vikhlinin et al. (1999) Vikhlinin, A., Forman, W., Jones, C., 1999, ApJ, 525, 47
- Wambsganss et al. (2004) Wambsganss, J., Bode, P., Ostriker, J.P., 2004, ApJ, 606, L93
- Zhang et al. (2004) Zhang, Y.Y., Böhringer, H., Mellier, Y., Soucail, G., Forman, W., 2004, A&A, 429, 85