Deep Photometry of GRB 041006 Afterglow: Hypernova Bump at Redshift 11affiliation: Based on data from the MMTO 6.5m telescope, the 1.8m Vatican Advanced Technology Telescope, the Magellan 6.5m Baade and Clay telescopes, and the Keck II 10m telescope
Abstract
We present deep optical photometry of the afterglow of gamma-ray burst (GRB) 041006 and its associated hypernova obtained over days after detection (55 -band epochs on 10 different nights). Our early data (days) joined with published GCN data indicates a steepening decay, approaching at early times (day) and at late times. The break at days is the earliest reported jet break among all GRB afterglows. During our first night, we obtained 39 exposures spanning hours from 0.62 to 0.71 days after the burst that reveal a smooth afterglow, with an deviation of mag from the local power-law fit, consistent with photometric errors. After days, the decay slows considerably, and the light curve remains approximately flat at mag for a month before decaying by another magnitude to reach mag two months after the burst. This “bump” is well-fitted by a k-corrected light curve of SN1998bw, but only if stretched by in time. In comparison with the other GRB-related SNe bumps, GRB 041006 stakes out new parameter space for GRB/SNe, with a very bright and significantly stretched late-time SN light curve. Within a small sample of fairly well observed GRB/SN bumps, we see a hint of a possible correlation between their peak luminosity and their “stretch factor”, broadly similar to the well-studied Phillips relation for the type Ia supernovae.
1 Introduction
At least some gamma-ray bursts (GRBs) are produced by events with the spectra and light curves of core-collapse supernovae (SNe), as demonstrated decisively by two GRBs which occurred in 2003, GRB 030329/SN 2003dh (e.g. Stanek et al., 2003; Matheson et al., 2003) and GRB 031203/SN 2003lw (e.g. Malesani et al., 2004). At redshifts of and , respectively, these are classical GRBs with the two lowest redshifts measured to date (although GRB 031203 was most likely sub-luminous compared to other classical GRBs). GRB 980425 at was also associated with “hypernova” 1998bw (Galama et al., 1998), but the isotropic energy of that burst was 10-3 to 10-4 times weaker than classical cosmological GRBs which might place it in a unique class.
In addition, late-time deviations from the power-law decline typically observed for optical afterglows have been seen in a number of cases and these bumps in the light curves have been interpreted as evidence for supernovae (for a recent summary of their properties, see Zeh, Klose, & Hartmann, 2004). Possibly the best case of a supernova bump was provided by GRB 011121 which occurred at a redshift of and thus would have had a relatively bright supernova component. A bump in the light curve was observed both from the ground and with the HST (Garnavich et al., 2003; Bloom et al., 2002). The color changes in the light curve of GRB 011121 were also consistent with a supernova, designated SN 2001ke (Garnavich et al., 2003).
Due to this mounting evidence, there have been claims that all supernovae that produce GRBs are type Ic hypernovae. The bias toward type Ic is partly due to the perceived difficulty in producing a jet that escapes from a star with a massive envelope. But this prejudice may not be justified; after all, it was recently believed that due to the large baryon content of supernovae it was not possible for any supernova to be a GRB source. It is therefore prudent to still assume that the range of SN types that are responsible for GRBs, and their properties, is an unsolved observational problem. In several cases there is evidence that GRBs could indeed be associated with other type of supernovae, such as type IIn (Garnavich et al., 2003), or normal type Ib/c or fainter hypernovae (Price et al., 2003; Della Valle et al., 2003; Fynbo et al., 2004). Obtaining magnitudes, colors and spectra of more GRB supernovae is clearly a top priority in understanding the origin of long/soft bursts.
GRB 041006 was detected and localized by the French Gamma Ray Telescope and the Wide Field X-Ray Monitor instruments aboard the High Energy Transient Explorer II at 12:18:08 (UT is used throughout this paper) on 2004 October 6 (Galassi et al., 2004). It was classified as a “X-ray rich GRB”, and it was similar to GRB 030329 in its lightcurve shape and spectral characteristics. Da Costa, Noel, & Price (2004) and Price, Da Costa, & Noel (2004) reported discovery of a new, fading optical source within the HETE error circle, located at = , = (J2000.0), and identified it as the GRB optical afterglow. Fugazza et al. (2004) and Price et al. (2004) obtained an absorption line redshift of for the afterglow, which is fairly low for a GRB. Motivated by the continued need to study the GRB/SN connection as discussed above, we undertook photometric monitoring of the optical afterglow of GRB 041006. In this paper, we present photometry of the afterglow of GRB 041006 obtained throughout the two months immediately following the burst, which resulted in a clear detection of a light curve bump, most likely due to the underlying hypernova. We discuss the properties of that hypernova compared to the sample of other well studied GRB-related SNe.
2 The Photometric Data
The photometric data we obtained are listed in Table 1111The analysis presented here supersedes our GCN Circulars by Garnavich et al. (2004b) and Garg et al. (2004).. The majority of our data were obtained with the MegaCam CCD mosaic (McLeod et al., 2000) mounted on the MMT 6.5m telescope. Additional data were obtained using the 1.8m Vatican Advanced Technology Telescope, the Magellan 6.5m Baade and Clay telescopes, and the Keck II 10m telescope222All photometry presented in this paper are available through anonymous ftp on cfa-ftp.harvard.edu, in the directory pub/kstanek/GRB041006. Images are available by request..
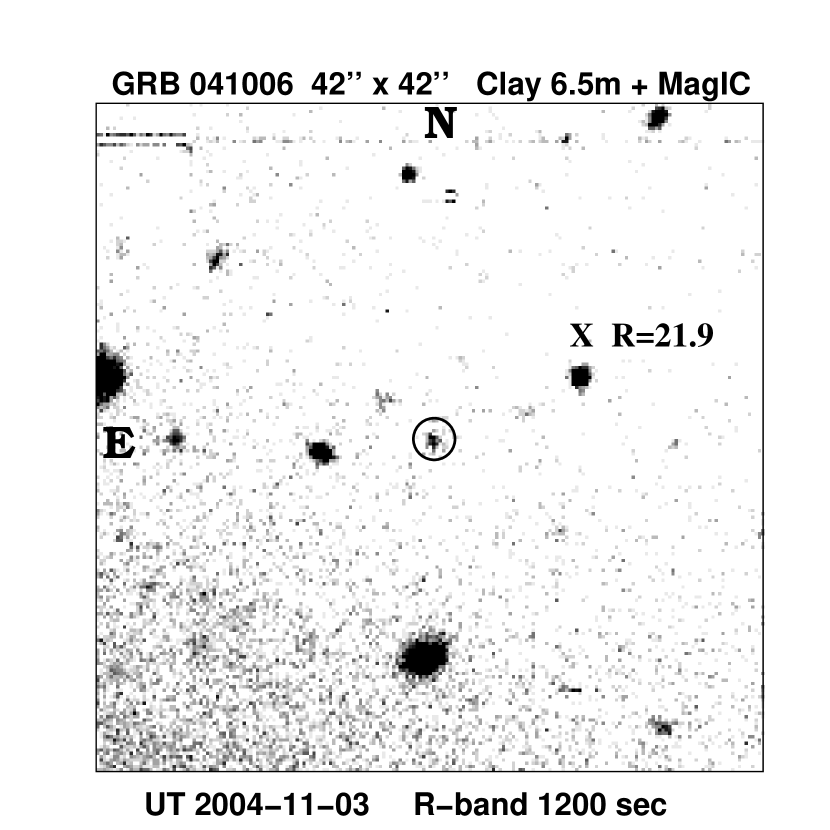
All the data were reduced using DAOPHOT II (Stetson, 1987, 1992). For the MMT data, we have used 10-50 stars to establish the zero-point offset between frames. We found that a nearby star, marked “X” in Figure 1, is constant over many days to within mag, with using the calibration of Garnavich et al. (2004b) and Henden (2004). For other data, we use star “X” as the photometric calibrator. For the MegaCam data, where a Sloan filter was used, we found that it translates well into standard filter magnitudes without a need for a color term.
3 Temporal Behavior in the Photometry
The transition between the phase dominated by the afterglow and the phase dominated by the supernova is marked by an abrupt change in the behavior of the light curve. In §3.1 we consider photometry before this observed change, which occurs about days after the burst. In §3.2 we consider data taken during the following two months.
3.1 Early Photometry: Days 1-4
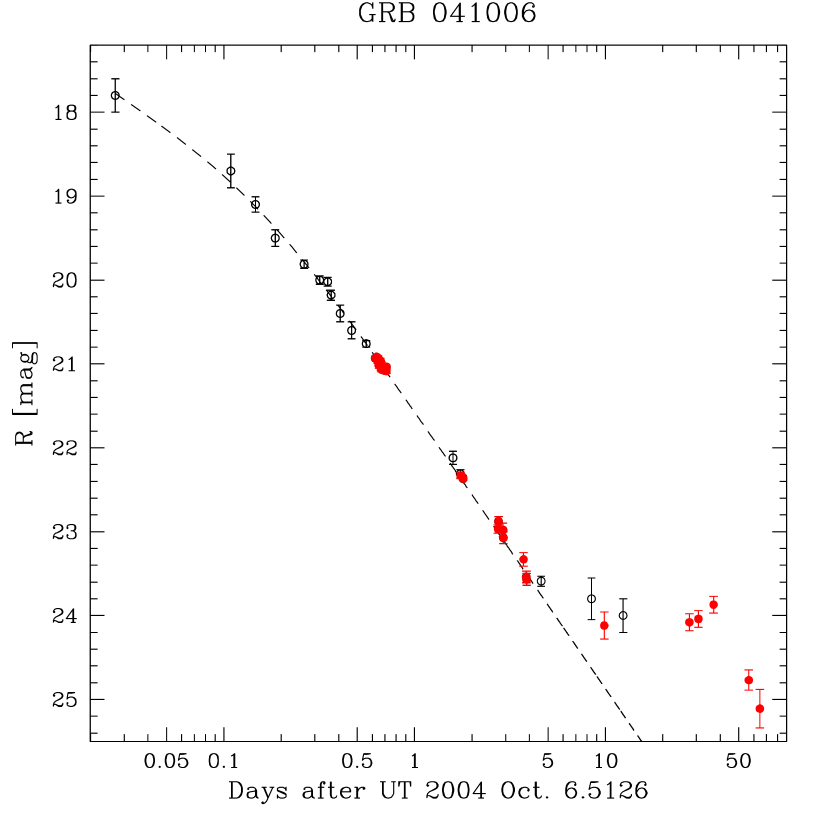
Figure 2 presents the -band light curve for GRB 041006. We have added some data published via the GCN (see the caption of Figure 2 for the references) to fill in the gaps in our data. All of the GCN data were brought to the common zero-point, and if no photometric error was reported, we adopted a conservative value of mag. We have fit the GRB 041006 data with the broken power-law model of Beuermann et al. (1999) (see also Stanek et al. 2001):
| (1) |
where is the time of the break, is the -band flux at and is a parameter which determines the sharpness of the break, where a larger gives a sharper break. This formula smoothly connects the early time decay () with the later time decay (). Equation 1 has been used to describe the afterglow decay of e.g. GRBs 990510 (with ) and 010222 (Stanek et al., 1999, 2001). The fit results in the following values for the parameters: days (we have fixed the value of ). Given the non-uniform data used (i.e. GCN plus our data), the quoted values for the errors of these parameters should be treated with caution.
The resulting fit is shown as the dashed curve in Figure 2. The curve is a good fit to the early afterglow, with . The fit yields a very early break time, days, which is the earliest reported afterglow break (see the compilation of break times, in Table 1 of Friedman & Bloom 2005; see also Ghirlanda et al. 2004). Given the implications for the jet opening angle and the energetics of the burst, it would be valuable to further constrain the break time with robust calibration of other early data.
Short-timescale variability has been seen in the light curves of several afterglows, including GRB 011211 (e.g. Holland et al., 2002) and GRB 021004 (e.g. Bersier et al., 2003). Motivated to look for such short-timescale variability in GRB 041006, the first night on the MMT we obtained 39 high S/N exposures of the afterglow, spanning 2.15 hours from 0.62 to 0.71 days after the burst. No short-timescale variability is present in our data, and the rms deviation of mag from the local power-law fit is consistent with random errors of the photometry. The afterglow of GRB 041006 joins other well observed afterglows, such as GRB 990510 (Stanek et al., 1999) and GRB 020813 (Laursen & Stanek, 2003) in the category of very smooth afterglows.
3.2 Later Photometry: Days 5-65
Over the subsequent two months we obtained -band observations of the OT on a number of epochs. We combine our data with three additional -band photometric measurements published via GCN (Covino et al. 2004; Balman et al. 2004; Bikmaev et al. 2004). These observations are presented in Figure 3.
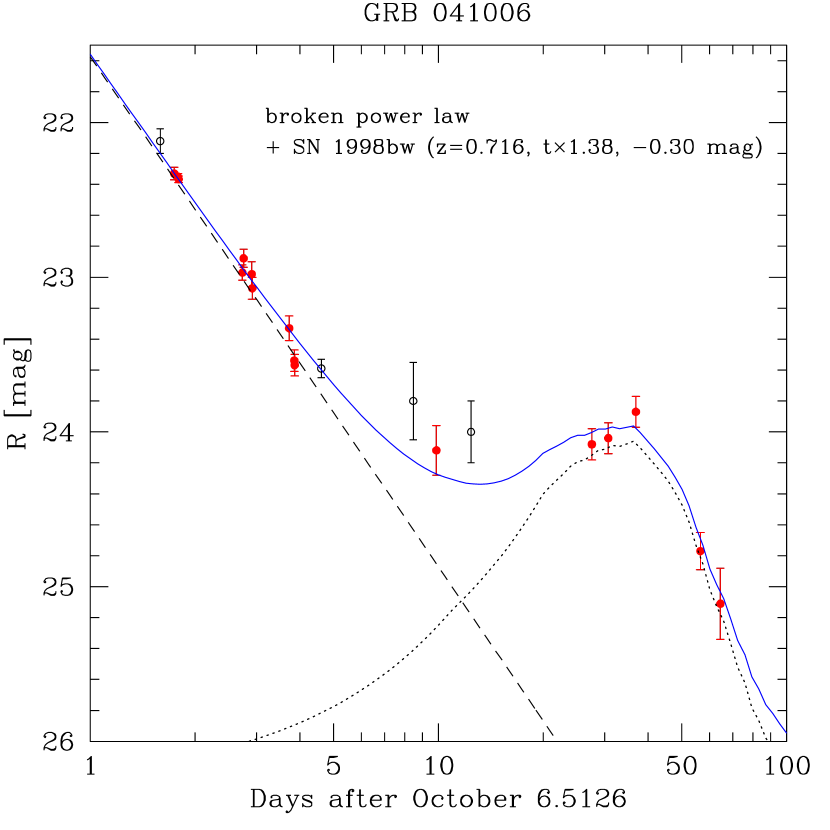
As is apparent in Figure 3, the decay abruptly slows days after the burst. For slightly more than a month, the brightness then remains roughly flat at mags. Over the next 30 days, the OT decays by another magnitude, falling to mag in our final observations.
This clear detection of a light curve “bump” strongly suggests the late-time dominance of the OT by an underlying supernova component. The supernova component peaks at roughly mag about days after the burst, which is several magnitudes brighter than the extrapolated optical afterglow of the GRB at the time of this peak.
To estimate the properties of the hypernova bump in GRB 041006, we correct for the effects of Galactic extinction using the reddening map of Schlegel, Finkbeiner, & Davis (1998). At the Galactic coordinates of GRB 041006, , the foreground reddening is , yielding an expected extinction of . We find that the OT light curve can be well modeled by a stretched SN 1998bw-like bump, k-corrected to redshift , combined with the continued power-law decay of the GRB optical afterglow. It is clear from the data that the amount of stretching of the SN 1998bw light curve needed is significant, and it is basically determined by the rapid decline by about a magnitude from to days after the burst. The composition is shown as the solid line in Figure 3. Indeed, we find a good fit using as a template light curve of SN 1998bw, uniformly stretched in time by a factor of (in addition to the cosmological time dilation), and with significantly brighter peak absolute magnitude (mag brighter). We did not fit for the brightness of the host, as its influence on the derived -band magnitudes would vary for our data set obtained with different telescopes, instruments and varying seeing conditions. To account for that, we adopt an asymmetric error bar for the peak brightness of the supernova of mag.
Thus the hypernova component in the late-time OT of GRB 041006 is long-lasting, in contrast to e.g. GRB 01121/SN 2001ke (Garnavich et al., 2003) and GRB 030329/SN 2003dh (Lipkin et al., 2004; Deng et al., 2005), in which the bumps decay faster than SN 1998bw (see next Section for more discussion). As in the case of GRB 030329/SN 2003dh (Matheson et al., 2003), we find no need to introduce a time delay (either positive or negative) between the afterglow and the supernova component to fit the light curve data. In fact, adding a time delay parameter degrades the value slightly. The best fit time delay is days, i.e. the GRB and the SN were most likely simultaneous.
4 Summary and Discussion
We have obtained deep photometry of the optical transient associated with GRB 041006 for the first two months following the burst. We find that the early-time -band light curve is well fit by a broken power law, with a pre-break index of and a steeper post-break index of . Our fit yields a break time of days after the burst, the earliest jet break observed so far. Early observations also show a very smooth afterglow, with short-timescale deviations from the power-law decay on the same order (mag) as random errors in photometry.
Continuing observations of the optical transient over the two months following the burst show an abrupt change from the decay of the afterglow, consistent with the domination of the photometry by a SN component. The SN light curve peaks at a similar brightness to SN 1998bw but takes more time following the burst to evolve, by a factor of .

To put the light curve features of GRB 041006 into the context of previous GRB/SN observations, we have adopted Figure 3 from Zeh, Klose, & Hartmann 2004 (hereafter ZKH04), which presents the deduced time stretch factors relative to SN 1998bw versus their deduced luminosity ratios of GRB/SNe relative to SN 1998bw. They consider nine GRBs, observed before the end of 2002, for which there exists some evidence of a SN bump. They have suggested a subdivision of these GRBs into a group of five with weak evidence for a bump, and a group of four with statistically significant evidence for a bump (GRBs 990712, 991208, 011121, and 020405; see §3 of ZKH04). In our Figure 4, we present only this latter group, with the additions of GRB 030329/SN 2003dh, which occurred after their cutoff date, and GRB 041006. For GRB 030329/SN 2003dh, we adopt the values for the parameters from a recent paper by Zeh, Klose, & Hartmann 2005 (hereafter ZKH05). It should be stressed that given the bumpy and long-lasting afterglow of GRB 030329, the exact parameters for the underlying SN 2003dh are still subject to debate (Matheson et al. 2003; Lipkin et al. 2004; Deng et al. 2005). We decided not to include another recent GRB/SN case, GRB 031203/SN 2003lw, as it was heavily obscured by foreground Galactic dust and resided in a rather luminous host galaxy. For that supernova, ZKH05 give values for the stretch of , and luminosity ratio of . We note that, among this sample of six, GRB 041006 possesses the highest redshift, with . Also very interestingly, all GRBs with optical afterglows and measured redshifts less than that of GRB 041006 show evidence of late-time SN components (ZKH04). As apparent in Figure 4, GRB 041006 stakes out new parameter space for GRB/SNe, with a very bright and significantly stretched late-time SN light curve.
The distribution of light curve stretch factors and peak brightnesses for hypernovae shown in Figure 4 is reminiscent of the relation found by Phillips (1993) for type Ia SNe (technique introduced by Perlmutter et al. 1997 for their sample of type Ia). We overplot the type Ia relation extended to fast declining events by Garnavich et al. (2004a) and extrapolated to large stretch factors. While the uncertainties for the hypernovae make a conclusive statement difficult, we note that both the hypernovae and type Ia events are likely powered by 56Ni decay and have similar peak luminosities implying comparable 56Ni masses. But with the present data available for them, hypernovae are still a long way from being useful distance indicators. More events like GRB 041006 will be possible to study soon, as the Swift satellite (Gehrels et al., 2004) is already providing accurate localizations for a good number of GRBs.
References
- Balman et al. (2004) Balman, S., et al. 2004, GCN Circ. 2821
- Bersier et al. (2003) Bersier, D., et al. 2003, ApJ, 584, L43
- Beuermann et al. (1999) Beuermann, K., et al. 1999, A&A, 352, 26
- Bikmaev et al. (2004) Bikmaev, I., et al. 2004, GCN Circ. 2826
- Bloom et al. (2002) Bloom, J. S., et al., 2002, ApJ, 572, L45
- Covino et al. (2004) Covino, S., et al. 2004, GCN Circ. 2803
- D’Avanzo et al. (2004) D’Avanzo, P. et al. 2004, GCN Circ. 2788
- Da Costa, Noel, & Price (2004) da Costa, G. S., Noel, N., & Price, P. A. 2004, GCN Circ. 2765
- Della Valle et al. (2003) Della Valle, M., et al. 2003, A&A, 406, L33
- Deng et al. (2005) Deng, J., Tominaga, N., Mazzali, P. A., Maeda, K., & Nomoto, K. 2005, ApJ, in press (astro-ph/0501670)
- Friedman & Bloom (2005) Friedman, A. S. & Bloom, J. S. 2005, ApJ, submitted (astro-ph/04084113)
- Fugazza et al. (2004) Fugazza, D., et al. 2004, GCN Circ. 2782
- Fynbo et al. (2004) Fynbo, J. P. U., et al. 2004, ApJ, 609, 962
- Galassi et al. (2004) Galassi, M., et al. 2004, GCN Circ. 2770
- Galama et al. (1998) Galama, T. J., et al. 1998a, Nature, 395, 670
- Garg et al. (2004) Garg, A., Stubbs, C., Challis, P., Stanek, K. Z.; Garnavich, P. 2004, GCN Circ. 2829
- Garnavich et al. (2003) Garnavich, P. M., et al. 2003, ApJ, 582, 924
- Garnavich et al. (2004a) Garnavich, P. M., et al. 2004a, ApJ, 613, 1120
- Garnavich et al. (2004b) Garnavich, P., Zhao, X., & Pimenova, T. 2004b, GCN Circ. 2792
- Gehrels et al. (2004) Gehrels, N. et al. 2004, ApJ, 611, 1005
- Ghirlanda et al. (2004) Ghirlanda, G., Ghisellini, G.,& Lazzati, D. 2004, ApJ, 616, 331
- Henden (2004) Henden, A. A. 2004, GCN Circ. 2801
- Holland et al. (2002) Holland, S. T., et al., 2002, AJ, 124,639
- Kahharov et al. (2004) Kahharov, B., Asfandiyarov, I., Ibrahimov, M., Sharapov, D., Pozanenko, A., Rumyantsev, V., & Beskin, G. 2004, GCN Circ. 2775
- Kinugasa & Torii (2004) Kinugasa, K. & Torii, K. 2004, GCN Circ. 2832
- Laursen & Stanek (2003) Laursen, L. T. & Stanek, K. Z, 2003, ApJ, 597, L107
- Lipkin et al. (2004) Lipkin, Y. M., et al. 2004, ApJ, 606, 381
- Malesani et al. (2004) Malesani, D., et al. 2004, ApJ, 609, L5
- Matheson et al. (2003) Matheson, T., et al. 2003, ApJ, 599, 394
- McLeod et al. (2000) McLeod, B. A., Conroy, M., Gauron, T. M., Geary, J. C., & Ordway, M. P. 2000, fdso.conf, 11
- Misra & Pandey (2004) Misra, K. & Pandey, S. B. 2004, GCN Circ. 2794
- Monfardini et al. (2004) Monfardini, A., et al. 2004, GCN Circ. 2790
- Phillips (1993) Phillips, M. M. 1993, ApJ, 413, L105
- Perlmutter et al. (1997) Perlmutter et al. 1997, ApJ, 483, 565
- Price et al. (2003) Price, P. A., et al. 2003, ApJ, 589, 838
- Price, Da Costa, & Noel (2004) Price, P. A., da Costa, G. S, & Noel, N. 2004, GCN Circ. 2771
- Price et al. (2004) Price, P. A., et al. 2004, GCN Circ. 2791
- Schlegel, Finkbeiner, & Davis (1998) Schlegel, D. J., Finkbeiner, D. P., & Davis, M. 1998, ApJ, 500, 525
- Stanek et al. (1999) Stanek, K. Z., Garnavich, P. M., Kaluzny, J., Pych, W., Thompson, I. 1999, ApJ, 522, L39
- Stanek et al. (2001) Stanek, K. Z., et al. 2001, ApJ, 563, 592
- Stanek et al. (2003) Stanek, K. Z., et al. 2003, ApJ, 591, L17
- Stetson (1987) Stetson, P. B. 1987, PASP, 99 191
- Stetson (1992) Stetson, P. B. 1992, in ASP Conf. Ser. 25, Astrophysical Data Analysis Software and Systems I, ed. D. M. Worrall, C. Bimesderfer, & J. Barnes (San Francisco: ASP), 297
- Zeh, Klose, & Hartmann (2004) Zeh, A., Klose, S. & Hartmann, D.H. 2004, ApJ, 609, 952
- Zeh, Klose, & Hartmann (2005) Zeh, A., Klose, S. & Hartmann, D.H. 2005, to appear in Proc. ”22nd Texas Symposium on Relativistic Astrophysics” (astro-ph/0503311)
| TaaDays after 2004 October 6.5126 UT. | (s) | ObservatorybbMMT: MMT telescope/MegaCam; VATT: Vatican Advanced Technology Telescope; Clay: Magellan Clay tel./MagIC; Keck II: Keck II tel./ESI; Baade: Magellan Baade tel./IMACS | ||
|---|---|---|---|---|
| 0.6225 | 20.931 | 0.023 | 120 | MMT |
| 0.6311 | 20.918 | 0.017 | 180 | MMT |
| 0.6397 | 20.973 | 0.021 | 120 | MMT |
| 0.6418 | 20.925 | 0.021 | 120 | MMT |
| 0.6437 | 20.954 | 0.020 | 120 | MMT |
| 0.6455 | 20.952 | 0.028 | 120 | MMT |
| 0.6473 | 20.997 | 0.027 | 120 | MMT |
| 0.6492 | 20.995 | 0.033 | 120 | MMT |
| 0.6510 | 21.023 | 0.030 | 120 | MMT |
| 0.6528 | 20.989 | 0.023 | 120 | MMT |
| 0.6547 | 20.975 | 0.035 | 120 | MMT |
| 0.6565 | 21.005 | 0.022 | 120 | MMT |
| 0.6583 | 20.990 | 0.019 | 120 | MMT |
| 0.6601 | 21.010 | 0.027 | 120 | MMT |
| 0.6620 | 20.962 | 0.030 | 120 | MMT |
| 0.6639 | 20.996 | 0.038 | 120 | MMT |
| 0.6657 | 21.051 | 0.032 | 120 | MMT |
| 0.6675 | 20.991 | 0.021 | 120 | MMT |
| 0.6693 | 21.023 | 0.021 | 120 | MMT |
| 0.6712 | 21.070 | 0.023 | 120 | MMT |
| 0.6730 | 21.020 | 0.026 | 120 | MMT |
| 0.6749 | 21.037 | 0.026 | 120 | MMT |
| 0.6767 | 21.057 | 0.025 | 120 | MMT |
| 0.6785 | 21.028 | 0.019 | 120 | MMT |
| 0.6804 | 21.028 | 0.028 | 120 | MMT |
| 0.6822 | 21.073 | 0.029 | 120 | MMT |
| 0.6840 | 21.056 | 0.030 | 120 | MMT |
| 0.6859 | 21.051 | 0.030 | 120 | MMT |
| 0.6877 | 21.036 | 0.028 | 120 | MMT |
| 0.6895 | 21.052 | 0.025 | 120 | MMT |
| 0.6913 | 21.034 | 0.026 | 120 | MMT |
| 0.6931 | 21.077 | 0.025 | 120 | MMT |
| 0.7014 | 21.079 | 0.024 | 120 | MMT |
| 0.7032 | 21.050 | 0.019 | 120 | MMT |
| 0.7051 | 21.044 | 0.023 | 120 | MMT |
| 0.7069 | 21.047 | 0.021 | 120 | MMT |
| 0.7087 | 21.052 | 0.020 | 120 | MMT |
| 0.7105 | 21.036 | 0.022 | 120 | MMT |
| 0.7124 | 21.086 | 0.025 | 120 | MMT |
| 1.7407 | 22.330 | 0.04 | 1500 | VATT |
| 1.7851 | 22.351 | 0.020 | 600 | MMT |
| 1.7931 | 22.367 | 0.022 | 600 | MMT |
| 2.7341 | 22.970 | 0.05 | 4800 | VATT |
| 2.7557 | 22.878 | 0.06 | 600 | MMT |
| 2.9086 | 22.980 | 0.08 | 600 | MMT |
| 2.9176 | 23.072 | 0.07 | 600 | MMT |
| 3.7266 | 23.330 | 0.08 | 4200 | VATT |
| 3.8531 | 23.539 | 0.07 | 600 | MMT |
| 3.8613 | 23.568 | 0.07 | 600 | MMT |
| 9.8622 | 24.119 | 0.16 | 600 | MMT |
| 27.5763 | 24.080 | 0.10 | 1200 | Clay |
| 30.7511 | 24.040 | 0.10 | 1200 | Clay |
| 36.9040 | 23.870 | 0.11 | 720 | Keck II |
| 56.5242 | 24.770 | 0.12 | 1800 | Baade |
| 64.5516 | 25.110 | 0.23 | 1200 | Baade |