A Dark Hydrogen Cloud in the Virgo Cluster
Abstract
VIRGOHI21 is an H i source detected in the Virgo Cluster survey of Davies et al. (2004) which has a neutral hydrogen mass of and a velocity width of km s-1. From the Tully-Fisher relation, a galaxy with this velocity width would be expected to be 12th magnitude or brighter; however deep CCD imaging has failed to turn up a counterpart down to a surface-brightness level of 27.5 mag arcsec-2. The H i observations show that it is extended over at least 16 kpc which, if the system is bound, gives it a minimum dynamical mass of and a mass to light ratio of . If it is tidal debris then the putative parents have vanished; the remaining viable explanation is that VIRGOHI21 is a dark halo that does not contain the expected bright galaxy. This object was found because of the low column density limit of our survey, a limit much lower than that achieved by all-sky surveys such as HIPASS. Further such sensitive surveys might turn up a significant number of the dark matter halos predicted by Dark Matter models.
1 Introduction
Simulations of Cold Dark Matter (CDM) models predict far more dark matter halos than are observed as galaxies (Klypin et al., 1999; Moore et al., 1999). For this reason, it has been hypothesized that there must exist dark matter halos that contain no stars (e.g. Jimenez et al., 1997; Verde et al., 2002). The advent of neutral hydrogen multibeam systems has allowed surveys of large areas of sky to be carried out with much higher sensitivity than has been possible in the past, thus allowing sources to be detected by their gas content alone rather than their stars and opening up the possibility of finding truly isolated clouds of extragalactic gas with no stars. Prior to this, blind H i surveys either covered very small areas or were insensitive to H i column densities lower than cm-2 ( pc-2) (Minchin et al., 2003).
Davies et al. (2004) used the multibeam system on the Lovell telescope at Jodrell Bank Observatory to carry out a deep neutral-hydrogen (H i) survey of the Virgo Cluster (VIRGOHI), covering 32 square degrees and detecting 31 sources. Of these sources, 27 were known cluster members and 4 were new detections. One of the latter lay behind M86 and was thus unobservable optically and one was undetected in follow-up observations and is therefore believed to be a false detection. The other two were confirmed at Arecibo and flagged by Davies et al. as possible isolated H i clouds. One (VIRGOHI27) has an optical counterpart visible in our deep CCD images, the other (VIRGOHI21, the subject of this letter) does not.
There have been several previous claims of the detection of isolated clouds of extragalactic gas with no stars in them, but subsequent analyses have either revealed the optical counterparts (Giovanelli & Haynes, 1989; McMahon et al., 1990), or shown that the gas is merely debris from nearby visible galaxies (Schneider et al., 1983). Many other detections of H i clouds have been associated with nearby optically-bright galaxies (Kilborn et al., 2000; Boyce et al., 2001; Ryder et al., 2001). VIRGOHI21 cannot be so easily explained.
2 Further observations
Following detection, VIRGOHI21 was re-observed at Arecibo. The observations are fully described by Davies et al. (2004), here we give a much more detailed analysis of the Arecibo data and present new VLA and optical observations. The Arecibo observations used a number of pointings in a pattern around the best-fit location from the Jodrell Bank data, leading to the source being detected in five of the Arecibo beams.
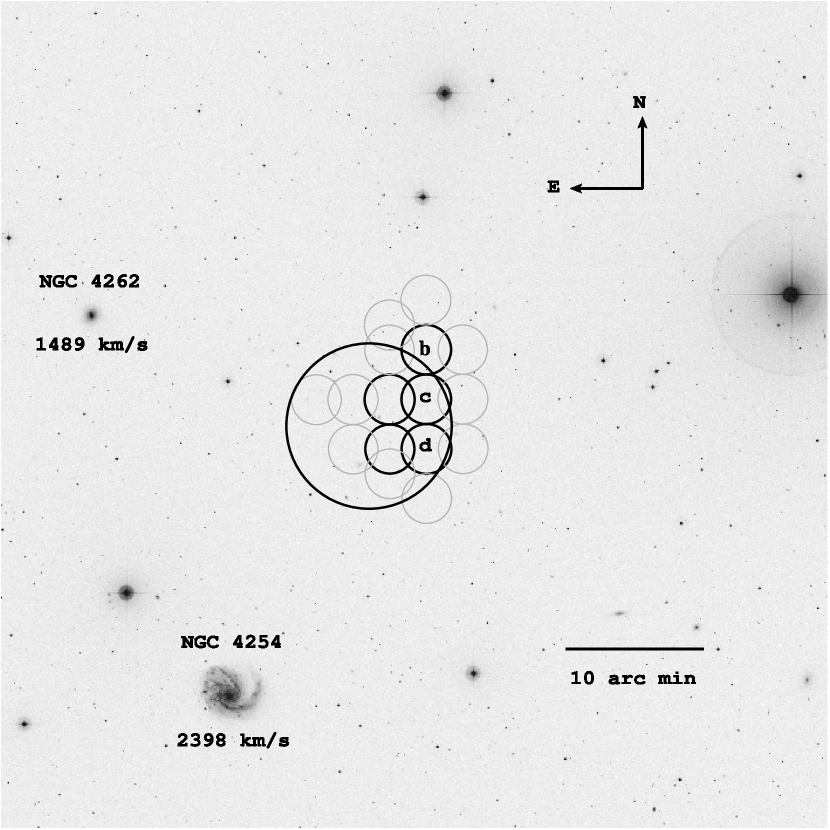
Fig. 1 shows the single-dish spectra of VIRGOHI21. Spectrum (a) is the discovery spectrum from Jodrell Bank, this has a noise level of 4 mJy per 13.2 km s-1 channel and a column-density sensitivity cm-2 if spread over 200 km s-1. From it we measure a total flux of Jy km s-1 and a velocity width at 20 per cent of the peak flux of km s-1. Spectra (b), (c) and (d) are three north through south beams across the source from the Arecibo observations (labelled (b) - (d) in Fig. 2). These have a noise level of 1.3 mJy per 5.5 km s-1 channel, giving cm-2 over 200 km s-1. They reveal a systematic increase in velocity of km s-1 from south to north. Spectrum (e) is the co-added spectrum from all 16 Arecibo beams (shown in Fig. 2) from which we measure Jy km s-1 and km s-1
Fig. 2 shows the Arecibo pointing pattern for VIRGOHI21 and which beams made firm detections (better than ). It can be seen that VIRGOHI21 is extended over at least one Arecibo beam width arc min, or 16 kpc at an assumed distance to Virgo of 16 Mpc (Graham et al., 1999). Using the measured H i flux, we calculate an H i mass of if it is at the distance of the Virgo Cluster, or if it is at its Hubble distance (29 Mpc for H0 = 70 Mpc-1 km s-1). For the rest of this letter we will assume the former as more conservative in this context. The best-position for the center of the H i emission, formed by weighting the Arecibo detection positions by their fluxes, is (J2000). We can dismiss the possibility that this is side-lobe emission from another part of the sky, because VIRGOHI21 has been detected with two telescopes with very different side-lobes. Additionally, there are no H i-massive galaxies in the region that match its velocity profile (Davies et al., 2004).
H i observations with the VLA in D-array in August 2004 reached a column-density limit of cm-2 over 60 km s-1 in 6 hours (0.5 mJy per 20 km s-1 channel with a beam size of arc seconds using natural weighting). Solar interference on the shorter baselines meant that the observations did not reach the hoped-for column-density sensitivity; most of the data from baselines shorter than m (k) had to be flagged as bad. These observations did detect compact H i associated with a nearby dwarf elliptical (MAPS-NGP O_435_1291894) at a different velocity, but, although sensitive to compact, narrow-line gas down to a limit of , were not sensitive enough to low column-density, high velocity-width gas to detect VIRGOHI21. For the Arecibo and VLA observations to be consistent, the source must again exceed 16 kpc in diameter.
We have obtained deep optical CCD images in , and bands with the 2.5-m Isaac Newton Telescope (INT). By binning the -band image (generally the best band for looking for low surface brightness galaxies) into 1 arc sec pixels, we reach a surface-brightness limit of 27.5 mag arcsec-2; treating the and images in the same way gives surface-brightness limits of and of 25.8 mag arcsec-2 respectively. Previous experience indicates that, on the -band frame, we should be able to easily detect objects of ten arc sec scale or larger at this surface brightness limit (Sabatini et al., 2003; Roberts et al., 2004). This is more than 100 times dimmer than the central surface brightness of the disks of typical spiral galaxies (21.5 mag arcsec-2, Freeman, 1970) and dimmer than any known massive low surface-brightness galaxy (26.5 mag arcsec-2, Bothun et al., 1987) or (for typical colors of ) than the lowest surface-brightness dwarf galaxy (26.8 mag arcsec-2 Zucker et al., 2004).
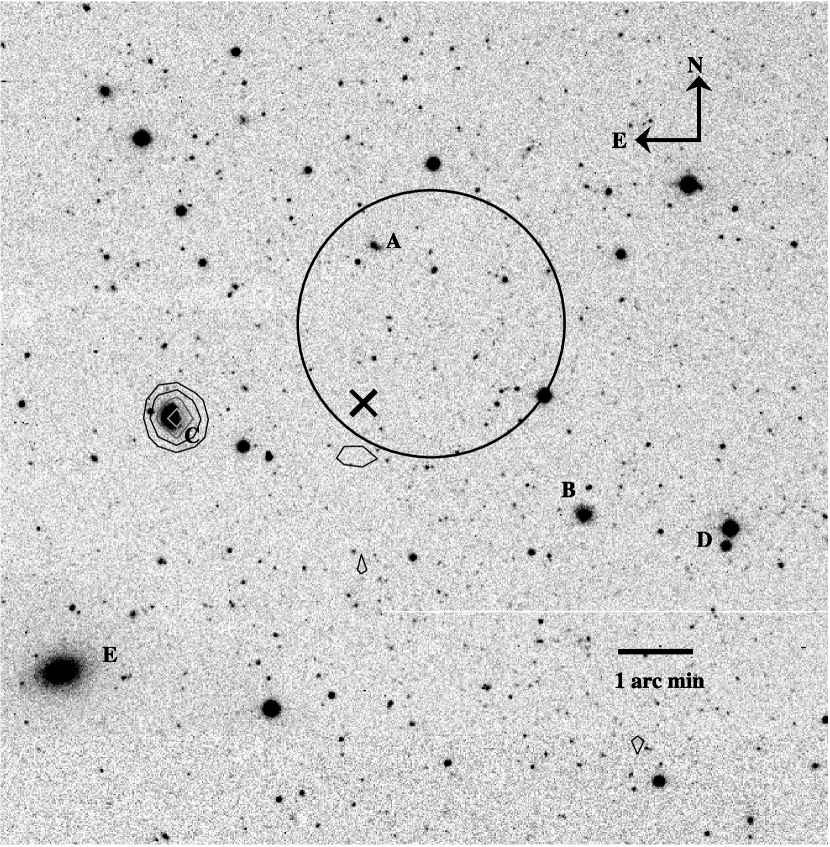
Although we easily were able to identify an optical counterpart (at , J2000) to the other possible H i cloud, VIRGOHI27, no optical counterpart to VIRGOHI21 is visible down to our surface-brightness limit on any of our deep images of this region (Fig. 3), nor can one be found with advanced routines for detecting low surface-brightness galaxies (matched filtering and wavelets, Sabatini et al., 2003). Unlike VIRGOHI27, the bluest objects in the field, which might be associated with H ii regions, are widely distributed without any concentration towards the H i center. Looking at the statistics of the sky noise for the frame, the mean number of counts and the standard deviation (excluding stars) are similar in the area of the H i detection to other, blank areas of sky in the vicinity. The number of detected faint objects is not significantly above the average in a box centred on the H i position: there are 3 objects with in a pixel ( arc sec) region centred on our best H i position, compared to an average of across the cube, and 4 objects with compared to an average of .
As is to be expected there are some features on the image of VIRGOHI21 that are obviously faint galaxies. These are labelled (A) - (E) in Fig. 3. (A) is a small source with a star superposed (which prevents accurate determination of its color and luminosity) 2 arc minutes north of the weighted center, just within the Full Width Half Maximum (FWHM) of the strongest H i beam. Its east-west orientation is at odds with the north-south orientation expected from the velocity field of VIRGOHI21 and, if VIRGOHI21 is rotating, this galaxy is too far north for the rotation to be centred on its position. Neither its size, position nor orientation make this a likely optical counterpart to VIRGOHI21. (B) is another uncatalogued galaxy, 3.5 arc minutes south-west of the weighted center. It lies within the FWHM of an Arecibo beam where there was no detection, thus it cannot be the optical counterpart. There are three objects classified as galaxies within six arc minutes. One (C) at the very edge of one of the Arecibo beams is a dwarf elliptical (MAPS-NGP O_435_1291894) that is detected in our VLA data at 1750 km s-1 (see Fig. 1). The H i is separated both spatially and in velocity from VIRGOHI21 and so it cannot therefore be the optical counterpart. Another of the catalogued galaxies (D - MAPS-NGP O_435_1292289) is a double star miscatalogued as a galaxy, and the third (E - VCC 0273) lies in an Arecibo beam where no detection was made.
We conclude that there is no optical counterpart to VIRGOHI21 down to a -band surface-brightness limit of 27.5 mag arcsec-2. This is less than 1 solar luminosity pc-2, giving a maximum luminosity in stars of solar luminosities if a diameter of 16 kpc is assumed. If VIRGOHI21 is a bound system (see discussion below), this leads to a mass to light ratio in solar units of compared to a typical galaxy like the Milky Way with within its Hi radius (Salucci & Persic, 1997). For standard stellar ratios the upper limit on the mass in stars is approximately equal to the mass in H i.
3 Discussion
The closest bright H i-rich galaxies (, ) are shown in Fig. 2. These are NGC 4262 at 1489 km s-1 and NGC 4254 at 2398 km s-1, each at projected distances of 120 kpc away to the east and southeast respectively. The nearest H i-rich galaxy within 200 km s-1 is NGC 4192A at a projected distance of 290 kpc (Davies et al., 2004). If our detection were tidal debris, then it would have to have been drawn out on a timescale of 16 kpc/200 km s-1 (200 km s-1 being the typical velocity width within a single Arecibo beam), or yr. It follows that the interacting galaxies which generated it must still be close enough that they could have been near VIRGOHI21 yr ago. For the two apparently nearest galaxies (above), that would imply relative projected speeds of greater than 1500 km s-1. This is very high compared to the velocities of galaxies in the outskirts of Virgo (velocity dispersion km s-1) where VIRGOHI21 appears to be situated (Davies et al., 2004), and far too high to favor significant tidal interactions (e.g. Toomre & Toomre, 1972; Barnes & Hernquist, 1992). Furthermore, the observations of VIRGOHI21 show higher velocities to the north and lower velocities to the south, while the two nearby galaxies are placed with the one at a higher velocity to the south and the one with a lower velocity slightly north of due east – the opposite sense to that expected if the velocity gradient in VIRGOHI21 were due to a tidal interaction between them.
If a tidal origin is thus excluded what alternative explanations are compatible with the wide velocity width? Several narrow-line higher column-density clouds at different velocities lined up in the beam? Clouds like this are often associated with tidal debris as the filamentary structure breaks up into separate H i clouds which may form tidal dwarf galaxies (e.g. Hunsberger, Charlton & Zaritsky, 1996). Such clouds should have been detected by our VLA observations; that they were not implies that this is an unlikely explanation. Another possibility is that the gas is not bound – but then it should have dispersed in the same short time-scale of yr. Given the dynamical timescale of the cluster of yr this possibility seems unlikely. The Galactic extinction at this point in the sky is only 0.15 mags in band (Schlegel et al., 1998), therefore it is very unlikely that a galaxy has been hidden by obscuration. As the other possibilities seem so unlikely, one is left with the hypothesis that the gas in VIRGOHI21 is gravitationally bound and moving in stable, bound orbits which prevent shocking – rotation of course comes to mind, as in a flattened disk – a model which is not inconsistent with the spectra. If the system is bound, then its dynamical mass is greater than solar masses (with 8 kpc and = 220 km s-1), not atypical of a rotating galaxy, though its is about 5 times higher than normal spirals.
From the well known Tully-Fisher correlation between rotational velocity and luminosity, calibrated in the Virgo Cluster by Fouqué et al. (1990), our H i detection, if indeed it is a bound system, should correspond to a galaxy with an absolute magnitude of -19. At the distance of the Virgo Cluster this would correspond to a 12th magnitude galaxy, which would normally be extremely prominent at optical wavelengths. VIRGOHI21 appears to be a massive object not containing the expected bright galaxy.
It has been proposed that there is an H i column-density threshold ( cm-2) below which star formation ceases to occur (Toomre, 1964; Martin & Kennicut, 2001). The mean column-density across our central beam at Arecibo is somewhat lower than this, at cm-2 and our VLA observations set an upper limit to the column-density of cm-2. This low column-density provides an explanation for the lack of an optical counterpart: this may be a dark galaxy that has failed to form stars because the low disk surface-density prevents fragmentation of the gas, i.e. it does not satisfy Toomre’s criterion (Verde et al., 2002; Toomre, 1964).
If such dark objects exist in significant numbers, then why has it taken until now to detect one? VIRGOHI21-like objects could only have been detected by H i surveys which meet three criteria: (1) that they are ‘blind’, rather than targeted at previously-identified objects (which, by definition, are not ‘dark’); (2) that they have 5 column-density sensitivity to galaxies with velocity widths km s-1 at the cm-2 level (which rules out older H i surveys); (3) that they have complete optical follow-up observations to deep isophotal limits. While there have been many blind surveys, the only ones to meet the second criterion are HIPASS (Meyer et al., 2004), HIJASS (Lang et al., 2003), AHISS (Zwaan et al., 1997), HIDEEP (Minchin et al., 2003) and VIRGOHI (Davies et al., 2004) and of these, only the last three satisfy the third criterion – that they have complete optical follow-up data. The HIPASS Bright Galaxy Catalogue (Koribalski et al., 2004) (BGC; peak flux 116 mJy), which has recently been used to make the most accurate determination to date of the H i mass function (Zwaan et al., 2003), would not have detected VIRGOHI21 unless it were within six Mpc – a relatively small distance and very close to the level where it would be impossible, in velocity-space, to distinguish a truly isolated H i cloud from one associated with The Galaxy. Taking the volume in which VIRGOHI21 would have been detected (in HIDEEP, VIRGOHI and AHISS) leads to a global density of Mpc-3, equivalent to a contribution to the cosmic density of . To have had more than one detection would therefore imply a very significant contribution to the cosmic density.
4 Conclusions
In the very nature of things it would be difficult to make an indisputable claim to have found a dark galaxy, particularly when past claims to that effect have quickly been ruled out by subsequent observations (either of a dim underlying galaxy or of bridging connections to nearby visible companions). Nevertheless, VIRGOHI21 passes all of the careful tests we have been able to set for it, using the best equipment currently available. Far longer VLA observations might help – but the very low column density and broad velocity width will make VIRGOHI21 an extremely challenging test for any current interferometer. And if every deep 21-cm detection without an optical counterpart is dismissed out of hand as debris – without considering the timing argument we present in Section 3 (which can be used to exclude all previous claims) – one is in effect ruling out, by definition, the detection of any dark galaxy at 21-cm. We cannot of course be certain, but VIRGOHI21 has turned up in one of the two extremely deep 21-cm surveys where you could most reasonably expect to find a dark galaxy, and meets all of the criteria we can, in practice, set for such an elusive but potentially vital object today: in particular such a broad observed velocity width cannot itself be attributed to a tidal interaction if the putative interacting galaxies are well outside the Arecibo beam – as they surely must be here. Future deep H i surveys could reveal a population of such galaxies; with colleagues we are planning such at Arecibo, Jodrell Bank and Parkes.
References
- Barnes & Hernquist (1992) Barnes, J. E. & Hernquist, L. 1992, ARA&A, 30, 705
- Benson et al. (2001) Benson, A. J., Frenk, C. S., Baugh, C. M., Cole, S. & Lacey, C. G. 2001, MNRAS, 327, 1041
- Bothun et al. (1987) Bothun, G. D., Impey, C. D., Malin, D. F. & Mould, J. R. 1987, AJ, 94, 23
- Boyce et al. (2001) Boyce, P. J. et al. 2001, ApJ, 560, L127
- Davies et al. (2004) Davies, J. et al. 2004, MNRAS, 349, 922
- Fouqué et al. (1990) Fouqué, P., Bottinelli, L., Gouguenheim, L. & Paturel, G. 1990, ApJ, 349, 1
- Freeman (1970) Freeman, K. C. 1970, ApJ, 160, 811
- Giovanelli & Haynes (1989) Giovanelli, R. & Haynes M. P. 1989, ApJ, 346, 5
- Graham et al. (1999) Graham, J. A. et al. 1999, ApJ, 516, 626
- Hunsberger, Charlton & Zaritsky (1996) Hunsberger, S. D., Charlton, J. C., & Zaritsky, D. 1996, ApJ, 462, 50
- Jimenez et al. (1997) Jimenez, R., Heavens, A. F., Hawkins, M. R. S. & Padoan, P. 1997, MNRAS, 292, L5
- Karachentsev et al. (2004) Karachentsev, I. D., Karachentseva, V. E., Huchtmeier, W. K. & Makarov, D. I. 2004, AJ, 127, 2031
- Kilborn et al. (2000) Kilborn, V. A. et al. 2000, ApJ, 120, 1342
- Klypin et al. (1999) Klypin, A., Kravtsov, A. V., Valenzuela, O. & Prada, F. 1999, ApJ, 522, 82
- Koribalski et al. (2004) Koribalski, B. S. et al. 2004, AJ, 128, 16
- Lang et al. (2003) Lang, R. et al. 2003, MNRAS, 342, 738
- McMahon et al. (1990) McMahon, R. G., Irwin, M. J., Giovanelli, R., Haynes, M. P., Wolfe, A. M. & Hazard, C.. 1990, ApJ, 359, 302
- Martin & Kennicut (2001) Martin C. L. & Kennicut, R. C. 2001, ApJ, 555, 301
- Meyer et al. (2004) Meyer, M. J. et al. 2004, MNRAS, 350, 1195
- Minchin et al. (2003) Minchin, R. F. et al. 2003, MNRAS, 346, 787
- Moore et al. (1999) Moore, B., Ghigna, S., Governato, F., Lake, G., Quinn, T., Stadel, J. & Tozzi, P. 1999, ApJ, 524, L19
- Roberts et al. (2004) Roberts, S. et al. 2004, MNRAS, 352, 478
- Ryder et al. (2001) Ryder, S. D. et al. 2001, ApJ, 555, 232
- Sabatini et al. (2003) Sabatini, S., Davies, J., Scaramella, R., Smith, R., Baes, M., Linder, S. M., Roberts, S., & Testa, V. 2003, MNRAS, 341, 981
- Salucci & Persic (1997) Salucci , P. & Persic, M. 1997, in ASP Conf. Ser. 117, Dark and Visible Matter in Galaxies, ed. M. Persic & P. Salucci (San Francisco: ASP), 242
- Schlegel et al. (1998) Schlegel, D. J., Finkbeiner, D. P. & Davis, M. 1998, ApJ, 500, 525
- Schneider et al. (1983) Schneider, S. E., Helou, G., Salpeter, E. E. & Terzian, Y., 1983, ApJ, 273, 1
- Spergel et al. (2003) Spergel, D. N. et al. 2003, ApJ, 148, 175
- Toomre & Toomre (1972) Toomre, A. & Toomre, J. 1972, ApJ, 178, 623
- Toomre (1964) Toomre, A. 1964, ApJ, 139, 1217
- Verde et al. (2002) Verde, L., Oh, S. P. & Jimenez, R. 2002, MNRAS, 336, 541
- Zucker et al. (2004) Zucker, D. B. et al. 2004, ApJ, 612, L121
- Zwaan et al. (1997) Zwaan, M. A., Briggs, F. H., Sprayberry, D. & Sorar, E. 1997, ApJ, 490, 173
- Zwaan et al. (2003) Zwaan, M. A. et al. 2003, AJ, 125, 2842