2-Special Astrophysical Observatory, Nizhnii Arkhys 369167, Russia
A dwarf galaxy with a giant HI disk
We present Giant Meterwave Radio Telescope (GMRT) HI 21cm images of a nearby dwarf irregular galaxy NGC 3741 () which show it to have a gas disk that extends to times its Holmberg radius. This makes it probably the most extended gas disk known. Our observations allow us to derive the rotation curve (which is flat in the outer regions) out to 38 optical scale lengths. NGC 3741 has a dynamical mass to light ratio of 107 and is one of the “darkest” irregular galaxies known. However, the bulk of the baryonic mass in NGC 3741 is in the form of gas and the ratio of the dynamic mass to the baryonic mass (), falls within the range that is typical for galaxies. Thus the dark matter halo of NGC 3741 has acquired its fair share of baryons, but for some reason, these baryons have been unable to collapse to form stars. A comparison of NGC 3741’s dark halo properties with those of a sample of galaxies with well measured rotation curves suggests that if one has to reconcile the observations with the expectation that low mass galaxies suffer fractionally greater baryon loss then baryon loss from halos occurs in such a way that, in the net, the remaining baryons occupy a fractionally smaller volume of the total halo.
Key Words.:
galaxies: dwarf – galaxies: kinematics and dynamics – galaxies: individual: NGC 37411 Introduction
Numerical simulations of hierarchical galaxy formation predict that galaxies should have dark halos with virial radius times the size of the stellar disk and a total mass of times the stellar mass. Since the HI disks of galaxies typically extend to only times the optical radius, one cannot test these model predictions using HI rotation curves. The mass distribution on such large scales can however be probed using weak lensing or the kinematics of faint satellite galaxies. Though neither of these techniques can be applied to individual galaxies, when applied to a large sample of galaxies, they do provide at least qualitative confirmation (for galaxies) of the models (see e.g. Brainerd, 2004).
While, dark matter halos are expected to be self similar (Navarro et al. 1997), there are no direct determinations of the typical virial size and mass of dwarf galaxy halos. For small galaxies, both weak lensing as well as the kinematics of still fainter companions are correspondingly difficult to measure. Further, the rotation curves for most of the faint dwarf irregulars are typically rising even at the last measured point, implying that one has been unable to probe beyond the core of the dark halo, leave alone its virial radius. There are however a few dwarf galaxies known with unusually extended HI disks (e.g. DDO154, Carignan & Beaulieu, 1989; NGC 2915, Meurer et al. 1996;ES0215-G?009, Warren et al. 2004), where the HI extends to more than 5 times the Holmberg radius (RHo). The extended HI gas in such galaxies traces the dark matter potential upto large galacto-centric radii and hence provide a unique opportunity to measure the larger scale mass distribution around dwarf galaxies. We discuss here GMRT 111The GMRT is operated by the National Center for Radio Astrophysics of the Tata Institute of Fundamental Research HI observations of one such galaxy with an extended HI disk, viz. NGC 3741. Our GMRT observations show that this galaxy has a regular HI disk that extends out to times RHo. Like other known galaxies with unusually extended disks, NGC 3741 is also located in the vicinity of the local group.
2 Observations and data reduction
The GMRT observations of dwarf irregular galaxy NGC 3741 () 222Using apparent blue magnitude 14.380.1 (Bremnes et al. 2000), galactic extinction correction Ab = 0.11 mag (Schlegel et al.) and TRGB distance of 3.0 Mpc (Karachentsev et al. 2004). were conducted on 22 July and 26 Aug 2004. The channel spacing was km s-1, and the total velocity coverage was km s-1. 3C286 was used as the flux and bandpass calibrator, while the VLA calibrator 1227+365 was used to do phase calibration. The total on-source time was 8 hours.
The data were reduced using standard tasks in classic AIPS. Image data cubes were made at various resolutions (see the caption of Fig. 1). Moment maps of the line emission were made using the AIPS task MOMNT.
3 Results and Discussion
3.1 HI distribution and kinematics
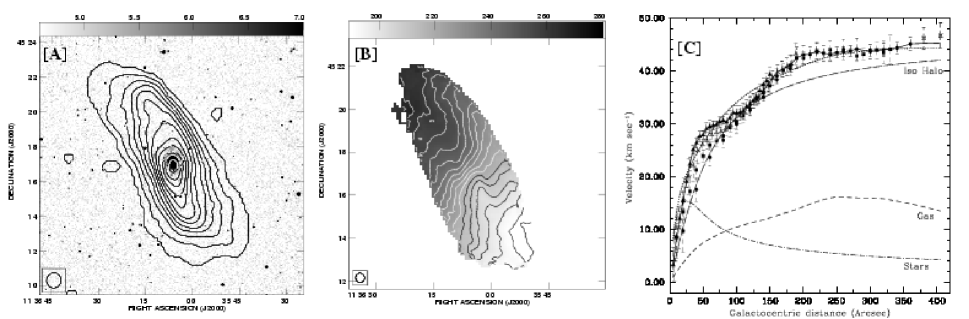
Fig 1[A] shows the integrated HI emission from NGC 3741 (at 52 resolution), overlayed on the digitised sky survey image. As can be seen, the HI distribution of NGC 3741 is regular and extends to 13.8′ in diameter, at a level of cm-2 ( 13.4′ in diameter, at a level of cm-2). The Holmberg diameter of NGC 3741 measured from the B band surface brightness profile is (Bremnes et al. 2000) the HI disk is hence 8.3 times the Holmberg diameter. The HI distribution has a central bar, more clearly seen in the higher resolution maps (not shown), which is approximately coincident with the optical emission.
The integrated flux estimated from the HI emission profile is Jy km s-1(corresponding to an HI mass of ). The HI flux measured at GMRT is more than the single dish flux ( 53.0 Jy km s-1, Schneider et al. (1992)). The single dish observations, done with the Greenbank 300ft telescope with a single pointing centered on the optical galaxy, would have underestimated the total flux of the galaxy, as the extent of the HI disk of the galaxy is bigger than the beam size of the telescope. The flux integral estimated from our GMRT observations is also likely to be a lower limit on the total HI flux of the galaxy as the GMRT is well known to resolve out flux for galaxies that are this extended (e.g. Omar, A., 2004). Our flux measurement hence places a lower limit on the ratio of =.
The velocity field of NGC 3741 (at 26 resolution) is shown in Fig. 1[B]. The velocity field is regular, with a warp being seen in the outer regions of the galaxy, as well as distortions in the central region, which correlate with the central bar. The central distortions of the isovelocity contours are more prominent in the higher resolution velocity fields.
Fig.1[C] shows the rotation curves for NGC 3741 derived from the various resolution velocity fields using the tilted ring model. The kinematical inclination of the galaxy was found to vary from 58∘ to across the galaxy, whereas the kinematical position angle varied from 33∘ to 47∘. The final adopted rotation curve (solid line) is measured upto 38 disk scale length (the B band scale length is 10.75′′; Bremnes et al. 2000). The rotation curve shows a flattening beyond ; NGC 3741 is one of the faintest known dwarf galaxies to show a clear flattening of the rotation curve. A steep rise in the rotation velocities within the Holmberg radius is probably related to the bar at the center of the galaxy. The rotation curve was also derived (at each spatial resolution) independently for the approaching and the receding side of the galaxy. These curves match within the errorbars. Correction for the “asymmetric drift” was also done and was found to be small compared to the errorbars at all radii.
Modified isothermal and NFW mass models were fit to derived rotation curve. Fig. 1[C] shows the best fit modified isothermal halo model, which has a mass to light ratio () for the stellar disk (which was assumed to be an exponential disk with intrinsic thickness ratio of 0.25) of 0.90.1, a halo with core radius rc=0.70.1 kpc and core density pc-3. The best fit NFW mass model (not shown) gives of 0.30.1, a concentration parameter c=11.40.8 and V km s-1. Both type of dark halos provide a comparable fit to the derived rotation curve. The bar linked central distortion of the velocity field is a major contributor to our inability to distinguish between these two models.
3.2 Discussion

NGC 3741 probably has the most extended HI disk known. In comparison, VLA observations of DDO154, (the commonly cited example of the largest known HI disk), detected HI up to 5 times RHo (Carignan & Beaulieu, 1989); the follow-up Arecibo observations detected HI upto 8.5 times RHo (Hoffman et al. 1993), although these last observations do not lead to a good quality rotation curve. Most other galaxies with extended HI envelopes show severe tidal distortions, e.g. IC 10 (Wilcot & Miller 1998).
The total dynamical mass of NGC 3741 (at the last measured point of the rotation curve) is , i.e. the dynamical mass to light ratio is ; NGC 3741 is hence one of the “darkest” irregular galaxies known. A fundamental question which arises is whether NGC 3741’s dark halo is the same as those of similar dwarf galaxies with less extended disks, i.e. is the extended HI just a fortuitous tracer of the gravitational potential, or does the presence of such an extended disk mean that we are dealing with a different (e.g. more massive than typical) halo? Equivalently, should we regard NGC 3741 as a 13th magnitude dwarf which somehow acquired a lot of gas, or should we regard it as a galaxy that should “rightly” have been much brighter, but for some reason it failed to convert its gas into stars? Indeed, why do some galaxies have such extended HI disks?
We start by trying to address the first set of questions, viz. regarding the nature of the dark halo of NGC 3741 as compared to those of “similar” galaxies. In Fig. 2[A] is shown the dynamical mass to light ratio MD/LB (at the last measured point of the rotation curve) as function of the absolute blue magnitude (MB) for a sample of galaxies with measured HI rotation curves. Galaxies with the most extended HI disks viz. NGC 3741, DDO 154 and ESO 215-G?009 333ESO 215-G?009 has a very uncertain . In this paper we use the nominal value suggested by Warren et al. (2004). are marked with triangles. As can be seen, the well known (albeit weak and noisy) trend of increasing dynamical mass to light ratio with decreasing galaxy luminosity is recovered, and in addition, dwarfs with an extended HI disks can be seen to have fairly extreme mass to light ratios. However, given that for galaxies with extended HI disks the total baryonic mass is dominated by the HI mass, instead of comparing it might be more fair to compare dynamical to baryonic mass ratio (), where Mbar is the baryonic mass. We define Mbar=Mgas+M∗, and assume a stellar mass to light ratio, =1.0 for all galaxies in the sample. Mgas is defined as MHI. From Fig. 2[B] one can see that does not show any correlation with MB, i.e. (proviso the naiveness of our baryonic mass calculation), even though dwarf galaxies tend to have a higher total mass to luminosity ratio, they have dynamical to baryonic mass ratios that are similar to those of galaxies. Further the dynamical mass to baryonic mass ratio for galaxies with extended HI disks, though large, lies within the range of what is observed for other galaxies in the sample. In particular, given its dynamical mass, NGC3741 does not have an anomalously small fraction of baryons. The other interesting feature in Fig. 2[B] is the uniformly large scatter in the dynamical to baryonic mass ratio and the lack of a statistically significant trend in MD/Mbar with galaxy size. Quantitatively, the average Mbar/MD is for galaxies brighter than mag, and for galaxies fainter than mag. This is in apparent contradiction to simulations of galaxy formation, which predict that dwarf galaxies should have both a smaller baryon fraction than large galaxies, and also a larger dispersion in the baryon fraction (Gnedin et al. 2002). These differences in the baryon fractions of large and small galaxies come about because for small halos the heating of gas at reionization inhibits the capture of baryons and further a good fraction of the captured baryons are subsequently lost due to the energy input from star formation. However it is important to distinguish between the baryonic fraction as calculated in numerical simulations (which is generally defined as the ratio of the total mass within the virial radius to the total baryonic mass) and that plotted in Fig. 2[B] which is the ratio of total dynamical mass to the total baryonic mass within the radius to which the HI disk extends. Since baryons cool and collect at the centers of dark matter halos, in any given halo the baryon fraction is a decreasing function of radius. This means that one could reconcile the rotation curve data with the theoretical models by requiring that the baryons in dwarf galaxies occupy a proportionately smaller fraction of their dark matter halos as compared to large galaxies. If this is what indeed happens, it is somewhat surprising that things nonetheless conspire to give a more or less constant baryon fraction within the last measured point of the rotation curve. A similarly surprising correlation between baryonic mass and velocity width (the “baryonic Tully-Fisher” relationship) has been reported by Mcgaugh et al (2000). Of course, since many dwarf galaxies have rising rotation curves (i.e. the gas and stars lie entirely within the cores of their dark matter halos) it seems intuitive to suppose that the baryons in these galaxies occupy a smaller fraction of their dark matter halos. Since all the galaxies in our sample have measured rotation curves, it is straight forward to compare the baryon fraction in galaxies with rising rotation curves with that in galaxies which have flat rotation curves. In Fig. 2[C] MD is plotted as a function of Mbar, separately for galaxies with flat rotation curves (filled circles) and rising rotation curves (crosses). As can be seen, there is a substantial range of baryonic masses at which one finds both galaxies with rising rotation curves as well as galaxies with flat rotation curves. However, at any given baryon mass, galaxies with rising rotation curves tend to have a lower dynamical mass than galaxies with flat curves. Equivalently, within the volume occupied by the baryons, galaxies with flat rotation curves have smaller baryon to dynamical mass fractions than galaxies with rising rotation curves. Quantitatively, the mean Mbar/MD is for galaxies with flat rotation curves, and for galaxies with rising rotation curves.
In essence, the baryon fraction within the last measured point of the rotation curve depends on both the baryon loss as well as the maximum distance from the halo center upto which the remaining baryons extend. Which of these two ends up being dominant depends on the details of the actual baryon loss processes. If one postulates that all halos start with at most the cosmic baryon fraction () and that galaxies with rising rotation curves are those that have lost baryons, then in these galaxies the smaller sampling of the halo dominates over the baryon loss. On the other hand, dwarf spheroidal galaxies which have both very large dynamical mass to light ratios (Mateo 1998), as well as postulated small halo occupation fractions ( Stoehr et al. 2002) would have to be cases in which the baryon loss dominates over the decrease in halo occupation. And finally, galaxies with extremely extended gas distributions (like NGC 3741) are likely to be those for which there has been very little net baryon loss, (possibly because the gas has not been able to collapse to form stars) and the baryons sample a larger fraction of the total halo,
Which brings us back to the question that why NGC 3741 has been unable to convert its baryons into stars. It is often assumed that star formation requires a threshold column density. All the optical emission in NGC 3741 is found to lie within a region with HI column density cm-2. This makes it very similar to typical dwarf irregular galaxies, where observationally, one sees that star formation has occurred only above a threshold column density of cm-2(Skillman 1987). While this could be a possible explanation as to why the gas in NGC 3741 has not been converted to stars, it does not explain why the galaxy has such an unusually extended HI disk in the first place. Perhaps galaxies with extended HI disks are just those which have had a fortuitously long duration disk building history. For example the most extended galaxies known N3714, ESO215-G?009 and DDO154 have a tidal index of -1.0 (Karachentsev et al. 2004), i.e. these galaxies are neither so isolated that the probability of accreting material is small nor are they in so dense an environment so as to get perturbed (either into a burst of star formation and/or into loosing their gas disks) by larger neighbours. A location in a region of modest density enhancement is perhaps a necessary (but not sufficient!) condition for a galaxy to quiescently and inconspicuously accrete gas into a large disk.
References
- Bremnes et al. (2000) Bremnes, T., Binggeli, B. & Prugniel, P., A&AS,2000,141,211.
- Brainerd, T. (2004) Brainerd, T. G., 2004, astro-ph/0411244
- (3) Carignan, C. & Beaulieu, S., 1989, ApJ, 347, 760
- Côté et al. (2000) Côté S., Carignan, C. & Freeman, K.C., 2000, AJ 120, 3027.
- (5) Gnedin, O.Y. & Zhao, H., 2002, MNRAS, 333, 299
- Hoffman et al. (1993) Hoffman, G.L., Lu, N.Y., Salpeter, E.E., Farhat, B., Lamphier, C. & Roos, T., 1993, AJ, 106, 39
- Karachentsev et al (2004) Karachentsev, I.D., Karachentseva, V.E., Huchtmeier, W.K. & Makarov, D.I., 2004, 127, 2031
- McGaugh et al. (2000) McGaugh, S.S., Schombert, J.M., Bothun, G.D., & de Blok, W.J.G. 2000, ApJL, 533, 99
- Meurer et al. (1996) Meurer, G.R., Carignan, C., Beaulieu, S.F. & Freeman, K.C., 1996, AJ, 111, 1551
- Omar, A. (2004) Omar, A., PhD Thesis, JNU University, 2004
- Skillman, E. D. (1987) Skillman, E. D., 1987, Star formation in galaxies, NASA Washington, Lonsdale Persson C.J. (ed.) p 263
- Navarro et al (1997) Navarro, J.F., Frenk, C.S. & White S.D.M., 1997,ApJ,490,493
- Schlegel et al. (1998) Schlegel, D.J., Finkbeiner, D.P. & Davis,M., 1998, ApJ, 500, 525
- Schneider et al. (1992) Schneider, S.E., Thuan, T.X., Mangum, J.G. & Miller, J.,1992, ApJS, 81,5
- Stoehr, et al. (2002) Stoehr, F., White, S.D.M., Giuseppe, T. & Springel. V., 2002, MNRAS, 335, L84
- Swaters, R. (1999) Swaters, R.A., 1999, Ph.D. thesis, Rijksuniversiteit Groningen.
- Verheijen (2001) Verheijen, M.A.W. 2001, ApJ, 563, 694
- Mateo (1998) Mateo, M, ARA&A, 1998, 36, 435
- Warren et al (2004) Warren, B.E., Jerjen, H. & Koribalski, B.S., 2004,AJ,128,1152
- Wilcot & Miller (1998) Wilcots, E.M. & Miller, B.W., 1998, AJ, 116, 2363.