Abell 370: A Cluster with a Pronounced Triaxial Morphology
Abstract
We have developed a new method to constrain the intrinsic three-dimensional shape of galaxy clusters using combined Sunyaev-Zel’dovich effect (SZE) and X-ray observations. We here present a first empirical implementation of this tool to an extremely intriguing distant galaxy cluster: Abell 370.
keywords:
Galaxy clusters, A 370, X-rays , Sunyaev-Zel’dovich effect , cosmology, distance scalePACS:
98.65.Cw , 95.85.Nv , 98.80.Es, , and
1 Introduction
The intrinsic, three-dimensional (3-D) shape of clusters of galaxies is an important cosmological probe. The structure of galaxy clusters is in fact a helpful diagnostic of mass density in the universe and can help in discriminating between different cosmological models. A realistic modelling of the intrinsic shape is hence critical for a correct measure of the observed properties of clusters of galaxies. Assumptions made on the cluster shape strongly affect several other methods that estimate cosmological parameters from observations of galaxy clusters: it in fact influences the determination of the Hubble constant and of the cluster mass and baryon fraction (Cooray, 1998). Also, projection effects can partially account for the observed discrepancies in cluster mass determination between lensing, X-ray and dynamical mass estimates.
2 Theoretical Approach
Cosmic microwave background (CMB) photons that pass through a cluster interact with the energetic electrons of its hot intra-cluster medium (ICM) through inverse Compton scattering, with a probability . This interaction causes a small distortion in the CMB spectrum, known as the SZE (Sunyaev & Zeldovich, 1970). The SZE is proportional to the electron pressure integrated along the line of sight (l.o.s.), i.e. to the first power of the gas density. The measured temperature decrement of the CMB is:
| (1) |
The cluster X-ray emission is due to bremsstrahlung from electron-ion collisions; the X-ray surface brightness, , is proportional to the projection along the l.o.s of the square of the electron density:
| (2) |
If we assume that the ICM is described by an isothermal triaxial -model distribution, then:
| (3) |
where the central values are given by:
| (4) |
| (5) |
In the above formulas: is the temperature of the ICM, the
Boltzmann constant, the temperature of the
CMB, the Thompson cross section, the
electron mass, the speed of light in vacuum, the angular
diameter distance to the cluster,
the projected angular position on the plane of the sky (p.o.s.) of the observer
orthogonal coordinate , a function of the cluster shape and
orientation (Stark, 1977), the intrinsic axial ratios, the axial ratio
of the major to the minor axes of the observed projected isophotes,
the projection on the p.o.s. of the cluster angular
intrinsic core radius, the X-ray cooling function of the ICM in the
cluster rest frame and
accounts for frequency shift and relativistic corrections.
SZE and X-ray emission depend differently on the density of ICM, and
therefore also on the assumed cosmology. A joint analysis of SZE
measurements and X-ray imaging observations makes it then possible to
determine the distance to the cluster (Birkinshaw, 1999; Reese et al., 2002). One can
in fact solve Eqs. (4) and (5) for the
angular diameter distance , by eliminating .
If the redshift of a cluster is known, the angular diameter distance
between an observer and a source can be easily computed, for a fixed cosmology.
Under the assumption of spherical symmetry for the cluster, the experimental and the
cosmological angular diameter distances assume the same value:
| (6) |
Since under this assumption the 3-D morphology of the cluster is completely known,
can be computed combining
SZE and X-ray observations (Eqs. 4, 5).
The standard approach in the past decades has been to take advantage of this
complete knowledge of
under the assumption of spherical symmetry,
to estimate , provided that and are
known from independent observations (Reese et al., 2002; Mason et al., 2001).
The same approach clearly cannot be applied when the assumption of spherical symmetry is
relaxed and clusters are considered as more general triaxial systems.
While is computed integrating cluster physical
properties along the l.o.s., is based on the cluster
size on the p.o.s. If the cluster is not spherically symmetric, Eq. 6 is
therefore replaced by the more general:
| (7) |
The classical approach used in the past years can though be easily inverted to constrain the three-dimensional morphology of a cluster. Here we follow this opposite approach. We assume both the values of and of to be known: can be then determined. We then use Eq. (7), together with other geometrical relations (De Filippis et al., 2005), to infer the three-dimensional morphology of a sample of galaxy clusters. We believe our assumption of a known cosmology to be fully justified by recent results from observational cosmology, which have allowed an unprecedented accuracy in testing theoretical models. Consistently with these results (Tegmark et al., 2004) we use a flat () cosmological model with , and with a non null cosmological constant.
3 Empirical Test on A 370
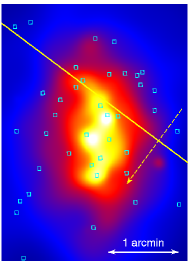
Abell 370 (z=0.375) is a rich cluster for which both strong and weak lensing have been detected. In the optical wave-band its emission is dominated by two giant elliptical galaxies. Both the optical and X-ray morphology are strongly elongated in the north-south direction. Lensing analyses have provided evidence that the cluster has a bimodal structure and that it is not fully relaxed (Bézecourt et al., 1999; Kneib et al., 1993). The Chandra observation (left panel in Fig. 1) shows a remarkably elliptical, diffuse X-ray emission. Analyzing the redshift distribution of all cluster galaxies with spectroscopic redshifts, we have measured a trend of increasing redshift toward south-east (in the direction shown by the dashed arrow). In particular:
-
•
galaxies north-west of the solid line are distributed in a stripe-like morphology parallel to the line -i.e. at respect to the main cluster elongation- and have an average redshift z=0.368;
-
•
galaxies south-east of the line do not instead show a preferential direction and have an higher average redshift (z=0.382).
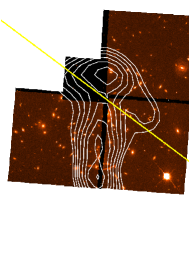
Contours from an X-ray hardness ratio (HR) map of the cluster are superposed on its HST image, in the right panel in Fig. 1.
The HR map shows two soft peaks located in the south portion of the cluster, in coincidence
with two bright cluster galaxies. A third soft peak is located just north of the solid line:
this is much more diffuse than the two southern ones and it is oriented in the same direction
of the galaxy distribution.
Strong discrepancies have been observed for this cluster among the values of the total mass computed at different wavelengths; also average cluster temperatures estimated with different instruments strongly disagree. This comes as no surprise since such an irregular cluster, which contains substantial substructures, might not be fully virialized and partially supported by turbulent bulk gas motion; possible deviations from isothermality can also partially affect the cluster total mass determination. Although the hypotheses of hydrostatic equilibrium and isothermal gas are very strong, it has been recently shown that mass densities obtained under such assumptions
can yield accurate estimates even in dynamically active clusters, once the gas density distribution is properly mapped (De Filippis et al., 2004; Ettori & Lombardi, 2003).
3.1 Results
A 370 is part of a sample of 25 clusters on which we are performing this combined X-ray and SZE analysis (De Filippis et al., 2005). The cluster shows an highly elliptical X-ray diffuse emission, with projected axes ratio: . With our combined X/SZE analysis we estimate a value of the angular diameter distance: , while its cosmological value is: .
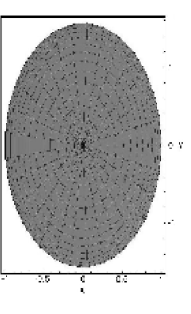
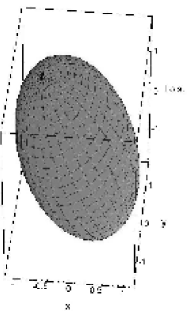
A comparison of these two estimates of the angular diameter distance reveals that the cluster is also strongly elongated along the l.o.s. (see Fig. 2) with a sharp triaxial morphology: , where is the ratio between the cluster elongation along the l.o.s. and the minor axis in the p.o.s..
Our finding of a strong elongation along the l.o.s. and of a redshift difference between the two main galaxy concentrations, together with results from lensing which have provided evidence that the cluster has a bimodal structure, strongly suggest that A 370 has two (or more) substructures in the process of merging, which must be taking place at a small angle respect to the l.o.s. A 370 turns out to be one of the clusters in our sample with the most strongly pronounced triaxial morphology.
4 Summary and Future Work
We have applied a combined X-ray/SZE analysis to the galaxy cluster A 370 in order to infer its triaxial morphology. A 370 turns out to be strongly elongated along the l.o.s., with two (or more) substructures in the process of merging. Spectroscopic redshifts of member galaxies suggest that the process must be taking place at a small angle respect to the l.o.s..
With such a large merger taking place we expect gas bulk motions of in the cluster; this will lead to a shift in the center of the emission line . Possible broadening of emission lines of heavy elements, due to hydrodynamic turbulence in the IC gas would also be present. Since both the above features can be easily detected by XRS, A370 would be a perfect target for ASTRO-E2. This would lead to a possible measurement of bulk motion of the IC gas and allow to constrain the dynamical stages of the ICM.
This work was supported by NASA grants NAS8-39073 and NAS8-00128.
References
- Bézecourt et al. (1999) Bézecourt, J., Kneib, J. P., Soucail, G., et al., Lensed galaxies in Abell 370. I. Modelling the number counts and redshift distribution of background sources, 1999, A&A, 347, 21-29
- Birkinshaw (1999) Birkinshaw, M., The Sunyaev-Zel’dovich effect, 1999, Phys. Rev., 310, 97-195
- Cooray (1998) Cooray, A. R., Cosmology with galaxy clusters. II. Projection effects on Hubble constant and gas mass fraction, 1998, A&A, 339, 623-628
- De Filippis et al. (2004) De Filippis, E., Bautz, M. W., Sereno, M., et al., AC 114: A Cluster with a Soft X-Ray Tail, 2004, ApJ, 611, 164-174
- De Filippis et al. (2005) De Filippis, E., Sereno, M., Bautz, M. W., et al., Exploring the Three-dimensional Structure of Galaxy clusters. I. Application to a Sample of 25 Clusters, 2005, ApJ, accepted
- Ettori & Lombardi (2003) Ettori, S., & Lombardi, M., X-ray and weak lensing measurements of the mass profile of MS1008.1-1224: Chandra and VLT data, 2003, A&A, 398, L5-L9
- Kneib et al. (1993) Kneib, J. P., Mellier, Y., Fort, B., et al., The Distribution of Dark Matter in Distant Cluster Lenses - Modelling A:370, 1993, A&A, 273, 367-376
- Mason et al. (2001) Mason, B. S., Myers, S. T., & Readhead, A. C. S., A Measurement of H0 from the Sunyaev-Zeldovich Effect, 2001, ApJL, 555, L11-L15
- Reese et al. (2002) Reese, E. D., Carlstrom, J. E., Joy, M., et al., Determining the Cosmic Distance Scale from Interferometric Measurements of the Sunyaev-Zeldovich Effect, 2002, ApJ, 581, 53-85
- Stark (1977) Stark, A. A., Triaxial Models of the Bulge of M31, 1977, ApJ, 213, 368-373
- Sunyaev & Zeldovich (1970) Sunyaev, R. A. & Zeldovich, Y. B., The Spectrum of Primordial Radiation, its Distortions and their Significance, 1970, Comments on Astrophysics and Space Physics, 2, 66-73
- Tegmark et al. (2004) Tegmark, M., Strauss, M. A., Blanton, M. R., et al., Cosmological parameters from SDSS and WMAP, 2004, Phys. Rev. D, 69, 103501(1)-103501(26)