New Cosmology with Clusters of Galaxies
Peter Schuecker
Max-Planck-Institut für extraterrestrische Physik
Giessenbachstraße, Postfach 1312, D-85741 Garching
peters@mpe.mpg.de
Abstract
The review summarizes present and future applications of galaxy clusters to cosmology with emphasis on nearby X-ray clusters. The discussion includes the density of dark matter, the normalization of the matter power spectrum, neutrino masses, and especially the equation of state of the dark energy, the interaction between dark energy and ordinary matter, gravitational holography, and the effects of extra-dimensions.
1 Basic cosmological framework
The general framework for present cosmological work is set by three observational results. The perfect Planckian shape of the cosmic microwave background (CMB) spectrum as observed with the COBE satellite (Mather et al. 1990) clearly shows that the Universe must have evolved – from a hot, dense, and opaque phase. The very good correspondence of the observed abundance of light elements and the results of Big Bang Nucleosynthesis (BBN, e.g. Burles, Nollett & Turner 2001) shows that the cosmic expansion can be traced back to cosmological redshifts up to . Steigman (2002) pointed out that if these analyses would have been performed with Newton gravity and not with Einstein gravity, then the observed abundances could not be reconciled with the BBN predictions. One can take this as one of the few indications than Einstein gravity can in fact be applied within a cosmological context and underlines the importance of the BBN benchmark for any gravitational theory. Finally, the consistency of the ages of the oldest stars in globular clusters (e.g. Chaboyer & Krauss 2002) and the age of the Universe as obtained from cosmological observations can be regarded as the long-waited ‘unification’ of the theory of stellar structure and the theory of cosmic spacetime (Peebles & Ratra 2004). Traditionally, Friedmann-Lemaître (FL) world models as derived from Einstein’s field equations for spatially homogeneous and isotropic systems, are assumed, characterized by the Hubble constant in units of , the normalized density of cosmic matter (e.g., baryonic and Cold Dark Matter CDM), the normalized cosmological constant , and its equation of state . Within this general framework, clusters of galaxies are traditionally used as cosmological probes on Gigaparsec scales. However, a precise test that one can apply Einstein gravity on such large scales is still missing.
In Sect. 2, a summary of the basic properties of nearby galaxy clusters is given. The hierarchical structure formation paradigm is tested with nearby galaxy clusters in Sect. 3. Constraints on the density of dark matter (DM), the normalization of the matter power spectrum, and neutrino masses are presented in Sect. 4. Observational effects of the equation of state of the dark energy (DE), and a first test of a non-gravitational interaction between DE and DM are presented in Sect. 5. The problem of the cosmological constant and its discussion in terms of the gravitional Holographic Principle as well as the effect of an extra-dimension of brane-world gravity are discussed in Sect. 6. Sect. 7 draws some conclusions. A general review on clusters is given in Bahcall (1999), whereas Edge (2004) focuses on nearby X-ray cluster surveys, Borgani & Guzzo (2001) on their spatial distribution, Rosati, Borgani & Norman (2002) and Voit (2004) on their evolution.
2 Galaxy clusters
Galaxy clusters are the largest virialized structures in the Universe. Only 5% of the bright galaxies () are found in rich clusters, but more than 50% in groups and poor clusters. The number of cluster galaxies brighter than where is the magnitude of the third-brightest cluster galaxy, and located within radius from the cluster center, range for rich clusters from 30 to 300 galaxies, and for groups and poor clusters from 3 to 30. For cosmological tests, rich clusters will turn out to be of more importance so that the following considerations will mainly focus on the properties of this type. Rich clusters have typical radii of where the surface galaxy density drops to % of the central density.
Baryonic gas, falling into the cluster potential well, is shock-heated up to temperatures of . The acceleration of the electrons in the hot plasma (intracluster medium ICM) gives thermal Bremsstrahlung with a maximum emissivity at so that they can be observed in X-rays together with some line emission. Typical X-ray luminosities range between in the energy interval keV. With X-ray satellites like ROSAT, Chandra, or XMM-Newton, these clusters can thus be detected up to cosmological interesting redshifts. However, only a few clusters are detected at redshifts beyond (Rosati et al. 2002).
Galaxy clusters are rare objects with number densities of , strongly decreasing with X-ray luminosity or cluster mass (Böhringer et al. 2002). Current structure formation models predict of the order of rich galaxy clusters in the visible Universe, the majority with redshifts below . More than 5 000 nearby galaxy clusters are already identified in the optical as local concentrations of galaxies, and 2 000 by their (extended) X-ray emission. Surveys planned for the next few years like the Dark Universe Observatory DUO (Griffiths, Petri, Hasinger et al. 2004) will yield about clusters possibly up to , that is, already 1% of the total cluster population. It appears thus not completely illusory to finally get an almost complete census of all rich galaxy clusters in the visible Universe.
X-ray clusters get their importance for cosmology because of the tide correlations between observables like X-ray temperature or X-ray luminosity and total gravitating cluster mass which allow a precise reconstruction of the cosmic mass distribution on large scales.
Knowledge of the total gravitating mass of a cluster within a well-defined radius, is of crucial importance. The masses are summarized in cluster mass functions which depend on structure formation models through certain values of the cosmological parameters. However, cosmic mass function appear to be independent of cosmology when they are written in terms of natural “mass” and “time” variables (Lacey & Cole 1994). Model mass functions can either be predicted from semi-analytic models (e.g, Sheth & Tormen 2002, Schuecker et al. 2001a, Amossov & Schuecker 2004) or from N-body simulations, the latter with errors between 10 to 30% (Jenkins et al. 2001).
Cluster masses can be determined in the optical by the velocity dispersion of cluster galaxies or in X-rays from, e.g., the gas temperature and density profiles, assuming virial and hydrostatic equilibrium, respectively (and spherical symmetry). Gravitational lensing uses the distortion of background galaxies and determines the projected cluster mass without any specific assumption (e.g., Kaiser & Squires 1993). For regular clusters, the masses of galaxy clusters are consistently determined with the three methods and range between (e.g., Wu et al. 1998). Several projects are currently under way to compare the mass estimates obtained with the different methods in more detail. The baryonic mass in clusters comes from the ICM and the stars in the cluster galaxies. The ratio between the baryonic and total gravitating mass (baryon fraction) in a cluster is about .
Systematic X-ray studies of large samples of galaxy clusters have revealed that about half of the clusters have significant substructure in their surface brightness distributions, i. e., some deviations from a perfect regular shape (e.g. Schuecker et al. 2001b). For the detection of substructure, different methods as summarized in Feretti, Giovannini & Gioa (2002) give substructure occurence rates ranging from 20 to 80%. The large range clearly shows that the definition of a well-defined mass threshold for substructure and the measurement of the masses of the different subclumps is difficult and has not yet been regorously applied. Further interesting ambiguities arise because clusters appear more regular in X-ray pseudo pressure maps (product of projected gas mass density and gas temperature) whereas contact discontinuities and shock fronts caused by merging events appear more pronounced in pseudo entropy and temperature maps (Briel, Finoguenov & Henry 2004).
Substructering is taken as a signature of the dynamical youth of a galaxy cluster. The most dramatic distortions occure when two big equal mass clumps collide (major merger) to form a larger cluster. With the ROSAT satellite, merging events could be studied for the first time in X-rays in more detail (e.g. Briel, Henry & Böhringer 1992). A typical time scale of a merger event is yr where the increased gas density and X-ray temperature can boost X-ray luminosities up to factors of five (Randall, Sarazin & Ricker 2002). The XMM-Newton and especially the Chandra X-ray satellite allows more detailed studies of substructures down to arcsec scales. Substructures in form of cavities and bubbles (Böhringer et al. 1993, Fabian et al. 2000), cold fronts (Vikhlinin, Markevitch & Murray 2001), weak shocks and sound waves (Fabian et al. 2003), strong shocks (Forman et al. 2003), and turbulence (Schuecker et al. 2004) were discovered, possibly triggered by merging events and/or AGN activity. With the ASTRO-E2 satellite planned to be launched in 2005, the line-of-sight kinematics of the ICM will be studied for the first time to get more information about the dynamical state of the ICM. The majority of the abovementioned substructures have low amplitudes which do not much disturb radially-averaged cluster profiles (after masking) and thus cluster mass estimates. In fact, the hydrostatic equation relates the observed smooth pressure gradients to the total gravitating cluster mass, which makes the robustness of X-ray cluster mass estimates from numerical simulations plausible (Evrard, Metzler & Navarro 1996, but see Sect. 7). Present cosmological tests based on galaxy clusters assume that the diversity of regular and substructured clusters contribute only to the intrinsic scatter of the observed X-ray luminosity-mass relation or similar diagnostics, while keeping the shape and normalization of the original relation almost unaltered.


The remaining about 50% of the clusters appear quite regular - a significant fraction of these clusters have very bright X-ray cores, where the dense gas could significantly cool. Such cooling core clusters are expected to be in a very relaxed dynamical state since several Gigayears. Numerical simulations suggest that the baryon fraction in these clusters is close to the universal value and can be used after some corrections as a cosmic ‘standard candle’ (e.g. White et al. 1993).
For nearby () rich systems, evolutionary effects on core radius and entropy input are found to be negligible (Rosati et al. 2002). Detailed XMM studies at can be found in Zhang et al. (2004). Therefore, cosmological tests based on massive nearby clusters with gas temperatures keV are expected to give reliable results. For these systems, the observed X-ray luminosity can be transformed into the theory-related cluster mass with empirical luminosity-mass or similar relations characterized by their shape, intrinsic scatter, and normalization (e.g., Reiprich & Böhringer 2002). It will be shown that with such methods, cosmological tests can be performed presently on the 20-30% accuracy level.
Further improvements on cluster scaling relations are thus necessary to reach (if possible) the few-percent level of ‘precision cosmology’. Large and systematic observational programms based on Chandra and XMM-Newton observations are now under way which are expected to significantly improve the relations within the next few years (e.g., XMM Large Programme, H. Böhringer et al., in prep., and a large Chandra project of T.H. Reiprich et al., in prep.). For cosmological tests with distant rich clusters, additional work is necessary. Gravitationally-induced evolutionary effects due to structure growth, and non-gravitationally-induced evolutionary effects like ICM heating through galactic winds caused by supernovae (SNe), and heating by AGN cause systematic deviations from simple self-similarity expectations (Kaiser 1986, Ponman, Cannon & Navarro 1999). For cosmological tests, such evolutionary effects add further degrees of freedom to be determined simultaneously with the cosmological parameters (e.g., Borgani et al. 1999).
3 Hierarchical structure formation paradigm
Structure formation on the largest scales as probed by galaxy clusters is mainly driven by gravity and should thus be understandable in a simple manner. However, reconciling the tiny CMB anisotropies at with the very large inhomogeneities of the local galaxy distribution has shown that the majority of cosmic matter must come in nonbaryonic form (e.g., CDM). A direct consequence of such scenarios is that clusters should grow from Gaussian initial conditions in a quasi hierarchical manner, i.e., less rich clusters and groups tend to form first and later merge to build more massive clusters. The merging of galaxy clusters as seen in X-rays (Sect. 2) is a direct indication that such processes are still at work in the local universe.
A further argument for hierarchical structure growth comes from the spatial distribution of galaxy clusters on scales. Less then 1/10 of this distance can be covered by cluster peculiar velocities within a Hubble time, keeping in this linear regime the Gaussianity of the cosmic matter field as generated by the chaotic processes in the early Universe almost intact. This Gaussianity formally stems from the random-phase superposition of plane waves and the central limit theorem (superposition approximation). The peaks of this random field will eventually collapse to form virialized clusters. The relation between the spatial fluctuations of the clusters and the underlying matter field is called ‘biasing’. For Gaussian random fields, the biasing tend to concentrate the clusters in regions with the highest global matter density in a manner that their correlation strengths increase with cluster mass (Kaiser 1984) - otherwise they would immediately distroy Gaussianity (e.g. if we would put a very massive cluster into a void of galaxies). Peculiar velocities of the clusters induced by the resulting inhomogeneities modify the -mass relation, but without disturbing the general trend (peak-background split of Efstathiou, Frank & White 1988, & Mo & White 1996). In the linear regime, we thus expect a Gaussian distribution of the amplitudes of cluster number fluctuations which increase with mass in a manner as predicted by the specific hierarchical scenario.

The REFLEX catalogue (Böhringer et al. 2004)111 http://www.xray.mpe.mpg.de/theorie/REFLEX/ provides the largest homogeneously selected sample of X-ray clusters and is ideally suited for testing specific hierarchical structure formation models. The sample comprises 447 southern clusters with redshifts (median at ) down to X-ray fluxes of in the energy range keV, selected from the ROSAT All-Sky Survey (Böhringer et al. 2001). Several tests show that the sample cannot be seriously affected by unknown selection effects. An illustration is given by the normalized, radially-averaged comoving number densities along the redshift direction (Fig. 1 left). The densities fluctuate around a -independent mean as expected when no unknown selection or evolutionary effects are present. For further tests can be found in Böhringer et al. (2001, 2004), Collins et al. (2000), and Schuecker et al. (2001c).
Tests of the Gaussianity of the cosmic matter field refer to the superposition approximation mentioned above. They devide the survey volume into a set of large non-overlapping cells, count the clusters in each cell, decompose the fluctuation field of the cluster counts into plane waves via Fourier transformation, and check whether the frequency distribution of the amplitudes of the plane waves (Fourier modes with wavenumber ) follow a Gaussian distribution. However, the survey volume provides only a truncated view of the cosmic matter field which will result in an erroneous Fourier transform (the result obtained will be the convolution of the true Fourier transform with the survey window function). The truncation effect comprises both the reduction of fine details in the Fourier transform and the correlation of Fourier modes so that fluctuation power migrates between the modes. This leakage effect increases when the symmetry of the survey volume deviates from a perfect cubic shape. Uncorrelated amplitudes can be obtained, when the fluctuations are decomposed into modes which follow to some extent the shape of the survey volume. The Karhunen-Loèwe (KL) decomposition determines such eigenmodes under the constraint that the resulting KL fluctuation amplitudes are statistically uncorrelated. This construction is quite optimal for testing cosmic Gaussianity. The KL eigenmodes are the eigenvectors of the sample correlation matrix, i.e., the matrix giving the expected correlations between the number of clusters obtained in pairs of count cells as obtained with a fiducial (e.g. concordance) cosmological model. KL modes were first applied to CMB data by Bond (1995), to galaxy data by Vogeley & Szalay (1996), and to cluster data by Schuecker et al. (2002). The linearity of the KL transform and the direct biasing scheme expected for galaxy clusters suggest that the statistics of the KL coefficients should directly reflect the statistics of the underlying cosmic matter field.
Figure 1 (right) compares a standard Gaussian with the frequency distribution of the observed KL-transformed and normalized cluster counts obtained with REFLEX. The cell sizes are larger than and thus probe Gaussianity in the linear regime. The observed Gaussianity of the REFLEX data suggests Gaussianity of the underlying cosmic matter field on such large scales. This is a remarkable finding, taking into account the difficulties one has to test Gaussianity even with current CMB data (Komatsu et al. 2003, Cruz et al. 2004).
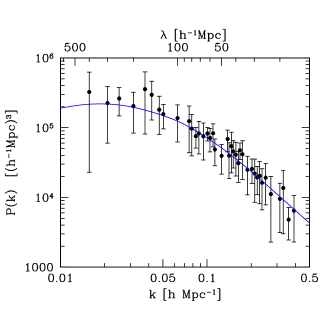
As mentioned above, hierarchical structure formation predicts that the amplitudes of the fluctuations should increase in a certain manner with mass. On scales small compared to the maximum extent of the survey volume, the fluctuation field roughly follows the superposition approximation. In this scale range, it is very convinient to test the mass-dependent amplitude effect with a simple plane wave decomposition as summarized by the power spectrum 222The KL method would need many modes to test small scales which is presently too computer-intensiv. Fig. 2 (left) shows that the observed REFLEX power spectrum of the complete sample is well fit by a low-density CDM model. Comparisons with other hierarchical scenarios are found to be less convincing (Schuecker et al. 2001c). In contrast to the ‘standard CDM’ model with , in low-density (open) CDM models, the epoch of equality of matter and radiation occure rather late and the growth of structure proceeds over a somewhat smaller range of redshift, until . Consequently, the turnover in is at larger scales, leaving less power on small scales. The nonzero cosmological constant of a (flat) CDM scenario stretches out the time scales of the model until . The differences in the dynamics of structure growth are thus not very large compared to an open CDM model and become only important at late stages. Note, however, that when all models are normalized to the local Universe, the opposite conclusion is true. The behaviour of the cluster fluctuation amplitude with mass (X-ray luminosity) for a low-density CDM model is shown in Fig. 2 (right). The predictions are shown as continuous and dashed lines which nicely follow the observed trends. The model includes an empirical relation to convert cluster mass to X-ray luminosity (Reiprich & Böhringer 2002), a model for quasi-nonlinear and linear structure growth (Peebles 1980), a biasing model (Mo & White 1996, Matarrese et al. 1997), and a model for the transformation of the power spectrum from real space to redshift space (Kaiser 1987).
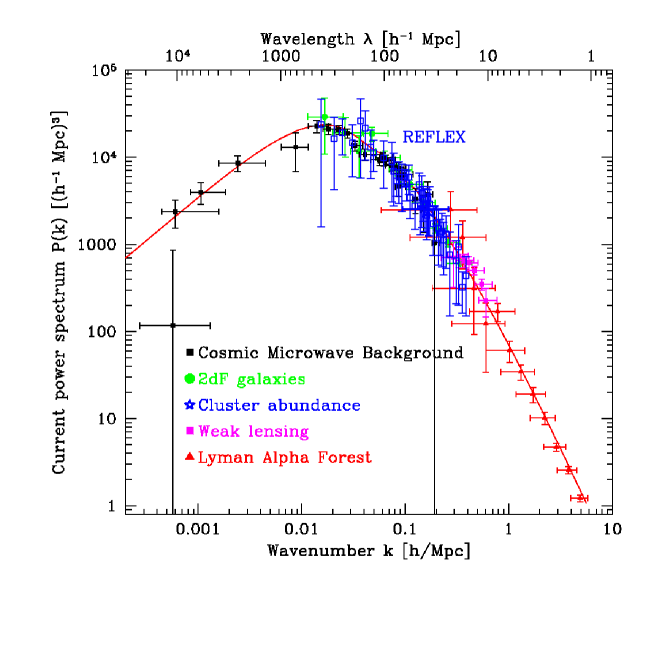
However, one could still argue that clusters constitute only a small population of all cosmological objects visible over a limited redshift interval, and could therefore not give a representative view of the goodness of hierarchical structure formation models. Fig. 3 summarizes power spectra obtained with various cosmological tracer objects as compiled by Tegmark & Zaldarriaga (2002) including the REFLEX power spectrum. All spectra are normalized by their respective biasing parameters (if necessary). The combined power spectrum covers a spatial scale range of more than four orders of magnitude and redshifts between (CMB) and . The good fit of the CDM model shows that this hierarchical structure formation model is really very successful in describing the clustering properties of cosmological objects. The following cosmological tests thus assume the validity of this structure formation model.
4 Ordinary matter
The observed cosmic density fluctuations are very well summarized by a low matter density CDM model (Sect. 3). Therefore, many cosmological tests refer to this structure formation scenario. In general, baryonic matter, Cold Dark Matter (CDM), primeval thermal remnants (electromagnetic radiation, neutrinos), and an energy corresponding to the cosmological constant give the total (normalized) density of the present Universe, . The normalized density of ordinary matter comprises the first three components. Recent CMB data suggest (Spergel et al. 2003), i.e., an effectively flat universe with a negligible spatial curvature. The same data suggest a baryon density of and . For our purposes, the energy density of thermal remnants, (Fukugita & Peebles 2004), can be neglected, yielding the present cosmic matter density . At the end of this section, an estimate of including only the neutrinos is given.
Within this context of the hierarchical structure formation, the occurence rate of substructure seems to be a useful diagnostic to test different cosmological parameters because a high merger rate implies a high (e.g., Richstone, Loeb & Turner 1992, Lacey & Cole 1993). However, as mentioned in Sect. 2, the effects of substructure are difficult to measure and to quantify in terms of mass so that presently less stringent constraints are attainable (for a recent discussion see, e.g., Suwa et al. 2003).
A simple though -dependent estimate of can be obtained from the comoving wavenumber of the turnover of the power spectrum because it corresponds to the horizon length at the epoch of matter-radiation equality (e.g. Peebles 1993) below which most structure is smoothed-out by free-streaming CDM particles. A small or a small Hubble constant thus shifts the maximum of towards larger scales. The product is referred to as the shape parameter of the power spectrum. For the REFLEX power spectrum, the turnover is at (Fig. 2), so that for a matter density of is obtained. In this case, the shape parameter is which is typical for CDM.
Cluster abundance measurements are a classical application of galaxy clusters in cosmology to determine the present density of cosmic matter, , either assuming a negligible effect of or not. The effective importance of on geometry and structure growth cannot be neglected for clusters with . A related quantity is the variance of the matter fluctuations in spherical cells with radius and Fourier transform : . The specific value at characterizes the normalization of the matter power spectrum . Recent CMB data suggest (Spergel et al. 2003).
In the following, the abundance of galaxy clusters is used to determine simultaneously the values of and . Early applications of the method can be found in, e.g., White, Efstathiou & Frenk (1993), Eke, Cole & Frenk (1996), and Viana & Liddle (1996) suggesting a stronge degeneracy between and of the form . To understand this degeneracy and the high sensitivity of cluster counts on the values of the cosmological parameters, consider the expected number of clusters observed at a certain redshift and flux limit,
| (1) |
For optically selected samples, the flux limit has to be replaced by a richness (or optical luminosity) limit. The cosmology-dependency of stems from the comoving volume element , the mass limit at a certain redshift, and the shape of the cosmic mass function . Three basic cosmological tests are thus applied simultaneously, which explains the high sensitivity of cluster counts on cosmology, although sometimes effects related to structure growth and geometric volume can work against each other (Sect. 5).
The summation in (1) is over cluster mass whereas observations yield quantities like X-ray luminosity, gas temperature, richness etc. The conversion of such observables into mass is the most crucial step where most of the systematic errors can occure. For more massive systems, likely contributors to systematic errors are effects related to cluster merging, substructures, and cooling cores. Cluster merging increases the gas density and temperature and thus the X-ray luminosity which increases the detection probablity in X-rays. The overall statistical effect is difficult to quantify, but systematic errors in the cosmological parameters on the 20% level can be reached (Randall et al. 2002). For less massive systems, further effects related to additional heat input by AGN, star formation, galactic winds driven by SNe, etc. lead to deviations from self-similar expectations (Sect. 2), and increase the scatter in scaling relations. Such effects are quite difficult to simulate (e.g., Borgani et al. 2004, Ettori et al. 2004).
Equation (1) can directly be applied to flux-selected cluster samples as obtained in X-rays or millimeter wavelengths. The latter surveys detect clusters via the Sunyaev-Zel’dovich (SZ) effects (e.g., Birkinshaw, Gull & Hardebeck 1984, Carlstrom, Holder & Reese 2002). Here, energy of the ICM electrons is locally transferred through inverse Compton (Thomson) scattering to the CMB photons so that the number of photons on the long wavelength side of the Planck spectrum is depleted. After this blue-shift, each cluster is detected at wavelengths beyond 1.4 mm as decrements against the average CMB background, and at shorther wavelengths as increments. This process thus measures deviations relative to the actual CMB background and is thus redshift-independent so that cluster detection does not has to work against the Tolman’s surface brightness dimming which is especially important for very distant clusters. Certain blind SZ surveys are now in preparation (SZ-Array starting 2004; AMI 2004, APEX-SZ 2005, ACT 2007, SPT 2007 and Planck 2007). The flux limits in X-rays and submm allow after some standard corrections a very accurate determination of the volume accessable by a cluster with certain X-ray or submm properties.
The detection of clusters in the optical is more complicated (e.g., red-sequence method in Gladders, Yee & Howard 2004, matched filter method in Postman et al. 1996, Schuecker & Böhringer 1998, Schuecker, Böhringer & Voges 2004). For the application of Eq. (1) to optically selected cluster samples, the mass limit has to be obtained with numerical simulations in a more model-dependent manner (e.g., Goto et al. 2002, Kim et al. 2002).
For cosmological tests, the values of the parameters are changed until observed and predicted numbers of clusters agree. In order to avoid the evaluation of 3rd and 4th-order statistics in the error determination, the parameter matrices should be as diagonal as possible. This can be achieved, when the cluster cell counts are transformed into the orthonormal base generated by the KL eigenvectors of the sample correlation matrix (Sect. 3). With the REFLEX sample, the classical - test was performed with the KL base (Schuecker et al. 2002, 2003a). The observed Gaussianity of the matter field directly translates into a multi-variant Gaussian likelihood function, and includes in a natural manner a weighting of the squared differences between KL-transformed observed and modeled cluster counts with the variances of the transformed counts. Not only the mean counts in the cells but also their variances from cell to cell depend on the cosmological model. The KL method thus simultaneously tests both mean counts and their fluctuations which increases the sensitivity of the method even more. The method was extensively tested with clusters selected from the Hubble Volume Simulation. Note that for the application of the KL method to galaxies of the Sloan Digital Sky Survey (SDSS, Szalay et al. 2003, Pope et al. 2004) only the fluctuations could be used and were in fact enough to provide constraints on the 10-percent level.
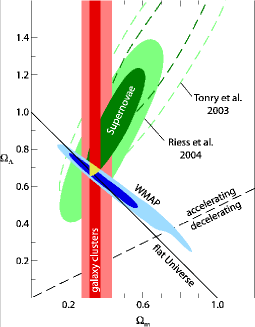
A typical result of a cosmological test of and with REFLEX clusters is shown in Fig. 4.


Note the small parameter range covered by the likelihood contours and the residual - degeneracy: For (flat) CDM and low , structure growth is negligible, and the - degeneracy is related to the fact that a small (corresponding to a low-amplitude power spectrum) yields a small comoving cluster number density, whereas a large (corresponding to a low mass limit ) yields a large comoving number density. For (flat) CDM and high , structure growth and comoving volume do again not strongly depend on , but the number of high- clusters increases with decreasing because for a fixed cluster number density at the normalization has to be increased when is decreased as shown above. However, the sensitivity on structure growth becomes apparent once open and flat models are compared (Bahcall & Fan 1998).
For the test, further cosmological parameters like the Hubble constant, the primordial slope of the power spectrum, the baryon density, the biasing model, and the empirical mass/X-ray luminosity relation had fixed prior values. The final REFLEX result is obtained by marginalizing over these parameters and yields the corridors and .
As mentioned above, the largest uncertainty in these estimates comes from the empirical mass/X-ray luminosity relation obtained for REFLEX from mainly ROSAT and ASCA pointed observations by Reiprich & Böhringer (2002) - compare Fig. 4 left and right. Tests are in preparation with a four-times larger X-ray cluster sample of 1 500 clusters combining a deeper version of REFLEX with an extended version of the cluster catalogue of Böhringer et al. (2000) of the northern hemisphere, plus a more precise M/L-relation obtained over a larger mass range with the XMM-Newton satellite. Errors below the 10-percent level are expected.
Variants of the cluster abundance method use the X-ray luminosity or the gas temperature function. For the transition from observables to mass, often the relations mass-temperature and luminosity-temperature are used. As an example, Borgani et al. (2001) obtained comparatively strong constraints using a sample of clusters up to yielding the corridors and .
White et al. (1993) pointed out that the matter content in rich nearby clusters provides a fair sample of the matter content of the Universe. The ratio of the baryonic to total mass in clusters should thus give a good estimate of . The combination with determinations of from BBN (constrained by the observed abundances of light elements at high ) can thus be used to determine (David, Jones, & Forman 1995, White & Fabian 1995, Evrard 1997). Extending the universality assumption on the gas mass fraction to distant clusters, Ettori & Fabian (1999) and later Allen et al. (2002) could show that at a certain distance from the center of quite relaxed distant clusters, the observed X-ray gas mass fraction tends to converge to a universal value. To illustrate the potential power of the method note that after further corrections, the results obtained by Allen et al. with only seven apparently relaxed clusters up to were already sensitive enough to constrain the cosmic matter density, . Later work includes more clusters up to and cluster abundances from the REFLEX-sample (Böhringer et al. 2004) and the BCS sample (Ebeling et al. 1998), and yields the error corridors and (Allen et al. 2003). However, the method shares some similarity with the type-Ia SNe method in the sense that the validity of the gas mass fraction as a cosmic standard candle especially at high is mainly based on observational arguments, partially supported by numerical simulations. The overlap of the error corridors of the less-degenerated results of Borgani et al. (2001), Schuecker et al. (2003a), and Allen et al. (2003) yields our final result
| (2) |
Other measurements show the - degeneracy more pronounced over a larger range. When all measurements are evaluated at , the values of appear quite consistent at a comparatively low normalization of
| (3) |
within the total range (data compiled in Henry 2004 from Bahcall et al. 2003, Henry 2004, Pierpaoli et al. 2003, Ikebe et al. 2002, Reiprich & Böhringer 2002, Rosati et al. 2002, including Allen et al. 2003 and Schuecker et al. 2003a with small degeneracies)333Vauclair et al. (2003) could find a consistent solution between local and high redshift X-ray temperature distribution functions and the redshift distributions of distant X-ray cluster surveys using mass-temperature and luminosity-temperature relations. Their best model has and , and the shape parameter, , which implies , in conflict with many observations..
Recent neutrino experiments are based on atmospheric, solar, reactor, and accelerator neutrinos. All experiments suggest that neutrinos change flavour as they travel from the source to the detector. These experiments give strong arguments for neutrino oscillations and thus nonzero neutrino rest masses (e.g. Ashie et al. 2004 and references given therein). Further information can be obtained from astronomical data on cosmological scales. The basic idea is to measure the normalization of the matter CDM spectrum with CMB anisotropies on several hundred Mpc scales. This normalization is transformed with structure growth functions to at assuming various neutrino contributions. This normalization should match the normalization from cluster counts (e.g., Fukugita, Liu & Sugiyama 2000). Recent estimates are obtained by combining CMB-WMAP data with the 2dFGRS galaxy power spectrum, X-ray cluster gas mass fractions, and X-ray cluster luminosity functions (Allen, Schmidt & Bridle 2003). For a flat universe and three degenerate neutrino species, they measured the contribution of neutrinos to the energy density of the Universe, and a species-summed neutrino mass, and their respective errors,
| (4) |
which formally corresponds to eV per neutrino. Their combined analysis yields a normalization of , which is consistent with the recent measurements with galaxy clusters mentioned above. From CMB, 2dFGRS and Ly- forest data, Spergel et al. (2003) obtained the constraint eV per neutrino. In a similar analysis including also SDSS galaxy clustering, Seljak et al. (2004) found eV for the lightest neutrino (at ). Estimates from neutrino oscillations suggest eV for at least one of two neutrino species, consistent with the Fukugita & Peebles (2004) estimate given above.
5 Dark energy
The present state of the cosmological tests is illustrated in Fig. 5 (left). The combination of the likelihood contours obtained with three different observational approaches (type-Ia SNe: Riess et al. 2004; CMB: Spergel et al. 2003; galaxy clusters: Schuecker et al. 2003b) shows that the cosmic matter density is close to , and that the normalized cosmological constant is around . This sums up to unit total cosmic energy density and suggests a spatially flat universe. However, the density of cosmic matter growths with redshift like whereas the density related to the cosmological constant is independent of . The ratio today is close to unity and must thus be a finely-tuned infinitesimal constant set in the very early Universe (cosmic coincidence problem).
An alternative hypothesis is to consider a time-evolving ‘dark energy’ (DE), where in Einstein’s field equations the time-independent energy density of the cosmological constant is replaced by a time-dependent DE density ,
| (5) |
while assuming that the ‘true’ cosmological constant is either zero or negligible. Here, is the Einstein tensor, the energy-momentum tensor of ordinary matter, and the metric tensor. For a time-evolving field (see, e.g., Ratra & Peebles 1988, Wetterich 1988, Caldwell et al. 1998, Zlatev, Wang & Steinhardt 1999, Caldwell 2002, recent review in Peebles & Ratra 2004) the aim is to understand the coincidence in terms of dynamics. A central rôle in these studies is assumed by the phenomenological ratio
| (6) |
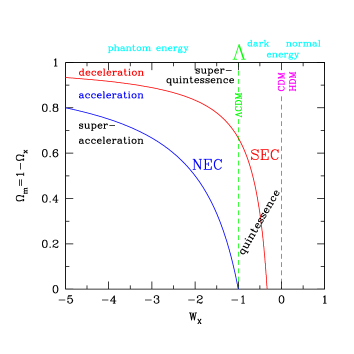
(equation of state) between the pressure of the unknown energy component and its rest energy density . Note that for Einstein’s cosmological constant. The resulting phase space diagram of DE (Fig. 5, right) distinguishes different physical states of the two-component cosmic fluid – separated by two energy conditions of general relativity (Schuecker et al. 2003b).
Generally, assumptions on energy conditions form the basis for the well-known singularity theorems (Hawking & Ellis 1973), censorship theorems (e.g. Friedman et al. 1993) and no-hair theorems (e.g. Mayo & Bekenstein 1996). Quantized fields violate all local point-wise energy conditions (Epstein et al. 1965). In the present investigation we are, however, concerned with observational studies on macroscopic scales relevant for cosmology where and are expected to behave classically. Cosmic matter in the form of baryons and non-baryons, or relativistic particles like photons and neutrinos satisfy all standard energy conditions. The two energy conditions discussed below are given in a simplified form (see Wald 1984 and Barceló & Visser 2001).
The Strong Energy Condition (SEC): and , derived from the more general condition , where is the Ricci tensor for the geometry and a timelike vector. The simplified condition is valid for diagonalizable energy-momentum tensors which describe all observed fields with non-zero rest mass and all zero rest mass fields except some special cases (see Hawking & Ellis 1973). The SEC ensures that gravity is always attractive. Certain singularity theorems (e.g., Hawking & Penrose 1970) relevant for proving the existence of an initial singularity in the Universe need an attracting gravitational force and thus assume SEC. Violations of this condition as discussed in Visser (1997) allow phenomena like inflationary processes expected to take place in the very early Universe or a moderate late-time accelerated cosmic expansion as suggested by the combination of recent astronomical observations (Fig. 5 left). Likewise, phenomena related to and an effective version of whose energy and spatial distribution evolve with time (quintessence: Ratra & Peebles 1988, Wetterich 1988, Caldwell et al. 1998 etc.) are allowed consequences of the breaking of SEC – but not a prediction. However, a failure of SEC seems to have no severe consequences because the theoretical description of the relevant physical processes can still be provided in a canonical manner. Phenomenologically, violation of SEC means for a single energy component with density . For , SEC is not violated and we have a decelerated cosmic expansion.
The Null Energy Condition (NEC): , derived from the more general condition , where is the geometry-dependent Einstein tensor and a null vector (energy-momentum tensors as for SEC). Violations of this condition are recently studied theoretically in the context of macroscopic traversable wormholes (see averaged NEC: Flanagan & Wald 1996, Barceló & Visser 2001) and the Holographic Principle (Sect. 6). The breaking of this criterion in a finite local region would have subtle consequences like the possibility for the creation of “time machines” (e.g. Morris, Thorne & Yurtsever 1988). Violating the energy condition in the cosmological case is not as dangerous (no threat to causality, no need to involve chronology protection, etc.), since one cannot isolate a chunk of the energy to power such exotic objects. Nevertheless, violation of NEC on cosmological scales could excite phenomena like super-acceleration of the cosmic scale factor (Caldwell 2002). Theoretically, violation of NEC would have profound consequences not only for cosmology because all point-wise energy conditions would be broken. It cannot be achieved with a canonical Lagrangian and Einstein gravity. Phenomenologically, violation of NEC means for a single energy component with . The sort of energy related to this state of a Friedmann-Robertson-Walker (FRW) spacetime is dubbed phantom energy and is described by super-quintessence models (Caldwell 2002, see also Chiba, Okabe & Yamaguchi 2000). For NEC is not violated, and is described by quintessence or super-quintessence models.

Assuming a spatially flat FRW geometry, , and as indicated by the astronomical observations in Fig. 5 (left), the formal conditions for this two-component cosmic fluid translates into for SEC, and for NEC (curved lines in Fig. 5 right). These energy conditions, characterizing the possible phases of a mixture of dark energy and cosmic matter, thus rely on the precise knowledge of and . Unfortunately, the effects of are not very large. However, a variety of complementary observational approaches and their combination helps to reduce the measurement errors significantly.
The most direct (geometric) effect of is to change cosmological distances. For example, for a spatially flat universe, comoving distances in dimensionless form, , are directly related to via
| (7) |
A less negative increases the Hubble parameter and thus reduces all cosmic distances. In general, must evolve in time. To discuss Eq. (7) in terms of the resulting parameter degeneracy, let us assume with the additional constraint that implies . For this simple parameterization the same expansion rate at is obtained when and are related by . The parameter degeneracy between and is a generic feature and can be seen in many proposed observational tests. Fortunately, its slope depends on , so that the degeneracy can be broken with independent observations covering a large redshift range. Current observations have not the sensitivity to measure and separately so that basically all published measurements of the equation of state of the DE are on assuming . The danger with this assumption is, however, that if the true would strongly deviate from zero then the estimated would be biased correspondingly (Maor et al. 2002). In addition, even when an explicit redshift dependency of could be neglected, some parameter degeneracy between and remains as suggested by Eq. (7) (see Fig. 6 obtained with the type-Ia SNe).
Structure growth via gravitational instability provides a further probe of . DE, not in form of a cosmological constant or vacuum energy density, is inhomogenously distributed - a smoothly distributed, time-varying component is unphysical because it would not react to local inhomogeneities of the other cosmic fluid and would thus violate the equivalence principle. An evolving scalar field with (e.g. quintessence) automatically satisfies these conditions (Caldwell, Dave & Steinhardt 1998a). The field is so light that it behaves relativistically on small scales and non-relativistically on large scales. The field may develop density perturbations on Gpc scales where sound speeds , but does not clump on scales smaller than galaxy clusters. Generally, perturbations come in either linear or nonlinear form depending on whether the density contrast, , is smaller or larger than one.
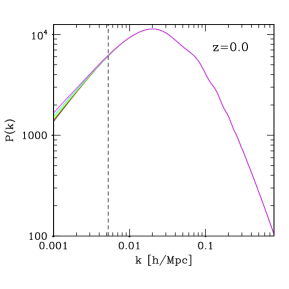
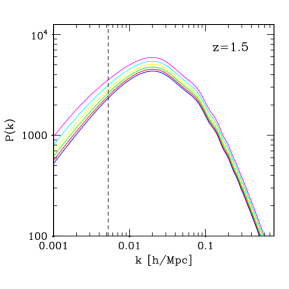
In the linear regime, and when DE is modeled as a dynamical scalar field, the rate of growth of linear density perturbations in the CDM is damped by the Hubble parameter, ( means scale factor and prime derivative with respect to conformal time). This evolution equation can be solved approximately by (Caldwell, Dave & Steinhardt 1998b), provided that at radiation-matter equality. It is seen that and thus a more positive delays structure growth. To reach the same fluctuations in the CDM field, structures must have formed at higher compared to the standard CDM model. For a redshift-independent , transfer and growth functions can be found in Ma et al. (1999). The effects of a constant on are shown in Fig. 7. The sensitivity of CMB anisotropies to is limited to the integrated Sachs-Wolfe effect because dominates only at late (Eq. 7). Spergel et al. (2003) showed that the WMAP data could equally well fit with , , and once is regarded as a free (constant) parameter.
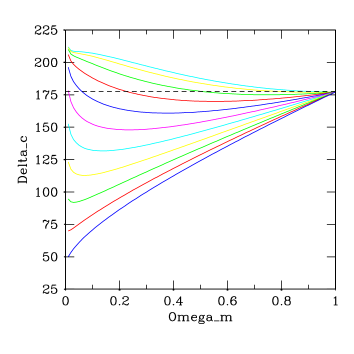
In the nonlinear regime, the effects of DE are not very large. For the cosmological constant, Lahav et al. (1991) used the theory of peak statistics in Gaussian random fields and linear gravitational-instability theory in the linear regime and the spherical infall model to evolve the profiles to the present epoch. They found that the local dynamics around a cluster at does not carry much information about . However, DM haloes have core densities correlating with their formation epoch. Therefore, when delays structure growth, then DM haloes are formed at higher with higher core densities and should thus appear for fixed mass and redshift more concentrated in models compared to . This is reflected in the virial densities of collapsed objects in units of the critical density shown in Fig. 8 (left). The first semi-analytic computations of a spherical collapse in a fluid with DE with were performed by Wang & Steinhardt (1998). Schuecker et al. (2003b) enlarged the range to , whereas Mota & van de Bruck (2004) discussed the spherical collapse for specific potentials of scalar fields. For recent simulations see Klypin et al. (2003) and Bartelmann et al. (2004).

These arguments have to be combined with the general discussion of Eq. (1) to understand the sensitivity of cluster counts on . Keeping the present-day cluster abundance and lower mass limit in Eq. (1) fixed, the dominant effect of comes from structure growth and volume (Haiman, Mohr & Holder 2001). For a larger , the DE field delays structure growth so that the number of distant clusters increases. However, a large yields a small comoving count volume for the clusters which counteracts the growth effect. The compensation works mainly at small and leads to a comparatively small sensitivity of cluster counts at on . For , the effect of a delayed structure growth starts to dominate and the number of high- clusters increases with . However, the realistic case is when a redshift and cosmology-dependent lower mass limit is included. In this case, it could be shown that at high , the -dependence of the redshift distribution is mainly caused by the -dependence of the lower mass limit in the sense that a larger decreases distances and therefore increases the number of high- clusters, whereas at small redshifts no strong dependency beyond the standard - degeneracy remains. The inclusion of a -dependent mass limit does only slightly damp the sensitivity on .
This high- behaviour of the number of clusters is very important for future planned cluster surveys (e.g. DUO Griffiths et al. 2004) where in the wide (northern) survey about 8 000 clusters will be detected over 10 000 square degrees on top of the SDSS cap up to , and where in the deep (southern) survey about 1 800 clusters will be detected over 176 square degrees up to (if they exists at such high redshifts). REFLEX has most clusters below . For a constant the likelihood contours are shown in Fig. 8 (right) as a function of (Schuecker et al. 2003b). The effects of yet unknown possible systematic errors are included by using a very large range of priors (). As expected, the dependence is very weak.
The past examples (Fig. 6 and Fig. 8 right) have shown that presently neither SNe nor galaxy clusters alone give an accurate estimate of the redshift-independent part of . This is also true for CMB anisotropies. However, the resulting likelihood contours of SNe and galaxy clusters appear almost orthogonal to each other in the high- range. Their combination thus gives a quite strong constraint on both and (Fig. 9 left). This is a typical example of cosmic complementarity which stems from the fact that SNe probe the homogeneous Universe whereas galaxy clusters test the inhomogeneous Universe as well. The final result of the combination of different SNe samples and REFLEX clusters yields the constraints and (Schuecker et al. 2003b). Averaging all results obtained with REFLEX and various SN-samples yields (Fig. 9 left). The figure shows that the measurements suggest a cosmic fluid that violates SEC and fulfills NEC. In fact, the measurements are quite consistent with the cosmological constant and leave not much room for any exotic types of DE. The violation of the SEC gives a further argument that we live in a Universe in a phase of accelerated cosmic expansion.
Ettori, Tozzi & Rosati (2003) used the baryonic gas mass fraction of clusters in the range and obtained . The combination with SN data yields , erroneously referring to the constraint . Henry (2004) used the X-ray temperature function and found , assuming . In a preliminary analysis, Sereno & Longo (2004) used angular diameter distance ratios of lensed galaxies in rich clusters, and shape parameters of surface brightness distributions and gas temperatures from X-ray data, and obtained , assuming . Rapetti, Allen & Weller (2004) combined cluster X-ray gas mass fractions with WMAP data and obtained the constraints . A formal average of the most accurate und unconstrained measurements using galaxy clusters (Schuecker et al. 2003b, Rapetti et al. 2004) gives
| (8) |
Lima, Cunha & Alcaniz (2003) give a summary of the results of the - tests obtained with various methods, all assuming a redshift-independent . A clear trend is seen that is ruled out by basically all observations. The large degeneracy seen in Fig. 6 (left) towards translates into a less well-defined lower bound. Hannestad & Mörtsell (2002) found by the combination of CMB, SNe and large-scale structure data.
Melchiorri et al. (2003) combined seven CMB experiments including WMAP with the Hubble parameter measurements from the Hubble Space Telescope and luminosity measurements of type-Ia SNe, and found the 95% confidence range . If they include also 2dF data on the large-scale distribution of galaxies they found . More recent measurements support the tendency that is close to the value expected for a cosmological constant as found by the combination of REFLEX and SN data. Spergel et al. (2003) used a variety of different combinations between WMAP and galaxy data and obtained the corridor . Riess et al. (2004) combined data from distant type-Ia SNe with CMB and large-scale structure data, and found . Their results are also inconsistent with a rapid evolution of the DE. Combining Ly- forest and bias analysis of the SDSS with previous constraints from SDSS galaxy clustering, the latest SN and WMAP data, Seljak et al. (2004) obtained at (they also obtained ). A combination of the measurements of REFLEX, Rapetti et al. (2004), Spergel et al. (2003), Riess et al. (2004), and Seljak et al. (2004) yields . Independent from this more or less subjective summary, it is still save to conclude that all recent measurements are consistent with a cosmological constant, and that the most precise estimates suggest that is very close to . This points towards a model where DE behaves very similar to a cosmological constant, i.e., that the time-dependency of the DE cannot be very large. In fact, Seljak et al. have also tested at , and found and thus no significant change with .

Cluster abundance measurements have not yet reached the depth to be very sensitive to the normalized cosmological constant or . The most reliable estimates todate come from the X-ray gas mass fraction. Vikhlinin et al. (2003) used the cluster baryon mass as a proxy for the total mass, thereby avoiding the large uncertainties on the M/T or M/L relations, yielding with 17 clusters with the degeneracy relation . For , this would give . Allen et al. (2002) obtained with the X-ray gas mass fraction in combination with the other measurements described above the constraint . Ettori et al. (2003) obtained , and Rapetti et al. (2004) . Combining lensing and X-ray data, Sereno & Longo (2004) obtained . The formal average and standard deviation of these measurements is
| (9) |
The last effect of DE and thus discussed here is interesting by its own, but also offers a possibility for cross-checks of measurements. The effect is related to a possible non-gravitational interaction between DE and ordinary matter (e.g. Amendola 2000). We showed above (e.g., Eq. 8) that the most obvious candidate for DE is presently the cosmological constant with all its catastrophic problems (Sect. 6). However, a very small redshift-dependency of the DE density cannot be ruled out. Based on this possible residual effect, a further explanation would be a light scalar (quintessential) field where its potential can drive the observed accelerated expansion similar as in the de-Sitter phase of inflationary scenarios. In general, interacts beyond gravity to baryons and DM with a strength similar to gravity. However, some (unkown) symmetry could signficantly reduce the interaction (Carroll 1998) – otherwise it would have already been detected – so that some coupling could remain. The following discussion is restricted to a possible interaction between DE and DM.
The general covariance of the energy momentum tensor requires the sum of DM () and DE () to be locally conserved so that we can allow for a coupling of the two fluids, e.g., in the simple linear form,
| (10) |
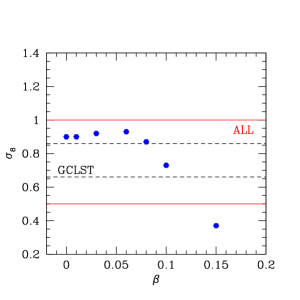
with the dimensionless coupling constant in , but more complicated choices are, however, possible. Observational constraints on the strength of a nonminimal coupling between and DM are (Damour et al. 1990). For a given potential , the corresponding equation of motion of can be solved. Amendola (2000) discussed exponential potentials which yield a present accelerating phase. A generic result is a saddle-point phase between and where the normalized energy density related to the scalar field, , is significantly higher compared to noncoupling models. The saddle-point phase thus leads to a further suppression of structure growth and thus to smaller (when the models are normalized with the CMB) compared to noninteracting quintessence models (Fig. 9 right). The present observations appear quite stringent. The X-ray cluster constraint (Eq. 3) obtained in Sect. 4 suggests a clear detection of a nonminimal coupling between DE and DM:
| (11) |
This would provide an argument that DE cannot be the cosmological constant because cannot couple non-gravitationally to any type of matter. In this case, the quite narrow experimental corridor found for (Eq. 8) would be responsible for the nonminimal coupling. However, a possibly underestimated by galaxy clusters, and thus no nonminimal couplings and a DE in form of a cosmological constant seem to provide a more plausible alternative (see Sect. 7).
6 The Cosmological Constant Problem
Recent measurements of the equation of state of the DE do not leave much room for any exotic type of DE (Eq. 8 in Sect. 5). In this section we take the most plausible assumption that the observed accelerated cosmic expansion is driven by Einstein’s cosmological constant more serious. In this case, we are, however, confronted with the long-standing cosmological constant problem (e.g., Weinberg 1989). To some extent also DE models based on scalar fields suffer on this problem because they have to find a physical mechanism (symmetry) which makes the value of negligible. To illustrate the problem, separate the effectively observed DE density as usual into a gravitational and non-gravitational part,
| (12) |
for . The non-gravitational part represents the physical vacuum. A free scalar field offers a convinient way to get an estimate of a plausible vacuum energy density. Interpreting this field as a physical operator and thus constraining it to Heisenberg’s uncertainty relations, quantize the field in the canonical manner. The quantized field behaves like an infinite number of free harmonic oscillators. The sum of their zero particle (vacuum) states, up to the Planck energy, corresponding to a cutoff in physical (not comoving) wavenumber, is
| (13) |
for . The cosmological constant problem is the extra-ordinary fine-tuning which is necessary to combine the effectively measured DE density in Eq. (12) with the physical vacuum (13). This simple (though quite naive) estimate immediately shows that something fundamentally has gone wrong with the estimation of the physical vacuum in Eq. (13). An obvious answer is related to the fact that for the estimation of the physical vacuum, gravitational effects are completely ignored. One could think of a quantum gravity with strings. However, present versions of such theories seem to provide only arguments for a vanishing or a negative cosmological constant (Witten 2000, but see below).
A hint how inclusion of gravity could effectively work in Eq. (13), comes from black hole thermodynamics (Bekenstein 1973, Hawking 1976). Analyzing quantized particle fields in curved but not quantized spacetimes, it became clear that the information necessary to fully describe the physics inside a certain region and characterized by its entropy, increases with the surface of the region. This is in clear conflict to standard non-gravitational theories where entropy as an extensive variable always increases with volume. Non-gravitational theories would thus vastly overcount the amount of entropy and thus the number of modes and degrees of freedom when quantum effects of gravity become important. Later studies within a string theory context could verify a microscopic origin of the black hole entropy bound (Strominger & Vafa 1996). Bousso (2002) generalizes the prescription how entropy has to be determined even on cosmological scales, leading to the Covariant Entropy Bound. ‘t Hooft (1993) and Susskind (1995) elevated the entropy bound as the Holographic Principle to a new fundamental hypothesis of physics.
A simple intuitive physical mechanism for this holographic reduction of degrees of freedom is related to the idea that each quantum mode in Eq. (13) should carry a certain amount of gravitating energy. If the modes were packed dense enough, they would immediately collapse to form a black hole. The reduction of the degrees of freedom comes from the ignorance of these collapsed states. Later studies of Cohen, Kaplan & Nelson (1999), Thomas (2002), and Horvat (2004) made the exclusion of states inside their Schwarzschild radii more explict which further strengthen the entropy bound so that a new estimate of the physical vacuum is
| (14) |
where is the present event horizon of the Universe. This is, however, not a solution of the cosmological constant problem because gravity and the exclusion of microscopic black hole states were put in by hand and not in a self-consistent manner by a theory of quantum gravity. Nevertheless, the similarity of Eqs. (12) and (14) might be taken as a hint that gravitational hologpraphy could be relevant to find a more complete theory of physics.
A method to test for consistency of present observations with gravitational holography, is closely related to the fact that gravitational holography as tested with the Covariant Entropy Bound on cosmological scales is based on the validity of the Null Energy Condition (NEC). However, in contrast to the NEC as discussed in Sec. 5 for the total cosmic fluid, Kaloper & Linde (1999) could show that for the Covariance Entropy Bound each individual component of the cosmic substratum must obey
| (15) |
The problematic component is the equation of state of the dark energy. The observed values summarized in Sect. 5 suggest which is consistent with the bound (15). One can take this as the first consistency test of probably the most important assumption of the Holographic Principle on macroscopic scales. However, a direct measurement of cosmological entropy on light sheets as defined in Bousso (2002) is still missing.
Li (2004) recently combined holographic ideas with DE to ‘solve’ the cosmological constant problem. Applying the stronger entropy bound as suggested by Thomas (1998) and Cohen et al. (1999), and using the cosmic event horizon as a characteristic scale of the Universe, accelerating solutions of the cosmic scale factor at low could be found together with relations between the density of cosmic matter and as shown in Fig. 9 (left). This model of holographic DE appears to be quite consistent with present observations and was in fact used in Eq. (14) to estimate the density of the physical vacuum.
t’Hooft (1993) and Susskind (1995) give arguments suggesting that M-theory should satisfy the Holographic Principle. Horava (1999) in his ‘conservative’ approach to M-theory, defined by specific gauge symmetries and invariance under spacetime diffeomorphisms and parity, could show that the entropy bound and thus holography emerges quite naturally. Therefore, any astronomical test supporting gravitational holography more directly or some of its basic assumptions like the NEC as described above should give important hints towards the development of a more complete theory of physics.
There is a class of models based on higher dimensions which follow the Holographic Principle. Brane-worlds emerging from the model of Horava & Witten (1996a,b) are phenomenological realizations of M-theory ideas. Recent theoretical investigations concentrate on the Randall & Sundrum (1996a,b) models where gravity is used in an elegant manner to compactify the extra dimension. Some of these models also follow the Holographic Principle. Here, matter and radiation of the visible Universe are located on a -dimensional brane. Expressed in a simplified manner, non-gravitational forces, described by open strings, are attached with their endpoints on branes. Gravity, described by closed strings, can propagate also into the -dimensional bulk and thus ‘dilutes’ differently than Newton or Einstein gravity. Table-top experiments of classical gravity (and BBN) confine the size of an extra dimension to mm (Hoyle et al. 2004). Einstein gravity formulated in a five dimensional spacetime and combined with a five-dimensional cosmic line element carrying the symmetries of the assumed brane-world, can yield FL-like solutions with the well-known phenomenology at low (Binetruy et al. 2000).
The analysis of perturbations in brane-world scenarios is not yet fully understood (Maartens 2004). Difficulties arise when perturbations created on the brane propagate into the bulk and react back onto the brane. Only on large scales are the computations under control because here the effects of the backreaction are small and can be neglected. It is thus not yet clear, whether the resulting effects on the power spectrum described below are mere reflections of such approximations or generic features of higher dimensions.
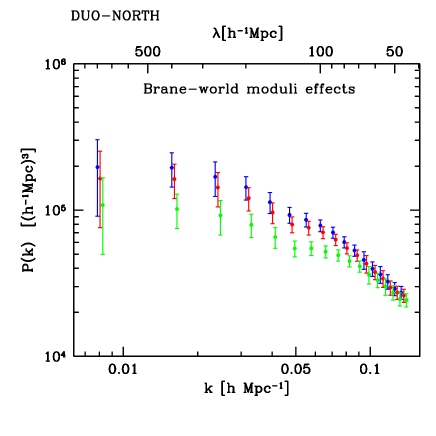
Brax et al. (2003) and Rhodes et al. (2003) discussed the effects of extra dimensions on CMB anisotropies and large scale structure formation. Models with extra dimensions can at low energies be described as scalar-tensor theories where the light scalar fields (moduli fields) couple to ordinary matter in a manner depending on the details of the higher dimensional theory. An illustration of the expected effects on the cluster power spectrum is given in Fig. 10. The error bars are computed with cluster samples selected from the Hubble Volume Simulation under the conditions of the DUO wide survey (P. Schuecker, in prep.). It is seen that gets flatter on scales around with increasing size of the extra dimension. A careful statistical analysis shows that more than 30 000 galaxy clusters are needed to clearly detect the presence of an extra dimension on scales below 0.16 mm.
7 Summary and conclusions
X-ray galaxy clusters give, in combination with other measurements, the observational constraints and their errors on the matter density , the normalized cosmological constant , the normalization of the matter power spectrum , the neutrino energy density , the equation of state of the DE , and the linear interaction between DE and DM. These estimates suggest a spatially flat universe with , as assumed in many cosmological tests based on galaxy clusters.
They do, however, not provide an overall consistent physical interpretation. The problem is related to the low which leads to an overestimate of the neutrino mass compared to laboratory experiments and to an interaction between DE and DM. Such a high interaction is not consistent with a DE with because the latter indicates that DE behaves quite similar to a cosmological constant which cannot exchange energy beyond gravity.
A more convincing explanation is that should be regarded as a lower limit so that DE would be the cosmological constant without any nonminimal couplings. Systematic underestimates of by 10-20% are not unexpected from recent simulations (e.g., Randall et al. 2002, Rasia et al. 2004). Present data do not allow any definite conclusion, especially in the light of the partially obscured effects of non-gravitational processes in galaxy clusters and because of our ignorance of a possible time-dependency of . However, the inclusion of further parameters obviously improves our abilities for consistency checks.
Energy conditions form the bases of many phenomena related to gravity
and holography. M-theory should also come holographic, as well as
brane-world gravity as a phenomenological realization of M-theory
ideas. Tests of the resulting cosmologies will in the end confront
alternative theories of quantum gravity. Observational tests on
cosmological scales as illustrated by the effects of an
extra-dimension on the cluster power spectrum probably need the
‘ultimate’ cluster survey, i.e. a census of possibly all rich
galaxy clusters which might exist down to redshifts of in the
visible Universe.
Acknowledgements: I would like to thank Hans Böhringer and the REFLEX team for our joint work on galaxy clusters and cosmology.
References
Allen, S.W., Schmidt, R.W., Fabian, A.C., 2002, MNRAS, 334, L11
Allen, S.W., Schmidt, R.W., Fabian, A.C., Ebeling, H., 2003, MNRAS, 344, 43
Allen, S.W., Schmidt, R.W., Bridle, S.L., 2003, MNRAS, 346, 593
Allen, S.W., Schmidt, R.W., Ebeling, H., Fabian, A.C., van Speybroeck, L., 2004, MNRAS, 353, 457
Amendola, L., 2000, PhRvD, 62, 043511
Amossov, G., Schuecker, P., 2004, A&A, 421, 425
Ashie, Y., et al., 2004, PhRvL, 93, 101801
Bahcall, N.A., 1999, in Formation of structure in the universe, eds. A. Dekel & J.P. Ostriker, Cambridge Univ. Press, Cambridge, p. 135
Bahcall, N.A., Fan, X., 1998, ApJ, 504, 1
Bahcall, N.A., et al. 2003, ApJ, 585, 182
Barceló, C., & Visser, M., 2001, PhLB, 466, 127
Bartelmann, M., Dolag, K., Perrotta, F., Baccigalupi, C., Moscardini, L., Meneghetti, M., Tormen, G., 2004, astro-ph/0404489
Bekenstein, J., 1973, PhRvD, 9, 3292
Binetruy, P., Deffayet, C., Ellwanger, U., Langois, D., 2000, PhLB, 477, 285
Birkingshaw, M., Gull, S.F., Hardebeck, H., 1984, Natur, 309, 34
Böhringer, H., Voges, W., Fabian, A.C., Edge, A.C., Neumann, D.M., 1993, MNRAS, 264, L25
Böhringer, H., et al., 2000, ApJS, 129, 35
Böhringer, H., et al. 2001, A&A, 369, 826
Böhringer, H., et al. 2002, ApJ, 566, 93
Böhringer, H., et al. 2004, A&A, 425, 367
Bond, J.R., 1995, PhRvL, 74, 4369
Borgani, S., Guzzo, L., 2001, Natur, 409, 39
Borgani, S., Rosati, P., Tozzi, P., Norman, C., 1999, ApJ, 517, 40
Borgani, S., et al. (2001), ApJ, 561, 13
Borgani, S., Murane, G., Springel, V., Diaferio, A., Dolag, K., Moscardini, L., Tormen, G., Tornatore, L., Tozzi, P., 2004, MNRAS, 348, 1078
Bousso, R., 2002, RvMP, 74, 825
Brax, Ph., van de Bruck, C., Davis, A.-C., Rhodes, C.S., 2003, PhRvD, 67, 023512
Briel, U.G., Henry, J.P., Böhringer, H., 1992, A&A, 259, L31
Briel, U.G., Finoguenov, A., Henry, J.P., 2004, A&A, 426, 1
Burles, S., Nollett, K.M., Turner, M.S., 2001, ApJL, 552, L1
Caldwell, R.R., 2002, PhLB, 545, 17
Caldwell, R.R., Dave, R., Steinhardt, P.J., 1998a, PhRvL, 80, 1582
Caldwell, R.R., Dave, R., Steinhardt, P.J., 1998b, Ap&SS, 261, 303
Carlstrom, J.E., Holder, G.P., Reese, E.D., 2002, ARAA, 40, 643
Carroll, S.M., 1998, PhRvL, 81, 3067
Chaboyer, B., Krauss, M., 2002, ApJL, 567, L45
Chiba, T., Okabe, T., Yamaguchi, M., 2000, PhRvD, 62, 023511
Cohen, A.G., Kaplan, D.B., Nelson, A.E., 1999, PhRvL, 82, 4971
Collins, C.A., et al. 2000, MNRAS, 319, 939
Cruz, M., Martinez-Gonzalez, E., Vielva, P., Cayon, L., 2004, MNRAS (in press)
Damour, T., Gibbons, G.W., Gundlach, C., 1990, PhRvL, 64, 123
David, L.P., Jones, C., Forman, W., 1995, ApJ, 445, 578
Ebeling, H., Edge, A.C., Böhringer, H., Allen, S.W., Crawford, C.S., Fabian, A.C., Voges, W., Huchra, J.P., 1998, MNRAS, MNRAS, 301, 881
Edge, A.C., 2004, in Clusters of Galaxies, eds. J.S. Mulchaey, A. Dressler, and A. Oemler, Cambridge Univ. Press, Cambridge, p. 58
Efstathiou, G., Frank, C.S., White, S.D.M., Davis, M., 1988, MNRAS, 235, 715
Eke, V.R., Cole, S., Frenk, C.S., 1996, MNRAS, 282, 263
Epstein, H., Glaser, V., Jaffe, A., 1965, NCim, 36, 2296
Ettori, S., Fabian, A.C., 1999, MNRAS, 305, 834
Ettori, S., Tozzi, P., Rosati, P., 2004, A&A, 398, 879
Ettori, S., et al. 2004, MNRAS, 354, 111
Evrard, A.E., 1997, MNRAS, 292, 289
Evrard, A.E., Metzler, C.A., Navarro, J.F., 1996, ApJ, 469, 494
Fabian, A.C., et al. 2000, MNRAS, 318, L65
Fabian, A.C., Sander, J.S., Allen, S.W., Crawford, C.S., Iwasawa, K., Johnstone, R.M., Schmidt, R.W., Taylor, G.B., 2003, MNRAS, 344, L43
Feretti, L., Gioia, I.M., Giovannini, G., I. Gioia 2002, Merging processes in galaxy clusters, Eds., Astrophysics and Space Science Library, Vol. 272, Kluwer Academic Publisher, Dordrecht
Flanagan, É.É., Wald, R.M., 1996, PhRvD, 54, 6233
Forman, W., et al., 2003, ApJ (submitted), astro-ph/0312576
Friedman, J.L., Schleich, K., Witt, D.M., 1993, PhRvL, 71, 1486
Fukuda, Y., et al., 1998, PhRvL, 81, 1562
Fukugita, M., Liu, G.-C., Sugiyama, N., 2000, PhRvL, 84, 1082
Fukugita, M., Peebles , J.P.E. 2004, astro-ph/0406095
Gladders, M.D., Yee, D., Howard, K.C., 2004, ApJS (in press), astro-ph/0411075
Goto, T., et al. 2002, AJ, 123, 1807
Griffiths, R.E., Petre, R., Hasinger, G., et al. 2004, in Proc. SPIE conference (submitted)
Haiman, Z., Mohr, J.J., Holder, G.P., 2001, ApJ, 553, 545
Hawking, S.W., Penrose, R., 1970, in Proc. of the Roycal Society of London. Series A. Mathematical and Physical Sciences. Vol. 314, Issue 1519, p. 529
Hawking, S.W., Ellis, G.F.R., 1973, The large scale structure of space-time, Cambridge Monographs on Mathematical Physics, Cambridge Univ. Press, London
Hawking, S.W., 1976, PhRvD, 13, 191
Henry, J.P. 2004, ApJ, 609, 603
Horava, P., 1999, PhRvD, 59, 046004
Horava, P., Witten, E., 1996a, NuPhB, 460, 506
Horava, P., Witten, E., 1996b, NuPhB, 475, 94
Horvat, R., 2004, PhRvD, 70, 087301
Hoyle, C.D., Kapner, D.J., Heckel, B.R., Adelberger, E.G., Gundlach, J.H., Schmidt, U., Swanson, H.E., 2004, PhRvD, 70, 042004
Ikebe, Y., Reiprich, T.H., Böhringer, H., Tanaka, Y., Kitayama, T., 2002, A&A, 383, 773
Jenkins, A., Frenk, C.S., White, S.D.M., et al. 2001, MNRAS, 321, 372
Kaiser, N., 1984, ApJL, 284, L9
Kaiser, N., 1986, MNRAS, 222, 323
Kaiser, N., 1987, MNRAS, 227, 1
Kaiser, N., Squires, G., 1993, ApJ, 404, 441
Kaloper, N., Linde, A., 1999, PhRvD, 60, 103509
Komatsu, E., et al., 2003, ApJS, 148, 119
Kim, R.S.J., et al., 2002, AJ, 123, 20
Klypin, A., Maccio, A.V., Mainini, R., Bonometto, S.A., 2003, ApJ, 599, 31
Lacey, C.G., Cole, S.M., 1993, MNRAS, 262, 627
Lacey, C.G., Cole, S.M., 1994, MNRAS, 271, 676
Lahav, O., Rees, M.J., Lilje, P.B., Primack, J.R., 1991, MNRAS, 251, 128
Li, M., 2004, Phys. Lett. B (submitted), astro-ph/0403127
Lima, J.A.S., Cunha, J.V., Alcaniz, J.S., 2003, PhRvD, 68, 023510
Ma, C.-P., Caldwell, R.R., Bode, P., Wang, L., 1999, ApJ, 521, L1
Maartens, R., 2004, LRR, 7, 7
Maor, I., Brustein, R., McMahon, J., Steinhardt, P.J., 2002, PhRvD, 65, 123003
Matarrese, S., Coles, P., Lucchin, F., Moscardini, L., 1997, MNRAS, 286, 115
Mather, J.C., et al. 1990, ApJ, 354, L37
Mayo, A.E., Bekenstein, J.D., 1996, PhRvD, 54, 5059
Melchiorri, A., Mersini, L., Ödman, C.J., Trodden, M., 2003, PhRvD, 68, 043509
Mo, H.J., White, S.D.M, 1996, MNRAS, 282, 347
Morris, M.S., Thorne, K.S., Yurtsever, U., 1988, PhRvL, 61, 1446
Mota, D.F., van de Bruck, C., 2004, A&A, 421, 71
Peebles, P.J.E., 1980, The Large-Scale Structure of the Universe, Princeton Univ. Press, Princeton
Peebles, P.J.E., 1993, Principles of Physical Cosmology, Univ. Press, Princeton, Princeton
Peebles, P.J.E., Ratra, B., 2004 RvMP, 75, 559
Pierpaoli, E., Borgani, S., Scott, D., White, M., 2003, MNRAS, 242, 163
Ponman, T.J., Cannon, D.B., Navarro, J.F., 1999, Natur, 397, 135
Pope, A.C., et al. 2004, ApJ, 607, 655
Postman, M., Lubin, L.M., Gunn, J.E., Oke, J.B., Hoessel, J.G., Schnieder, D.P., Christensen, J.A., 1996, AJ, 111, 615
Randall, L., Sundrum, R., 1996a, PhRvL, 83, 3370
Randall, L., Sundrum, R., 1996b, PhRvL, 83, 4690
Randall, S.W., Sarazin, C.L., Ricker, P.M., 2002, ApJ, 577, 579
Rapetti, D., Allen, S,W, Weller, J., 2004, MNRAS (submitted), astro-ph/0409574
Rasia, E., Mazzotta, P., Borgani, S., Moscardini, L., Dolag, K., Tormen, G., Diaferio, A., Murante, G., 2004, ApJL (submitted), astro-ph/0409650
Ratra, B., Peebles, P.J.E., 1988, PhRvD, 37, 3406
Reiprich, T.H.,, Böhringer, H., 2002, ApJ, 567, 716
Rhodes, C.S., van de Bruck, C., Brax, Ph., Davis, A.-C., 2003, PhRvD, 68, 3511
Richstone, D., Loeb, A., Turner, E., 1992, ApJ, 363, 477
Riess, A.G., Filippenko, A.V., Challis, P., et al., 1998, AJ, 116, 1009
Riess, A.G., et al. 2004, ApJ, 607, 665
Rosati, P., Borgani, S., Norman, C., 2002, ARAA, 40, 539
Szalay, A.S., et al. 2003, ApJ, 591, 1
Schuecker, P., Böhringer, H., 1998, A&A, 339, 315
Schuecker, P., Böhringer, H., Arzner, K., Reiprich, T.H., 2001a, A&A, 370, 715
Schuecker, P., Böhringer, H., Reiprich, T.H., Feretti, L., 2001b, A&A, 378, 408
Schuecker, P., et al. 2001c, A&A, 368, 86
Schuecker, P., Guzzo, L., Collins C.A., Böhringer, H., 2002, MNRAS, 335, 807
Schuecker, P., Böhringer, H., Collins, C.A., Guzzo, L., 2003a, A&A, 398, 867
Schuecker, P., Caldwell, R.R., Böhringer, H., Collins, C.A., Guzzo, L., Weinberg, N.N., 2003b, A&A, 402, 53
Schuecker, P., Böhringer, H., Voges, W., 2004, A&A, 420, 425
Schuecker, P., Finoguenov, A., Miniati, F., Böhringer, H., Briel, U.G., 2004, A&A, 426, 387
Seljak, U., et al., 2004, PhRvD (submitted) astro-ph 0407372
Sereno, M., Longo, G., 2004, MNRAS, 354, 1255
Sheth, R.K., Tormen, G., 2002, MNRAS, 329, 61
Spergel, D., et al. 2003, ApJS, 148, 175
Steigman, G., 2002 as cited in Peebles, P.J.E., Ratra, B., 2003, RvMP, 75, 559
Strominger, A., Vafa, C., 1996, PhL B, 379, 99
Susskind, L., 1995, JMP, 36, 6377
Suwa, T., Habe, A., Yoshikawa, K., Okamoto, T., 2003, ApJ, 588, 7
Tegmark, M., Zaldarriaga, M., 2002, PhRvD, 66, 103508
Thomas, S., 2002, PhRvL, 89, 081301
t‘Hooft, G., 1993, in Salamfestschrift: a collection of talks, World Scientific Series in 20th Century Physics, Vol. 4, eds. A. Ali, J. Ellis and S. Randjbar-Daemi, World Scientific, 1993, e-print gr-qc/9310026
Vauclair, S.C., et al., 2003, 412, 37
Viana, P.T.P., Liddle, A.R., 1996, MNRAS, 281, 323
Vikhlinin, A., Markevitch, M., Murray, S.S. 2001, ApJ, 551, 160
Vikhlinin, A., et al., 2003, ApJ, 590, 15
Visser, M., 1997, PhRvD, 56, 7578
Vogeley, M.S., Szalay, A.S., 1996, ApJ, 465, 34
Voit, G.M., 2004 RMP (in press), astro-ph/0410173
Wald, R.M., 1984, General Relativity, The University of Chicago Press, Chicago and London
Wang, L., Steinhardt, P.J., 1998, ApJ, 508, 483
Weinberg, S., 1989, RvMP, 61, 1
Wetterich, C., 1988, NuPhB, 302, 668
White, S.D.M., Frenk, C.S., 1991, ApJ, 379, 52
White, S.D.M., Efstathiou, G., Frank, C.S., 1993, MNRAS, 262, 1023
White, S.D.M., Navarro, J.F., Evrard, A.E., Frank, C.S., 1993, Natur, 366, 429
White, S.D.M., Fabian, A.C., 1995, MNRAS, 273, 72
Witten, E., 2000, hep-ph/0002297
Wu, X.-P., Chiueh, T., Fang, L.-Z., Xue, Y.-J., 1998, MNRAS, 301, 861
Zhang, Y.-Y., Finoguenov, A., Böhringer, H., Ikebe, Y., Matsushita, K., Schuecker, P., 2004, A&A, 413, 49
Zlatev, I., Wang, L., Steinhardt, P.J., 1999, PhRvL, 82, 896