Evidence for Primordial Clustering
Around the QSO SDSS J1030+0524 at z=6.28111Based, in part, on data obtained at the W.M. Keck Observatory, which is operated as a scientific partnership between the California Institute of Technology, the University of California, and NASA, and was made possible by the generous financial support of the W.M. Keck Foundation.
Abstract
We present tentative evidence for primordial clustering, manifested as an excess of color-selected objects in the field of the QSO SDSS J1030+0524 at redshift . We have selected objects red in on the basis of Hubble Space Telescope Advanced Camera for Surveys imaging of a field centered on the QSO. Compared to data at comparable depth obtained by the GOODS survey, we find an excess of objects with in the QSO field. The significance of the detection is estimated to be 97% on the basis of the counts alone and increases to 99.4% if one takes into account the color distribution. If confirmed this would represent the highest redshift example of galaxy clustering and would have implications on models for the growth of structure. Bias-driven clustering of first luminous objects forming in the highest peaks of the primordial density field is expected in most models of early structure formation. The redshift of one of the candidates has been found to be by our spectroscopy with Keck I/LRIS, confirming the validity of our color selection.
Subject headings:
cosmology: early universe; galaxies: formation; high-redshift1. Introduction
Exploration of the early structure formation and the reionization era is now one of the most active areas of cosmology; see, e.g., Madau (2000), Loeb & Barkana (2001), Barkana & Loeb (2001), Stiavelli (2002), or Djorgovski (2004) for recent reviews and references. The first hints of an approach to reionization, signaled by the dramatic increase in the intergalactic hydrogen absorption at , was detected in the spectra of high- QSOs (Becker et al. 2001, Djorgovski et al. 2001, White et al. 2003, etc.). In particular, there was the possible detection of an extended, optically thick absorption due to neutral hydrogen at Å (Gunn & Peterson 1965) in the spectrum of QSO SDSS J1030+0524 at (Fan et al. 2001). These results strongly suggest the end of the cosmic reionization at . However, WMAP’s tentative detection of a large amplitude signal in the temperature-polarization maps of the cosmic microwave background (Kogut et al. 2003) would place the (initial?) reionization at –20.
A simple picture of a clean-cut, universally synchronized Gunn-Peterson trough now appears unlikely. The key issue is the clumpiness of the IGM, and the gradual development and clumpy distribution of the first ionizing sources, either protogalaxies or early AGN (see, e.g., Miralda-Escude et al. 2000). Reionization is expected to occur gradually as the UV emissivity increases (cf. McDonald & Miralda-Escude 2001) with the lowest density regions becoming fully reionized first. This is also suggested by modern numerical simulations (e.g., Gnedin & Ostriker 1997; Ciardi et al. 2003; Gnedin 2004) which predict an extended period of reionization, starting at or even higher and ending at or so (see also Wyithe & Loeb 2003, Cen 2003, Haiman & Holder 2003, Somerville et al. 2003).
Large samples of normal galaxies are now studied out to (Steidel et al. 1999, Dawson et al. 2004). Surveys like, e.g., GOODS (Giavalisco et al. 2004, Dickinson et al. 2004) and HUDF (Beckwith et al. in preparation; see also Bunker et al. 2004, Yan & Windhorst 2004), have provided us with the first significant samples of galaxies at . However, if our understanding of galaxy formation through hierarchical clustering is correct, we expect the earliest objects to be rare and highly clustered rather than typical field galaxies. Indeed, some evidence of clustering at redshift around 6 has been found in the UDF (Malhotra et al. 2004, see also Ouchi et al. 2005). This leads us naturally to the study of QSO environments as they should be the most clustered environments at these very high redshifts.
Indeed, a generic expectation in most models of galaxy formation is that the most massive density peaks in the early universe are likely to be strongly clustered (Kaiser 1984; Efstathiou & Rees 1988). The evidence for such bias is already seen in large samples of Lyman-break galaxies at –3.5 (Steidel et al. 2003), and in Lyman selected galaxy samples (e.g., Venemans et al. 2003); it should be even stronger at higher redshifts. An “excess” in the number of galaxies and in the density of star formation was also discovered in a systematic Keck survey of fields centered on known quasars (e.g., Djorgovski 1999, Djorgovski et al. 1999, 2003, and in prep.). The high metallicity associated with QSOs—even at —is often interpreted as evidence that they are located at the center of massive (proto–)galaxies, thereby corroborating the overall picture. These arguments justify the expectation that QSOs at most likely highlight some of the first perturbations that become non–linear in the density distribution of matter.
This paper is devoted to the study of the environment of the QSO SDSS J1030+0524. Section 2 describes the data and our data reduction techniques. Section 3 describes the catalogs and the candidate list. Section 4 presents a spectrum obtained for one of our candidates. Section 5 presents and discusses our results.
2. Data reduction and analysis
We have observed a field near SDSS J1030+0524 using the Advanced Camera for Surveys (ACS) onboard the Hubble Space Telescope. The Wide Field Camera (WFC) was used to secure an integration of 5,840 s in F775W (hereafter ) and of 11,330 s in F850LP (hereafter ). The relative exposure times in these filters have been chosen so as to have a depth in these two filters comparable to that of the GOODS survey (Giavalisco et al. 2004) allowing us to use GOODS as a reference field sample. Since SDSS J1030+0524 is about 30 arcsec from a 12th magnitude star, we placed the star in the interchip gap of the WFC. This avoids any bleeding along the CCD columns. The images were dithered to improve the PSF sampling and we obtained a total of 7 images in F775W and 9 images in F850LP.
The data were processed by the ACS pipeline (CALACS), which performs the basic data reduction steps of bias subtraction, dark subtraction and flat fielding of the raw data, resulting in the flat-fielded images (the flt files). The post-pipeline processing steps include the creation of individual weight maps for each flt file, drizzling to the same scale as GOODS (0.03 arcsec/pixel) using MultiDrizzle (Koekemoer et al. 2002), correcting for correlated noise introduced by MultiDrizzle, and masking any bad pixels and pixels that were less than 10% of the total exposure time. The final MultiDrizzle run was performed with parameters and and with to make use of individual weight maps. Special care was taken in producing the weight maps used as an input to MultiDrizzle, which also helps eliminate many spurious detections from the resulting object catalogs.
Source detection was done on the -band images, using the same version of Sextractor (Bertin & Arnout 1996) used by the GOODS collaboration and the same input parameters in order to facilitate a straightforward comparison between the two catalogs. The software was run with the MultiDrizzle output image (drz file) and weight map (converted to an rms map). The Sextractor parameters used attempt to maximize the number of faint sources found while minimizing the number of false detections. We performed isophotal photometry, mag_auto photometry, photometry with a 16 pixel fixed diameter and photometry at the half light radius. The photometric errors calculated by Sextractor are measured from the weight maps and take into account the background and instrumental noise and exposure time information. We verified that the various photometric measurement were consistent and for the rest of the analysis we used the mag_auto photometry. We have only considered sources detected in at . For these sources we have computed the color directly from the magnitude when the flux was measured to better than 2 or otherwise from the 2 upper limit to the flux. We have run completeness simulations in the SDSS J1030+0524 field and found that our photometry has comparable completeness to GOODS. We find that we reach 50% completeness for compact galaxies at . Finally, we have verified that our catalog contains no contamination by noise peaks mistakenly identified as galaxies by running a negative image test (Dickinson et al. 2004, Yan & Windhorst 2004).
3. Candidate objects at
The final Sextractor catalog contains 1551 objects. Fig. 1a shows the counts for the SDSS J1030+0524 field and those for the GOODS N and S fields corrected to the same area. The QSO is recovered as the reddest object in the field. Fig. 1b shows the color distribution of all objects with . The basic distribution in both counts and color are similar in the SDSS J1030+0524 area and in GOODS. This is an independent test that the GOODS catalog and ours are generally consistent.
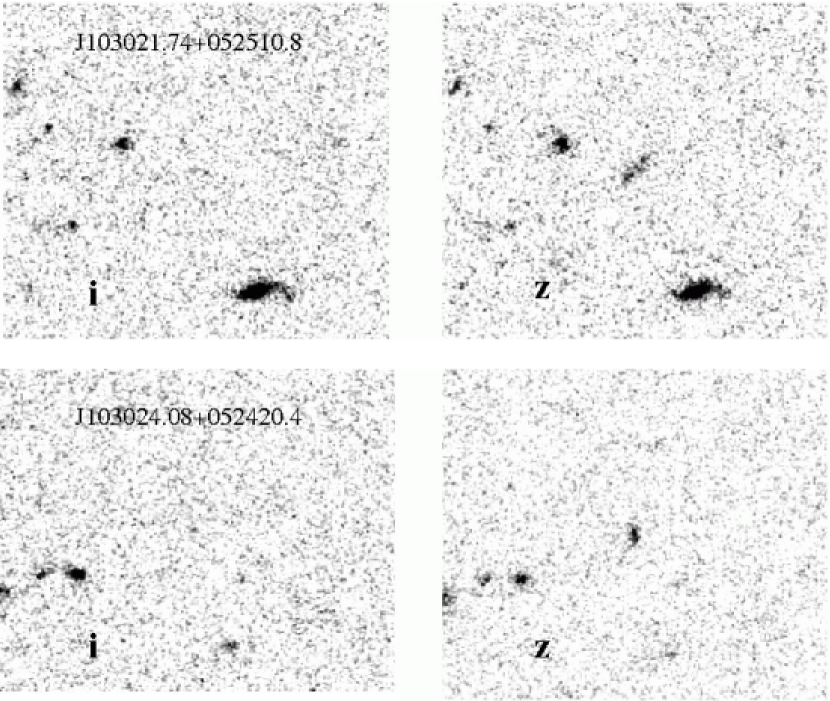
Excluding the QSO, a total of 8 objects have , and . We expect that a high fraction of galaxies with will be at as Malhotra et al. (2005) have shown that at about 90% of these objects are truly at high-redshift. At our color cut, and in agreement with Willott et al. (2004), we do not find a significant overall source density excess between the SDSS J1030+0524 field and GOODS. However, when we adopt the more conservative cut , we still find 7 objects (excluding the QSO) in the SDSS J1030+0524 field against the 3.33 expected from GOODS. This is illustrated graphically in Fig. 1c where we show the counts of objects redder than . The objects are generally resolved as shown in Fig. 2 for two objects from this selection.
4. A First Attempt at Spectroscopic Confirmation
Spectroscopic observations of eight of the color-selected candidates were obtained using the LRIS instrument (Oke et al. 1995) on the W.M. Keck Observatory’s 10-m Keck-I telescope in multislit mode. The data were obtained on the nights of UT 2004 December 10 and 15, in moderate to good conditions, with an effective total exposure time of 2.8 hours per night. All observations employed a 400 lines mm-1 grating ( Å), giving an effective resolution of FWHM Å. The data were reduced using standard procedures and flux-calibrated using archival data obtained in photometric conditions through the same instrument configuration.
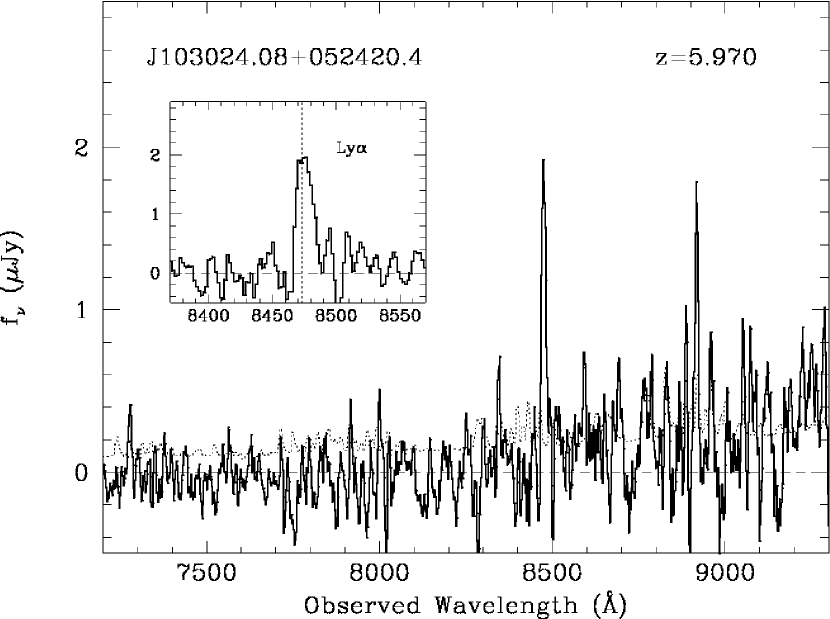
Only one of the targeted sources, J103024.08+ 052420.4, shows an emission line, allowing an unambiguous redshift identification. Its spectrum, derived from the UT 2004 December 10 data when conditions were more favorable, is shown in Fig. 3. The emission line reproduced on UT 2004 December 15. The spectrum shows a single, isolated, asymmetric, high equivalent width emission line, characteristic of high-redshift Ly emission (cf. Stern et al. 2005). A weak continuum decrement across the emission line is also evident, characteristic of absorption due to the Ly forest at high redshift. We derive a redshift of for this source, confirming that our -drop criteria reliably identify galaxies.
The spectra of the remaining targets do not have a sufficient signal-to-noise to make any other firm identifications at this point. Further analysis of these and other, related data will be presented elsewhere.
5. Discussion and Conclusions
The probability of finding 7 objects when one expects 3.33 is 0.7% if the distribution is Poissonian. However, the true probability would probably be higher because of clustering. Indeed, by randomly overlaying WFC fields within GOODS we find that the probability of one such field containing 7 objects with is about 3%.
Luckily we do not only have the number of red objects but also their distribution in color and this also turns out to be different from that within GOODS. In Fig. 1d we show the cumulative distribution of objects within the SDSS J1030+0524 field and in GOODS (renormalized to the same area). Clearly, the SDSS J1030+0524 object distribution appears to be different from that of GOODS. We have applied a Kolmogorov-Smirnov test to determine whether the distribution of the 8 sources in SDSS J1030+0524 redder than and that of the 252 in GOODS with the same color cut are drawn from the same parent distribution. The result is a difference value of corresponding to a probability 0.55%.
Thus, we find that the SDSS J1030+0524 field appears to have an excess of red objects. Our result is in agreement with Willott et al. (2004) as our data set is deeper and the majority of the excess sources are fainter than .
If the SDSS J1030+0524 does indeed have an excess of red sources, one may wonder whether their redshift is the same as the QSO. The selection should be effective at selecting objects at redshift greater than 5.9. Indeed, the one object for which we could obtain a spectroscopic confirmation satisfies this constraint. Most of the sources are too faint to be able to measure a color as red as that of the QSO but 3 of the 7 sources are detected as dropouts, i.e. their band flux is measured at less than 2. It should also be noted that SDSS QSOs at are extremely rare objects and are presumably associated to rare density peaks which may correspond to perturbations on very large scales. The size of large scale structures seen at lower redshift can go up to at least 50 comoving Mpc which would correspond to at . Thus, we expect some, but not all, of the excess sources to be at . We do not know whether J103024.08+052420.4 belongs to the same overdensity as the QSO as the redshift difference is sizeable. However, one can speculate that if it did, it would imply a minimum size for the overdensity of comoving Mpc along the line of sight. If the overdensity had this typical size also in the transverse direction, this would translate into an angular extension of arcmin.
The discovery of a density excess near SDSS J1030+0524 is potentially very interesting and requires a further confirmation. Additional spectroscopic follow-up is now in progress. The presence of a very extended overdensity could be verified by repeating this search over a much larger area. We also plan to repeat this study on 4 more fields around redshift QSOs, which will be reported elsewhere.
References
- Barkana and Loeb (2001) Barkana, R., & Loeb, A. 2001, Phys. Rep., 349, 125
- Becker et al. (2001) Becker, R. H., et al. 2001, AJ, 122, 2850
- Bertin & Arnouts (1996) Bertin, E. & Arnouts, S. 1996, A&AS, 117, 393
- Bunker et al. (2004) Bunker, A. J., Stanway, E. R., Ellis, R. S. & McMahon, R. G. 2004, MNRAS, 355, 374
- Cen (2003) Cen, R. 2003, ApJ, 591, 12
- Ciardi et al. (2003) Ciardi, B., Ferrara, A., & White, S. D. M. 2003, MNRAS, 344, L7
- Dawson et al. (2004) Dawson, S., et al. 2004, ApJ, 617, 707
- Dickinson et al. (2004) Dickinson, M., et al. 2004, ApJ, 600, L99
- Djorgovski et al. (1999) Djorgovski, S. G., Odewahn, S. C., Gal, R. R., Brunner, R., & de Carvalho, R. 1999, ASPCS 191, 179
- Djorgovski (1999) Djorgovski, S. G. 1999, ASPCS, 193, 397
- Djorgovski et al. (2001) Djorgovski, S. G., Castro, S., Stern, D., & Mahabal, A. 2001, ApJ, 560, L5
- Djorgovski et al. (2003) Djorgovski, S. G., Stern, D., Mahabal, A. A. & Brunner, R. 2003, ApJ, 596, 67
- Djorgovski (2003) Djorgovski, S. G. 2004, preprint (astro-ph/0409378)
- Efstathious & Rees (1988) Efstathiou, G. & Rees, M. J. 1988, MNRAS, 235, 715
- Fan et al. (2001) Fan, X., et al. 2001, AJ, 122, 2833
- Giavalisco et al. (2004) Giavalisco, M., et al. 2004, ApJ, 600, L93
- Gnedin (2000) Gnedin, N. Y. 2000, ApJ, 542, 535
- Gnedin (2004) Gnedin, N. Y. 2004, ApJ, 610, 9
- Gnedin and Ostriker (1997) Gnedin, N. Y., & Ostriker, J. P. 1997, ApJ, 486, 581
- Gunn and Peterson (1965) Gunn, J. E., & Peterson, B. A. 1965, ApJ, 142, 1633
- Haiman & Holder (2003) Haiman, Z. & Holder, G. P. 2003, ApJ, 595, 1
- Loeb & Barkana (2002) Loeb, A. & Barkana, R. 2002, ARAA, 39, 19
- Kaiser (1984) Kaiser, N. 1984, ApJ, 284, L9
- Koekemoer et al. (2002) Koekemoer, A. M., Fruchter, A. S., Hook, R. & Hack, W. 2002, HST Calibration Workshop, STScI, Arribas, et al. eds, 337
- Kogut et al. (2003) Kogut, A. et al. (the WMAP team) 2003, ApJS, 148, 161
- Madau (2000) Madau, P., Philosophical Transactions of the Royal Society of London, Series A, Vol. 358, no. 1772, 2021
- McDonald & Miralda-Escudé (2001) McDonald, P., & Miralda-Escudé, J. 2001, ApJ, 549, L11
- Miralda-Escudé et al. (2000) Miralda-Escudé, J., Haehnelt, M., & Rees, M J. 2000, ApJ, 530, 1
- Oke et al. (2005) Oke, J. B., et al. 1995, PASP, 107, 375
- Ouchi et al. (2005) Ouchi, M., et al. 2005, ApJ, 620, L1
- Somerville et al. (2003) Somerville, R. S., Bullock, J. S. & Livio, M. 2003, ApJ, 593, 616
- Steidel et al. (1999) Steidel, C.C., Adelberger, K. L, Giavalisco, M., Dickinson, M., & Pettini, M. 1999, ApJ, 519, 1
- Stern et al. (2005) Stern, D., et al. 2005, ApJ, 619, 12
- Steidel et al. (2003) Steidel, C. C., Adelberger, K. L., Shapley, A. E., Pettini, M., Dickinson, M. & Giavalisco, M. 2003, ApJ, 592, 728
- Stiavelli (2002) Stiavelli, M. 2002, in “Future Research Directions and Visions for Astronomy,” SPIE, A. Dressler Ed., p. 122
- Venemans et al. (2003) Venemans, B. P., Kurk, J. D., Miley, G. K. & Röttgering, H. J. A. 2003, New Astr. Rev., 47, 353
- White et al. (2003) White, R., Becker, R., Fan, X., & Strauss, M. 2003, AJ, 126, 1
- Willott et al. (2004) Willott, C. J., et al. 2004, in “Growing Black Holes,” ESO (Garching), Merloni, et al. eds, in press (astro/ph 0410306)
- Wyithe and Loeb (2003) Wyithe, J. S. B., & Loeb, A. 2003, ApJ, 588, L69
- Yan & Windhorst (2004) Yan, H. & Windhorst, R. A. 2004, ApJ, 612, L93