Analysis of Strong Outbursts in Selected Blazars from the Metsähovi and UMRAO Monitoring Databases
Abstract
Frequency-dependent time lags for strong outbursts in four -blazars are determined. The time lags for two adjacent outbursts in 2230+114 are correlated with the outburst amplitudes. There is evidence that bright outbursts in 2230+114 appear with a quasi-period of () yr.
Insitute of Applied Astronomy of the RAS, Zhdanovskaya St. 8, 197042 St.-Petersburg, Russia
St.-Petersburg State University, Bibliotechnaya sq. 2, Petrodvoretz, 198904, St.-Petersburg, Russia
Physics Department, University College Cork, Cork, Ireland
Institute for Astrophysical Research, Boston University, Boston, USA
Astronomy Department, University of Michigan, USA
Metsähovi Radio Observatory, Helsinki University of Technology, Finland
According to both theoretical arguments (Marscher 1996; Lobanov 1998) and observational data (Pyatunina et al. 2000; Zhou et al. 2000), two different types of outbursts should be found in the variable radio emission of blazars, namely, “core” and “jet” outbursts. Core outbursts show frequency-dependent time delays, and are probably associated with core brightening due to a primary perturbation. Jet outbursts evolve nearly synchronously at all frequencies, and may be associated with variability accompanying the propagation of the perturbation along the jet. The interval between two successive core outbursts could define the duration of an activity cycle, from the origin of a primary perturbation in the “central engine” until it fades into the quiescent jet. The questions of how stable this interval is for a particular source and how it varies from source to source may be key for our understanding of the activity’s grand design. In addition, frequency-dependent time delays can be used to test models of the nonthermal emission in blazars (Lobanov 1998; Marscher 2001).
The combined data of the University of Michigan Radio Astronomical Observatory (UMRAO; Aller et al. 1985) and Metsähovi Radio Observatory (Teräsranta et al. 1992) provide us with radio light curves from 4.8 to 37 GHz covering time intervals up to years. As a first study sample, we chose the four -ray blazars (Jorstad et al. 2001) 0458-020, 0528+134, 1730-130 and 2230+114.
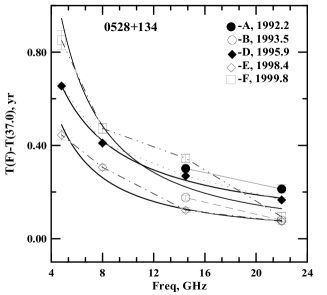
We separated the most prominent outbursts in the radio light curves into individual components by Gaussian model fitting. The frequency-dependent time lags for the components were determined and approximated by exponential functions of frequency of the form (Lobanov 1998): .

The light curves of 0458–020 for 1985–2002 display three outbursts with their maxima near 1989, 1993 and 1995. Only the first of these shows frequency-dependent time lags and can accordingly be classified as a core outburst. The time lag at 4.8 GHz is yr, with the index . The last two outbursts show no time lags, and can be considered jet outbursts.
In 1730–130, an extremely bright and narrow spike (half-width months) was observed at 230 GHz in 1995 (Bower et al. 1997). Weak signs of the spike can also be seen at 37 GHz, but fade at lower frequencies. The time delay at 4.8 GHz for the core outburst of 1995–1997 is yr, with .
The outbursts in 0528+134 and 2230+114 display fine structure and can be resolved into narrow ( year) spikes. The time lags and indices of the exponential functions vary from spike to spike (Fig. 1). Savolainen et al. (2002) suggested that outburst fine structure can be induced by shocks that grow and decay in the innermost few tenths of a milliarcsecond. The bright outbursts in 2230+114 seem to appear quasi-periodically at intervals of yr. The last two of three observed outbursts are shown in Fig. 2. Although the amplitudes of individual spikes vary from one quasi-period to another, their relative positions are preserved, within the uncertainty introduced by variations in the time lags. The first maximum of the next outburst in 2230+114 is expected near .
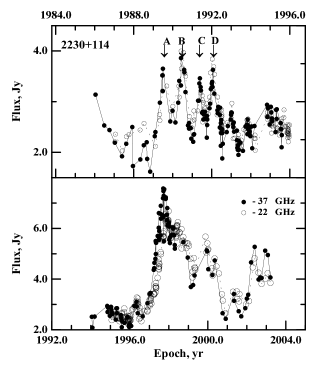
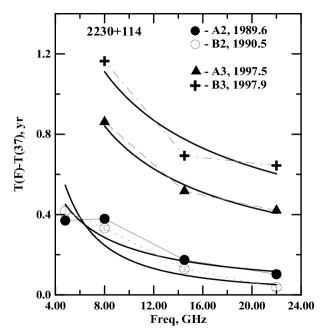
The time lags for the two periods of activity in 2230+114 shown in Fig. 2 are correlated with the corresponding outburst amplitudes: spikes A and B of the brightest outburst, with its maximum near 1997.5, show greater time lags than spikes A and B of the outburst with its maximum near 1989.6.
A powerpoint presentation of this material is available at the web site http://www.aoc.nrao.edu/events/VLBA10th/posters.html.
References
Aller, H.D. et al. 1985, ApJS, 59, 513
Bower, G.C. et al. 1997, ApJ, 484, 118
Lobanov, A.P. 1998, A&A, 330, 79
Marscher, A.P. 1996, in ASP Conf. Ser. Vol. 110, Blazar Continuum Variability, ed. H.R. Miller, J.R. Webb & J.C.Noble (San Francisco: ASP), 248
Marscher, A.P. 2001, in ASP Conf. Ser. Vol. 224, Probing the Physics of Active Galactic Nuclei by Multiwavelength monitoring, ed. B.M. Peterson, R.S. Polidan, R.W. Pogge (San Francisco:ASP), 23
Jorstad, S.G. et al. 2001, ApJ, 556, 738, arXiv:astro-ph/0102012
Pyatunina, T.B. et al. 2000, A&A, 358, 451
Savolainen, T. et al. 2002, A&A, 394, 851
Teräsranta, H. et al. 1992, A&AS, 94, 121
Zhou, J.F. et al. 2000, ApJ, 541, L13, arXiv:astro-ph/0009452