Spitzer Observations of Optically “Invisible” Radio And X-Ray Sources: High Redshift AGN
Abstract
We have combined a survey at 24 m to 0.3 mJy with the Multiband Imaging Photometer (MIPS) on the Spitzer Space Telescope, a 20 cm A-array Very Large Array survey covering 0.5 deg2, and an existing 172 ks Chandra X-Ray Observatory exposure to investigate the nature of optically faint radio and X-ray sources in the NOAO Deep Wide-Field Survey (NDWFS) in Boötes. We find little overlap between the radio and infrared selected populations: only 9% of the infrared sources are detected in the radio and only 33% of the radio sources are detected in the infrared. Thirty-six (10%) of the 377 compact radio sources lack optical counterparts in the NDWFS , , & images. We refer to these objects as optically invisible radio sources (OIRS). Only four (13) of the thirty-one OIRSs observed with MIPS are detected at 24 m. Comparisons of the radio and infrared properties of the OIRSs with various galaxy spectral energy distributions demonstrate that most of these sources are powered by AGN rather than starbursts. Similarly, eleven X-ray sources observed by both MIPS and the VLA are classified as optically invisible X-ray sources (OIXS). None are detected at 24 m or 20 cm. All seven OIXSs detected in Chandra’s 0.5-2 keV band have infrared to X-ray flux ratios consistent with their luminosity being dominated by an unobscured AGN. From these results we conclude that both the optically invisible radio and X-ray source populations are primarily AGN, relatively unaffected by dust and most likely at z 1. No OIRSs are detected in X-ray emission and no OIXSs are detected at 20 cm. However, given the wide range in radio and X-ray properties of known AGN and the size of our samples, this lack of overlap does not necessarily imply different AGN source populations.
1 Introduction
Determining the star formation density of the Universe beyond z1 and the contribution made by AGN to the luminosity evolution of galaxies are two fundamental goals of observational cosmology. Addressing these questions requires observations at wavelengths capable of locating intrinsically luminous sources that are either heavily obscured by dust, or so distant that their rest-frame optical wavebands fall below the cutoff for intergalactic hydrogen absorption (i.e., the Lyman limit). Locating and understanding such obscured sources is a fundamental objective of the Spitzer Space Telescope (Spitzer; Werner et al. 2004) mission111The Spitzer Space Telescope is operated by JPL, California Institute of Technology for the National Aeronautics and Space Administration. Information on Spitzer can be found at http:ssc.spitzer.caltech.edu, which is capable of identifying z 1 galaxy populations that are luminous at infrared wavelengths but faint optically due to the effects of dust. Starbursts and AGN are expected to be powerful emitters at radio wavelengths due to large populations of radio-luminous supernova remnants for starbursts and accretion disk phenomena for AGN. Indeed, sensitive radio surveys routinely find populations of sub-mJy point sources with either very faint optical counterparts or no counterparts at all (e.g., Richards et al. 1999; Fomalont et al. 2002). Whether these sources represent dust enshrouded starburst galaxies at z 1-3 or radio loud AGN at z 4 has yet to be determined conclusively. This suggests as a strategy for locating heavily obscured starbursts and AGN at high redshifts the definition of infrared and radio source populations that are either extremely faint at all optical bands or “invisible”, i.e., objects that can not be distinguished from the background in deep optical images.
The NOAO Deep Wide-Field Survey222The NOAO Deep Wide-Field Survey is supported by the National Optical Astronomy Observatory, which is operated by AURA, Inc., under a cooperative agreement with the National Science Foundation. Information on the NDWFS can be found at http:www.noao.edunoaonoaodeep. (NDWFS; Jannuzi & Dey 1999) provides multiband optical imagery to very faint magnitudes over large survey areas, and so is uniquely suited for comparison to other surveys in search of sources that are optically invisible. In particular, the NDWFS field in Boötes covers 9.3 deg2 to sensitivities in , , & of approximately 26.5, 25.5, & 24.7 (Vega) magnitudes respectively.333These represent the 50 completeness limits in the source catalogs for the area involved in this study. Similar sensitivities are expected throughout the survey. To explore the mid-infrared characteristics of this data set, we have surveyed most of the Boötes field at wavelengths of 24, 70, & 160 m with Spitzer’s Multiband Imaging Photometer (MIPS; Rieke et al. 2004). At 24 m the point source sensitivity is 0.3 mJy (5 ) and the angular resolution is 5.5″(FWHM). We will present other results of this infrared survey in more detail in future publications, although the survey and analysis techniques have been described by Papovich et al. (2004).
Deep and high resolution radio data are important for a full understanding of the nature of the sources detected by MIPS. This follows from the well established tight correlation between infrared and radio flux densities in star forming galaxies (de Jong et al. 1985; Helou et al. 1985), which is a consequence of the life (re-radiation of UV photons by dust) and death (SNe remnants) of massive stars. As a result, the ratio of infrared to radio flux densities provides a means of distinguishing starbursts from AGN. Moreover, the sub-arcsecond positional accuracy attainable with radio interferometric surveys allows confident matching of sources discovered in infrared surveys, which can have poorer spatial resolution. This is especially important if a source is indeed optically invisible. For these reasons, we conducted sensitive and high angular resolution observations of a 0.5 deg2 subregion within the Boötes field with the Very Large Array (VLA) at 20 cm. These observations were designed to detect dusty starburst galaxies with 24 m flux densities greater than 0.75 mJy based on their expected spectral energy distributions and likely redshift range.444For these estimates we used the starburst infrared/radio correlation of Yun et al. (2001) together with K-corrections from the SED templates of Lagache et al. (2002). Although the MIPS 24 m survey reaches a fainter limit than this, we chose this infrared limit for matching radio observations because we were primarily interested in selecting sources bright enough to obtain spectra with the Infrared Spectrograph (IRS; Houck et al. 2004) on Spitzer (i.e., Higdon et al. 2004, Houck et al. 2005).
Our survey region was chosen to overlap the northern Large Area Lyman Alpha survey field (LALA; Rhoads et al. 2000), which includes an extremely deep (172 ks) Chandra X-Ray Observatory integration by Wang et al. (2004), centered at RA = 14h 25m 37.79s and Dec = +35∘ 36 00.2 and covering 0.1 deg2. The X-ray point source sensitivities are 1.5 10-16 erg s-1 cm-2 in the “soft” 0.5-2.0 keV band and 1.0 10-15 erg s-1 cm-2 in the “hard” 2.0-7.0 keV band (both 5 ). Only the North and South Chandra Deep Fields (2 and 1 Ms integrations respectively) are substantially deeper. As a result, there was minimal overlap with the much more extensive 20 cm survey of the Boötes field by de Vries et al. (2002) using the Westerbork Synthesis Radio Telescope (WSRT). In this paper we will use the combined X-ray, optical, infrared, and radio catalogs to investigate the nature of Optically Invisible Radio and X-ray Sources (OIRS & OIXS) in our radio survey area. These are defined to be X-ray and compact radio sources that have no apparent counterparts in the NDWFS , , & images. In addition, we wish to see how the properties of these two optically invisible populations compare with one another.
The outline of this paper is as follows: we first discuss the VLA observations and data reduction in 2. This is followed by a brief discussion of the radio source catalog in 3 and our criteria for matching sources from the MIPS, Chandra, and VLA surveys. We then describe the infrared, radio, and X-ray properties of the optically invisible radio and X-ray sources (4) in order to constrain the dominant source of their luminosity. Finally, before summarizing in 6, we compare the average space densities of the OIRSs and OIXSs with those of other galaxies, including quasars, and also consider whether OIRSs and OIXSs are drawn from the same population in 5. Throughout this paper, we have assumed a flat CDM cosmology with =0.27, =0.73, and a Hubble constant of 71 km s-1 Mpc-1.
2 Radio Observations And Reduction
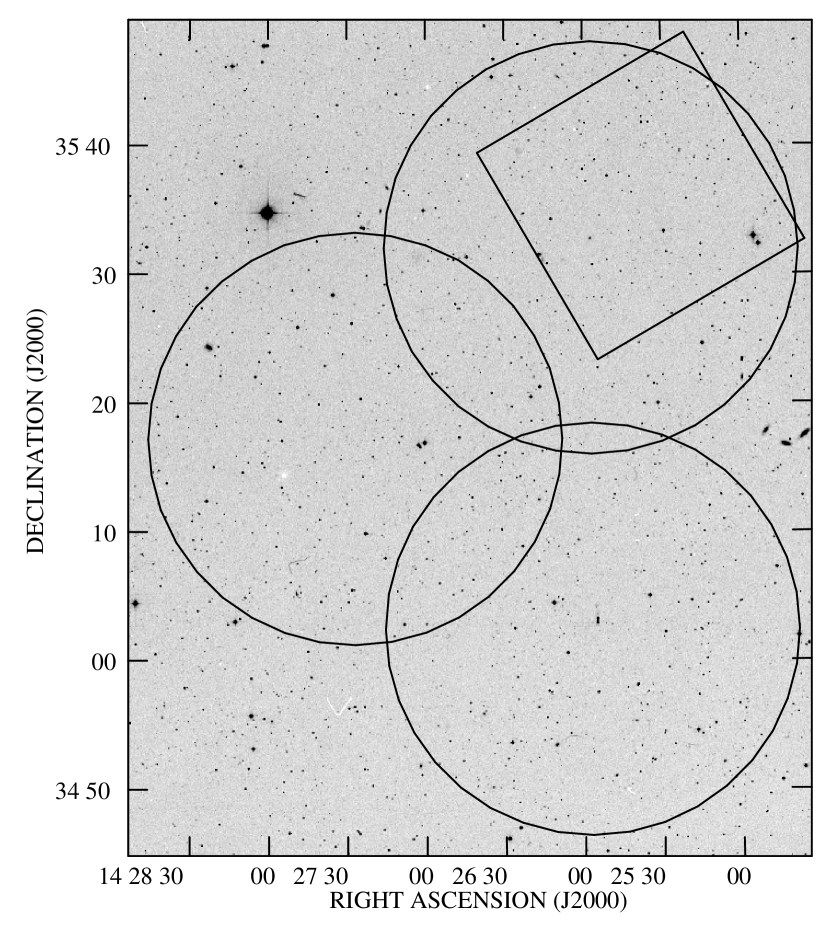
We observed three overlapping fields within the NDWFS in Boötes with the VLA in the A-configuration at 20 cm. These fields, labeled North, East, and South, are shown in Figure 1, which also depicts the Chandra survey field of Wang et al. (2004). The field center coordinates and other details of the observational setup are given in Table 1. Spectral line mode was used to minimize bandwidth smearing and facilitate the flagging of narrow band radio interference. The correlator was configured to provide two sets of seven channels (3.125 MHz separation), each centered at 1.3649 and 1.4351 GHz. Both left and right handed circular polarizations were measured at the two frequencies. Each field was observed in 40 minute blocks, inter-spaced with 2 minute observations of the nearby secondary calibrator 1416+347 (S = 1.96 0.01 Jy) to correct drifts in the antenna gains and phases. Flux and bandpass calibration were accomplished with longer observations of the primary flux calibrator 3C 48 (S = 15.01 0.01 Jy, Baars et al. 1977) made at the start of each night. On-source integrations totaling 5.5, 4.9, and 5.4 hours were achieved at the North, East, and South positions, respectively.
The visibilities were processed using routines in NRAO’s Astronomical Imaging Processing System (AIPS) software package. A standard antenna based calibration was applied to each data set after excising a very small fraction of the data that was corrupted by radio interference. The routine IMAGR was used to map the primary beam with the correct w-phase terms (DO3DIMAG=1). Images were made using a robust weighting parameter of 1.1, which improved the beam shape at the expense of an 7 increase in noise. Radio sources from the FIRST catalog (Becker et al. 1995) that were located outside the primary beams yet capable of contributing significant side lobes were also cleaned. Self-calibration was helpful in improving the antenna based calibration, particularly in the South field, which is dominated by a double-lobed radio source (87GB 142337.6+351136). After convolving to a common resolution of 1.40″ FWHM, the three final images were placed on a common grid and combined. The resulting rms at the three field centers is 15 Jy beam-1, which is in good agreement with the expected noise levels using the array parameters listed in the VLA Observational Status Summary. Since we have imaged only three array pointings, significant variations in sensitivity exist across the survey field. Close to the field centers where the sensitivity is the highest we can detect point sources as faint as 80 Jy. However, the faintest point source we are capable of detecting throughout the entire survey is 200 Jy. For this reason we do not attempt to produce a radio source catalog that is complete to a given flux density limit. This does not affect our ability to calculate flux density ratios and limits for the radio, infrared, and X-ray sources. However it will impact our estimates of surface densities.
3 Source Identification And Matching
We restricted our radio survey to where the sensitivity in the combined pointings exceeded 40 of the pointing centers, i.e., where the 1 noise is less than 37 Jy beam-1. This corresponds to a total area of 0.5 deg2. We used SExtractor (Bertin & Arnouts 1996) to identify radio sources in our survey rather than the AIPS routine SAD or its variants, even though SExtractor is more commonly used to find and catalog sources in optical images. This was because of the package’s flexibility and our experience using it. After first smoothing the input radio image with a Gaussian profile matching the synthesized beam, SExtractor identified groups of at least five contiguous pixels, each exceeding the locally defined 2.5 background fluctuations. From this first cut of source identification, only those with a peak pixel value exceeding five times the local background rms were classified as source candidates. These were checked visually, and the small fraction found to be detections of residual sidelobes or radio source structure (e.g., hot spots in jets) were deleted from the catalog. A total of 392 sources satisfied these selection criteria, of which 377 are point-like or marginally resolved. These objects are classified as “compact” objects in the radio source catalog. Flux densities were measured using the AIPS task IMFIT with the final primary beam corrected image. We determined fluxes for extended objects using the AIPS task BLSUM.
We estimated the number of false detections in our survey by running SExtractor with the same settings on the radio image multiplied by -1. Assuming that the background noise is symmetric with respect to the mean, the number of sources detected in the reversed image should equal the number of false positives. Only three negative “sources” were found that were not associated with side-lobes, and all of these were 5.5 times the local rms. As a check of this analysis, we calculated the number of independent beams in the radio survey and then estimated the number of 5 detections one would expect from random fluctuations. For 5 106 beams we expect only two spurious 5 detections and none at the 6 level. We therefore expect minimal contamination of our radio catalog by false sources, with two to three of the nearly four-hundred detections being spurious.
We compared the coordinates of the compact sources with the NDWFS optical catalog.555Catalogs were derived using the third data release (DR3) version of the NDWFS optical images (Jannuzi et al. in preparation, http:www.noao.edunoaonoaodeep). It was found that two-thirds of the radio sources had an optical counterpart within 0.3″. Because the great majority of these identifications are real, this value was taken as the 1 relative positional accuracy. Similarly, the measured 1 scatter in RA and Dec between the 24 m sources and their nearest optical counterparts is 0.3″ for F24μm 0.75 mJy. The positional accuracy was somewhat worse (1) for the MIPS sources near 0.3 mJy. The positional accuracy of the “soft” band X-ray sources listed in Table 1 of Wang et al. (2004) ranges from 0.3 to 3.5″, but is typically 1″. We will adopt this as the X-ray source positional accuracy.
The identification of optically invisible radio sources was a two step process. First we correlated the positions of all 377 compact radio sources with the NDWFS , , and -band catalogs, stipulating that OIRS candidates must not have a cataloged optical counterpart centered within a 1.5″ radius (5 ). For the candidates passing this test, we inspected the NDWFS images at these positions to verify that no optical source was visible in any band. A small number of candidates without apparent optical counterparts but close to the edges of field galaxies were also rejected. This process yielded thirty-six OIRSs, which we list in Table 2. The identification of optically invisible X-ray sources was carried out in a similar manner, starting with the thirteen sources in Table 1 of Wang et al. (2004) with positional uncertainties less than 2″ that lack , , & counterparts.
To determine if the OIRSs and OIXSs had infrared counterparts, we then compared their positions with the MIPS 24 m catalog (F24μm 0.3 mJy), calling a radio and infrared source matched if their positions differed by less than 2.5″. Infrared fluxes or upper-limits for the OIRSs are given in Table 2. Similarly, we adopted as criteria for matching radio to X-ray and X-ray to infrared sources that their coordinates agree to 2″.
4 Results And Analysis
4.1 Properties Of The OIRS Population
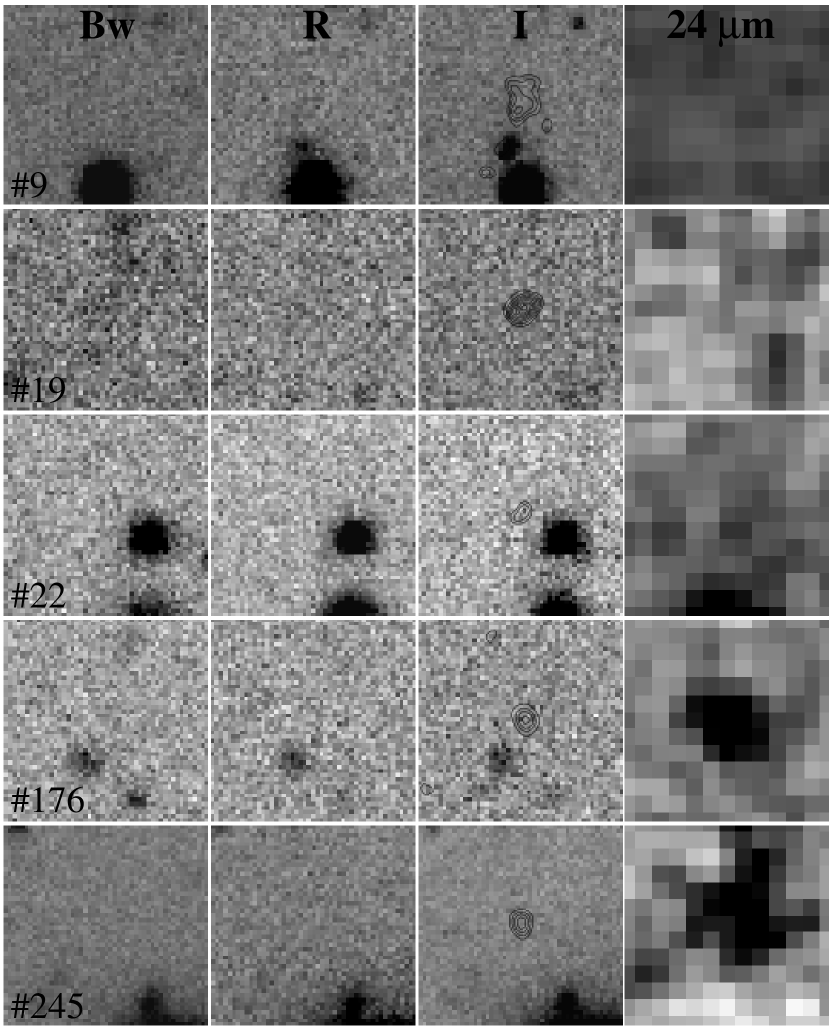
We identified a total of thirty-six OIRSs over the 0.5 deg2 survey area, a number representing 10 of the total compact radio source population. Table 2 lists their radio catalog number, source name incorporating J2000 coordinates, and physical properties. Nearly all (86) are detected above the 5.5 level, where we expect no spurious sources. Figure 2 shows 1212 sub-images from the NDWFS , , and data centered on five of the OIRSs, along with the corresponding sub-images from the MIPS 24 m survey field. The radio continuum source structure for each is shown contoured on the I-band sub-images, with the lowest contour representing the local 3 noise level in the radio image.
The precise magnitude limit for an OIRS will depend on the position of the source in the NDWFS field. We therefore derived , , and upper-limits for the 31 OIRS within 2 diameter apertures centered on their positions using the appropriate NDWFS zero-point constants.666Limits were calculated using q∘ - 2.5 log(5 rms ), where Npix and rms are the number of pixels and variance within the 2 diameter aperture respectively, and q∘ is the zero-point constant. Typical magnitude limits are 27.0, 25.7, and 25.0 (Vega) in , , and , respectively. These are listed in Table 2 for each source. Figure 3 shows a histogram of the integrated 20 cm continuum flux densities for the OIRS sample. Nearly 90 are sub-mJy radio sources (median F = 0.40 mJy), though five have flux densities greater than 1 mJy. Source 362 possesses the peak flux density for the sample of nearly 7 mJy. Thirty-one OIRSs were included within the MIPS survey area. Only four of these - sources 97, 176, 245, and 363 in Table 2 - were detected at 24 m above 5 . We stack-averaged the remaining twenty-seven MIPS sub-images in an attempt to detect fainter emission levels. No significant signal was detected, and we set an upper-limit on the average infrared flux density for the ensemble of F24μm 60 Jy (5 ).
The small number of radio/infrared matches (13) is a significant result, since from the surface densities of the 20 cm and 24 m sources, we estimate the probability of a random match to be less than 1. We verified the lack of overlap between these two source populations by plotting the OIRSs’ positions on the MIPS 24 m image and inspecting the result visually. Two of these MIPS detected sources are shown in the bottom two rows of Figure 2. Eight OIRSs are situated in the survey area covered by both Chandra and MIPS (0.08 deg2). None were detected at 24 m or in any of the X-ray bands. This sets upper-limits of 0.3 mJy at 24 m and 1.5 10-16 erg s-1 cm-2 in the 0.5-2.0 keV X-ray band for this sub-sample.
Because of the variable sensitivity throughout the radio images, simply dividing the number of OIRSs by the survey area would lead to an under-estimate of their true surface density (). This is due to the fact that the fainter radio sources can only be detected near the pointing centers where the sensitivity is the highest. We have attempted a first-order correction to this effect by first weighting each OIRS by the ratio of the total survey area to the area where it could have been detected given its peak 20 cm flux density (Hopkins et al. 1999). Doing so resulted in an average surface density of = 104 17 deg-2, where the uncertainty represents Poisson counting errors only. There is a strong dependence on flux density. We divided the OIRSs into three flux density bins, F 400 (17 sources), 400-600 (13 sources), and 600 (6 sources) Jy beam-1, and calculated the average surface density for each as above. We find that ( 400 Jy beam-1) = 66 12 deg-2, (400-600 Jy beam-1) = 26 11 deg-2, and ( 600 Jy beam-1) = 12 5 deg-2, i.e., the OIRS surface density increases with decreasing 20 cm flux density.
4.2 Are The OIRSs Powered By Star Formation Or AGN?
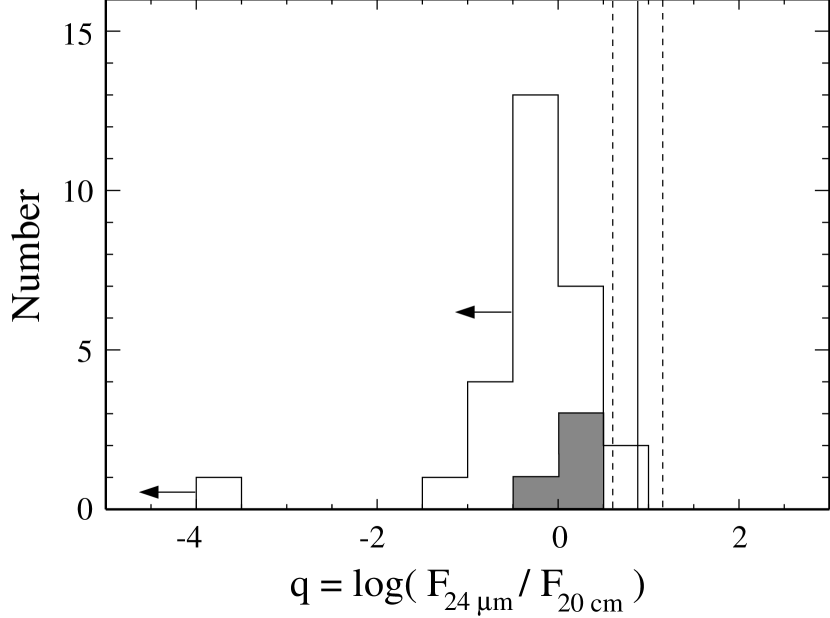
The logarithm of the infrared to radio continuum flux density ratio, or q, is a useful parameter for distinguishing sources powered by massive star formation from AGN, and especially radio-loud AGN. In Figure 4 we show the distribution of q using the MIPS 24 m and 20 cm radio continuum data in Table 2 for the OIRS sample (i.e., q = log(F24μm/F20cm)). The four OIRSs detected by MIPS are represented by the shaded histogram bins (-0.5 q 0.5). For the twenty-seven other OIRSs we show a histogram of upper-limits for q, using F24μm = 0.3 mJy in the calculation. The small number of sources precludes a strong conclusion statistically, but we note that three of the four OIRSs with MIPS detections have positive values of q, with a mean of 0.29. Only source 97 has a negative q. On the other hand, of the 27 OIRSs not detected by MIPS, two-thirds (18 of 27) have negative q values. Since these are all upper-limits, it is likely that even a larger fraction of these sources will have q 0.
We first considered the origin of the OIRSs’ emission by comparing the values and upper-limits of q in Table 2 to those derived from local starbursts and AGN for a range of redshifts. Using the most luminous galaxy (31012 L⊙) SED from Lagache et al. (2002), we calculated the observer’s frame F850μm/F24μm ratio for redshifts of 1, 2, and 3. This in turn was used with the scaling in Chary & Elbaz (2001) to calculate the corresponding 20 cm flux densities. Under these assumptions, starburst galaxies with 20 cm flux densities of 200 Jy should have 24 m flux density of 2.8 mJy at z = 1, 2.4 mJy at z = 2, and 1.6 mJy at z = 3. In short, starbursts detected in our radio survey would be easily detected in our 24 m data. These will in turn give rise to values of q equal to 1.15, 1.08, and 0.90 for starbursts at these three redshifts. This is in agreement with Appleton et al. (2004), who found that for flux densities measured at 24 m and 20 cm, starburst dominated systems have q = 0.8 0.3 for z 2. This range is represented in Figure 4 as the solid and dashed vertical lines. The values of q for starburst dominated systems are substantially greater than the upper-limits shown, and even appear significantly larger than the q’s determined for the four OIRSs detected by MIPS. Thus for virtually the entire OIRS sample a clear enhancement in radio continuum emission over that expected for a pure starburst is evident. This indicates the presence of a dominant AGN component.
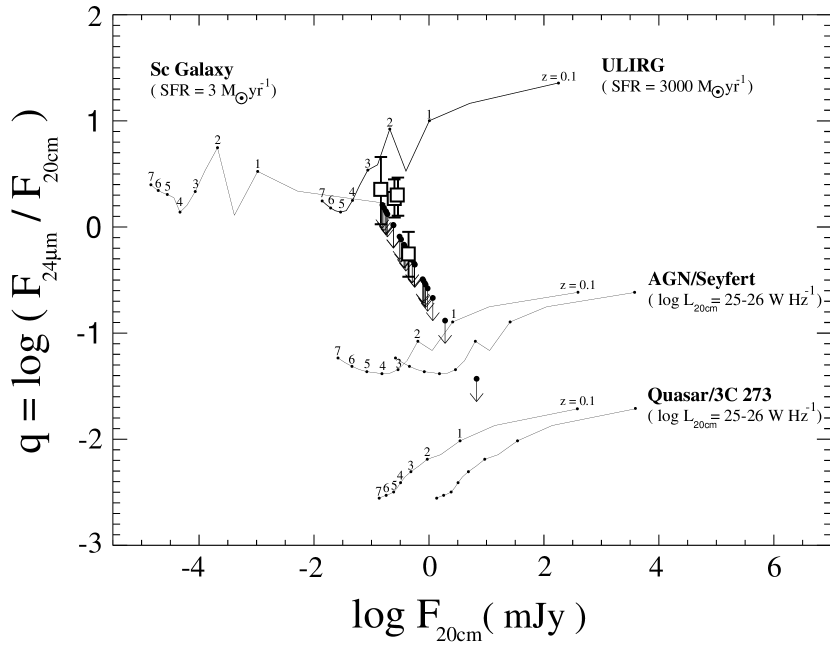
A more detailed illustration with a broader range of SED type is presented in Figure 5, where q is plotted against the logarithm of 20 cm flux density. Four families of curves are shown, representing (from top to bottom) (1) a normal Sc galaxy with a SFR of 3 M⊙ yr-1, (2) a high luminosity starburst/ULIRG with a 3000 M⊙ yr-1 SFR, (3) a type 2 Seyfert AGN (NGC 262), and (4) a QSO with 3C 273’s spectral energy distribution. The late spiral, ULIRG, and AGN/Seyfert SEDs were taken from the compilation of Xu et al. (2001), while the 3C 273 SED was taken from the NED online database. For the two star forming galaxy templates, we first calculated the rest-frame 20 cm luminosity (L20cm in W Hz-1) for a given star formation rate (in M⊙ yr-1) using the calibration given in Equation 6 of Bell (2003). Using this value and the SED we derived the observer-frame F24μm/F20cm ratio as a function of redshift from z = 0.1-7.0. We next calculated the observer-frame 20 cm flux density (F20cm, in Jy) for these redshifts using
| (1) |
where dL is the luminosity distance in cm. The radio spectral index (where Fλ ) was derived from the SED templates over the wavelength range 7 to 20 cm. The starburst, normal, and AGN templates gave similar average spectral indices (mean = 0.65). For the two AGN we considered 20 cm luminosities of 1025 and 1026 W Hz-1, and calculated observer-frame F24μm/F20cm ratios and 20 cm flux densities as above, also for the redshift range z = 0.1-7.0. The resulting four sets of tracks are indexed by redshift from z = 0.1 to 7.
The four MIPS detected OIRSs are shown as unfilled squares in Figure 5. For three (176, 245, & 363), their positions are consistent with the SFR = 3000 M⊙ yr-1 ULIRG template over a z=2-3 redshift range, albeit somewhat displaced below the track. Note that increasing/decreasing the SFR for either the ULIRG or Sc galaxy templates has the effect of moving the tracks to the right/left. The vertical position is controlled solely by the shape of the SED and redshift. It is therefore possible that these could be at z = 4-7 if of sufficient luminosity. The other MIPS detected OIRS (97) is situated well below the ULIRG track, with q = -0.24 0.21. The remaining twenty-seven OIRSs with q upper-limits are shown as filled circles with arrows. Again, two-thirds of them have negative values of q, which is inconsistent with late spiral or ULIRG SEDs at any redshift. These sources show a clear excess in radio emission relative to the infrared compared to a system powered by star formation. The q upper-limits cannot be used to distinguish between Seyfert and quasar templates in Figure 5 (both require q -1 for all z). However, it is clear that the bulk of the OIRSs are powered primarily by an AGN, with many being radio-loud.
4.3 Are The OIXSs Starbursts Or AGN Powered Systems?
X-ray sources with very faint optical counterparts, or no counterparts at all, are also found in deep surveys (e.g., Barger et al. 2003). Like the optically faint radio source population, these objects have been proposed to represent highly obscured starburst galaxies or AGN at very high redshift, or possibly even AGN which are over-luminous in X-rays compared to local examples. To investigate the nature of these sources, we examined the eleven X-ray sources in Table 1 of Wang et al. (2004) without , , & counterparts that were observed by MIPS at 24 m. The properties of these OIXSs, including source number (taken from Table 1 in Wang et al. 2004), J2000 coordinates, “soft” band X-ray fluxes or upper-limits, and optical limits are given in Table 3. Also listed are the OIXSs’ X-ray “hardness ratio” (HR), defined as HR = (H-S)/(H+S), where H and S represent the “hard” 2-7 keV and “soft” 0.5-2 keV band counts, respectively.
No OIXSs were detected at 24 m. This has important consequences for the origin of their X-ray luminosity. Weedman et al. (2004) used infrared and X-ray spectra from a sample of nine starburst regions in four merging systems and three obscured AGN to determine empirically that the ratio IR/X (defined to be the 24 m flux density in mJy to the Chandra 0.5-2.0 keV flux in units of 10-16 erg s-1 cm-2) has a lower bound of 0.2 for starbursts and obscured AGN for z 3. Ratios of IR/X smaller than 0.2 indicate that the source is powered by a relatively unobscured AGN. Note that we should detect any “soft” band X-ray source in Wang et al. (2004)’s survey that is powered by a starburst or heavily obscured AGN (i.e., IR/X 0.2) given the Chandra and MIPS 24 m sensitivities. This empirical criterion can be used to classify the seven OIXSs in our MIPS survey that were detected in the “soft” X-ray band. Figure 6 shows a plot of IR/X versus the X-ray hardness ratio for these sources. All seven have values of IR/X 0.2, which clearly indicates the presence of a dominant unobscured AGN. We can not classify the four OIXSs in Table 3 with “soft” band upper-limits. Nevertheless, at least 64 (7/11) of the OIXSs are powered by unobscured AGN.
The X-ray hardness ratio can be used to place rough constraints on the redshift distribution of the OIXSs. Wang et al. (2004) argued that the X-ray spectrum will soften with increasing redshift, with HR 0.6 marking z 1 objects. In support of this, Wang et al. (2004) determined photometric redshifts for five X-ray sources detected at and z’ bands but not in . The three with z 1-2 have hardness ratios between -0.1 and 0.6, while the two “softest” sources (HR -0.5) have z 4.3. By this criteria, nine out of the eleven OIXSs in our sample can have z 1 (HR 0.6). Four can possibly at z 4-5 (HR -0.5).
No OIXSs were detected by our radio survey, which sets a 20 cm flux density limit of 200 Jy for these sources. Note that at these levels we would have easily detected radio loud quasars with 3C 273-like SEDs and 20 cm luminosities greater than 1025 W Hz-1 beyond redshifts of six (Figure 5), and most Seyfert systems with similar 20 cm luminosities. OIXSs thus appear to be largely a population of radio-quiet AGN.
4.4 Comparison Of Radio, Infrared, & X-Ray Source Catalogs
This study is concerned primarily with the optically invisible source populations. However, it is worthwhile considering the characteristics of the radio, infrared, and X-ray populations as a whole. Because of the tight correlation between infrared and radio flux densities for infrared-luminous galaxies (de Jong et al. 1985; Helou et al. 1985) and because of the indications that the sub-mJy radio population corresponds to faint, star-forming galaxies (e.g., Haarsma et al. 2001), a strong overlap between the radio and MIPS survey samples might be expected. Such an overlap is implied by the results displayed from analogous work in the First Look Survey (FLS) area, for which Appleton et al. (2004) show a clear correlation between flux densities at 24 m and at 20 cm (see their Figure 2). However, the sources plotted there are only those detected in both infrared and radio with redshifts less than 2, which does not provide a comparison of the entire radio and infrared samples in the FLS survey region.
Table 4 shows various source detection statistics for our radio, infrared, and X-ray survey regions. First, we note that our radio survey does not go sufficiently deep to detect the majority of MIPS sources. Within the 0.5 deg2 VLA survey area there are 1405 MIPS detections, and 377 compact radio sources. Only 125 are detected in both wavebands. That is, 9 1 of the infrared sources have radio counterparts and 33 3 of the radio sources have MIPS counterparts with fluxes of at least 0.3 mJy. This is not too surprising since our radio observations were intended to detect the F 0.75 mJy source population. There are 216 such 24 m sources in our survey area. Only 33 5 of these have radio counterparts. Similarly, 23 3 of the compact radio sources have infrared counterparts 0.75 mJy at 24 m. Sensitivity variations will of course introduce a bias against detecting faint radio sources far away from the three pointing centers. However, we do not see a large effect. If we restrict ourselves to regions where the radio rms is less than 17 Jy beam-1, i.e., an area of 0.17 deg2, we find similar detection fractions: 32 7 (25/78) of the F 0.75 mJy sources have radio counterparts, while 19 4 (25/130) of the compact radio sources MIPS counterparts with F 0.75 mJy. This shows that greater 20 cm sensitivities are required to detect the bulk of the infrared sources for which IRS spectra can be obtained in reasonable integration times.
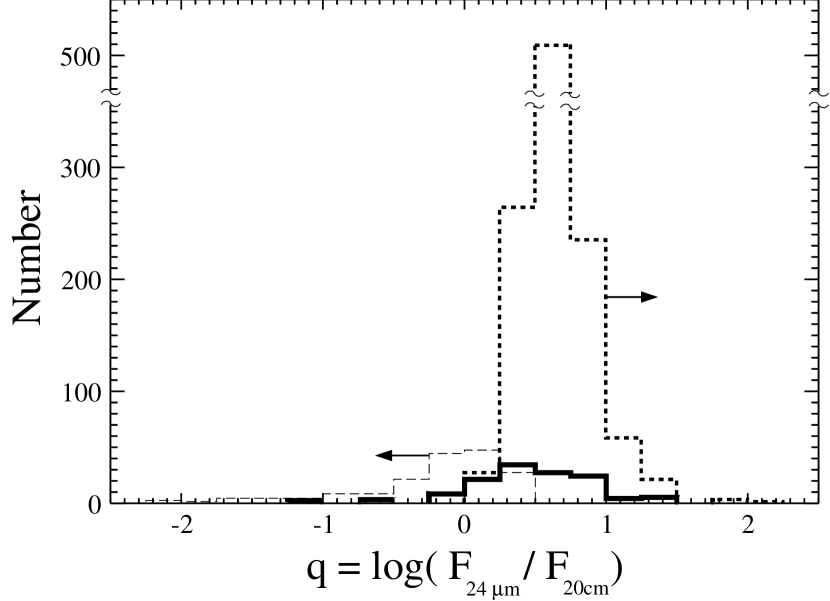
When comparing the radio and infrared populations, it is therefore important to realize that only a relatively small fraction of sources are detected in both bands. This is illustrated in Figure 7, where we show histograms of q for the 125 sources detected at both 24 m and 20 cm (thick solid line), the 194 radio sources not detected at 24 m (thin dashed line), and the 1086 24 m sources with no measured radio fluxes (thick dashed line). For the radio-only sample we calculated q upper-limits using F = 0.3 mJy. For the infrared-only detected sample we calculated lower-limits for q by setting F20cm equal to that of a point source with a peak flux density 5 the radio image rms at the infrared source’s position.
The sources detected at both 24 m and 20 cm show a distribution of q that peaks at 0.5. This is in reasonable agreement with Appleton et al.’s (2004) result that q = 0.8 0.3 for the radio-infrared correlation at z 2. The smaller range of q evident in Figure 7 may be partly due to the detection of z 2 ULIRGS, which will have progressively smaller q with increasing redshift (see the ULIRG track in Figure 5). This is consistent with a population of galaxies powered primarily by star formation, though an AGN contribution is still possible. Radio-loud AGN are certainly apparent in the negative q tail. AGN also clearly dominate the population of radio sources with no MIPS detections in Figure 7. However, the bulk of the infrared sources in the radio survey field have only lower-limits for q, with a strong peak between 0.5 and 1. While this is consistent with star formation being the dominant power source, deeper 20 cm observations will be required to measure q and quantify the radio-infrared correlation for the majority of galaxies in the survey. Figure 7 suggests that the radio and infrared selected populations do not overlap, i.e., that each represents populations of AGN and starburst dominated galaxies, respectively. Higher sensitivity radio and infrared observations will be needed to verify this.
An important related question is whether the OIRSs represent a population significantly different from the radio sources with optical counterparts, whose characteristics (e.g., starburst or AGN dominated) can be determined through optical or near-infrared spectroscopy. There is a qualitative indication that this might be so from the overall difference in the infrared detection rate for radio sources in the OIRS sample compared to the full radio sample. We find that 33 3 of the compact radio sources in the entire sample are detected in the infrared to the 5 sensitivity limit, whereas only 13 7 of the OIRS are detected. Here the uncertainties represent Poisson statistics only. While this suggests a difference in the two radio populations, the small number of sources in the OIRS sample prevents this from being a statistically robust conclusion.
In the portion of the field covered by both Chandra and Spitzer surveys (0.07 deg2), there are 240 24 m sources brighter than 0.3 mJy (see Table 4), and 104 Chandra “soft” band sources brighter than 1.510-16 ergs s-1 cm-2. Only 18 sources are detected in both infrared and X-ray bands, for which IR/X can be determined directly. A comparison of these sources is shown in Figure 8. For the eighteen sources detected in both bands (shaded histogram), nearly all (80) have IR/X 0.2, indicating a relatively unobscured AGN. For sources detected by Chandra but not MIPS, IR/X upper-limits were determined as 0.3 mJy/(F0.5-2.0keV) with the “soft” X-ray flux in units of 10-16 erg s-1 cm-2. For sources detected only at 24 m, we calculated lower-limits to IR/X using F24μm in mJy divided by 1.5. Figure 8 shows a clear separation between the sources detected only by MIPS or Chandra, with the former being identified with starburst or obscured AGN dominated systems and the latter with unobscured AGN. Quantitatively, 90 of the Chandra-only detections have IR/X 0.2. Similarly, 90 of the MIPS-only detections have IR/X 0.2. These results apply to the full sample in the overlapping area, virtually all of which have optical identifications, and indicate that the great majority of X-ray sources are powered by AGN.
5 Discussion
5.1 Space Densities Of The OIRS And OIXS Populations
We of course have no direct measure of the redshifts for the OIRS population. However the requirement that they be optically “invisible” likely forces the majority to be at z 1. Supporting evidence for this comes from IRS spectroscopy of a sample of sixteen optically faint and invisible MIPS sources in Boötes with F24μm 0.75 mJy in Houck et al. (2005). For the ten optically invisible infrared sources, the median spectroscopic redshift was 2.1, with only one object having a redshift less than one, and that at z = 0.7 0.1. We can calculate rough estimates of the OIRS space density by assuming that they lie within certain broad redshift ranges. By comparing these with measured or estimated space densities of other extragalactic objects (see Table 5) we can gain additional clues into their nature. Arguments based on surface density comparisons are subject to various complexities and assumptions (i.e., the OIRS redshift range) that are difficult to take into account. Nevertheless, such an approach is still informative.
The average surface density of the 27 OIRSs with no MIPS detections, sources whose emission is likely to be dominated by an AGN, is = 80 15 deg-2. For our adopted flat CDM cosmology and H0, this corresponds to a mean space density = (2.4 0.5) 10-6 Mpc-3 over a 1 z 5 redshift range. This is much smaller than the space density of current day massive ellipticals ( 10-3 Mpc-3, Marzke et al. 1994), though comparable to that of local radio galaxies ( 10-6 Mpc-3, Osterbrock 1989).
This can also be compared with the space density of bright (MB -26) quasars over 0.4 z 5 shown in Figure 3 of Fan et al. (2001), which combines results from 2dF (Boyle et al. 2000), Warren et al. (1994), and Schmidt et al. (1995), as well as the Sloan Digital Sky Survey. The OIRS space density is considerably larger than that of bright optically selected quasars, even at z 2.5 where the quasar distribution peaks ( 5 10-7 Mpc-3). The discrepancy is much larger at lower and higher redshifts. For example, from z = 3-5 the bright quasar space density drops from 2 10-7 to 1 10-8 Mpc-3, which is smaller than the OIRS space density by one and two orders of magnitude, respectively.
However, the OIRSs are almost certainly less luminous optically than MB = -26. Assuming a power law form for the optical continuum of fν -0.5, the upper limit of 26.5 implies absolute magnitude upper limits of approximately MB = -18 to -23 for z=1-5. These values are less than or equal to MB = -23, the traditional boundary between Seyfert galaxies and quasars. The cumulative luminosity function for optically selected quasars at z 3.6 in Fan et al. (2001) is,
| (2) |
in units of Mpc-3. This equation is strictly valid for MB -25.6, and employing it for intrinsically fainter objects requires that the luminosity function’s slope does not change significantly, which we admit is an assumption. Nevertheless, using Equation 2 to calculate the space density of objects at z = 5 with -23 MB -22 gives a value of = 3 10-6 Mpc-3, which is similar to the mean OIRS space density. For the same range in MB, we derive space densities of 3 10-5 and 1 10-5 Mpc-3 at redshifts of three and four, respectively. At a redshift of two, the 2dF cumulative luminosity function shown in Equation 4 of Fan et al. (2001) gives = 1 10-6 Mpc-3 for MB -25.5. For a range in MB from -25 to -24 the extrapolated space density would be 3 10-6 Mpc-3, which is also similar to the mean for the OIRS population. Thus, within the uncertainties accrued by extrapolating the bright high-z quasar luminosity function to MB-21, we conclude that the averaged space density of OIRSs is consistent with that of lower luminosity AGN with redshifts 2 z 5. Moreover, the distribution of q values for the OIRS population clearly implies a strong radio-loud AGN component.
The average space density of sub-mm galaxies provides another point of comparison. These objects are thought to be the progenitors of massive bulges that are powered primarily by heavily obscured star formation. Taking the sources detected at 850 m by Barger et al. (1999) with fluxes greater than 2.2 mJy and assuming they lie between 1 z 3 would result in a space density of = 7 10-5 Mpc-3. This would be nearly sixteen times larger than the average OIRS space density over the same redshift interval, which we determine to be = (4.1 0.8) 10-6 Mpc-3 if all OIRSs are within this interval. The sub-mm galaxies have a substantially larger space density. The discrepancy becomes even worse if one extrapolates the 850 m source counts to fainter sources in order to account for the diffuse sub-mm background emission, in which case the average space density of sub-mm sources becomes comparable to the space density of present-day elliptical galaxies. Such a large difference in space density suggests that the OIRSs are not the objects that make up the sub-mm source population.
The average surface density of the eleven OIXSs is 157 47 deg-2. While formally 50 larger than that of the OIRS population determined in 4.1, given the uncertainties. In 4.3 we argued that nine out of eleven are likely to have 1 z 5 based on their X-ray hardness ratios. Distributing these uniformly over this redshift range gives an average space density = (3.9 1.3) 10-6 Mpc-3, again comparable to . Thus the conclusions reached above for the OIRS population holds for OIXSs as well: is larger than the space density of local radio galaxies and luminous optically selected 1 z 5 quasars, but consistent with the space density of lower luminosity AGN (MB -23) extrapolated from the quasar luminosity function of Fan et al. (2001). If four of the OIXSs are at z 4-5 as is suggested by the HR values in Table 3 and Figure 6, then the OIXS space density over 1 z 3 can not be larger than (3.3 1.5) 10-6 Mpc-3, which is more than an order of magnitude smaller than the mean space density of Barger et al.’s (1999) F850μm 2.2 mJy sub-mm sources. OIXSs do not appear to be the sources making up the sub-mm galaxy population.
While additional and independent observational evidence is clearly required to place these conclusions on a more solid footing, the estimated space densities of both OIRSs and OIXSs are consistent with lower luminosity AGN hosts (MB -23) at z 1-5, suggesting that we are seeing the fainter end of the high redshift quasar luminosity function.
5.2 Do The Optically Invisible Radio And X-Ray Sources Represent Different Populations Of AGN?
We concluded in 4.2 that the OIRSs are predominately AGN because of their 24 m to 20 cm flux ratios, and we concluded in 4.3 that the OIXSs are likewise primarily AGN because of their low infrared to X-ray flux ratios. It is worth noting that these two independently derived samples of optically invisible AGN do not overlap. In the common radio and X-ray survey region (Table 4) there are 10 OIRSs, none of which are detected in “soft” or “hard” X-ray bands by Wang et al. (2004). Similarly, there are 14 OIXSs within our VLA survey. None of these are detected at 20 cm.
We can ask whether this result is consistent with expectations from previous deep parallel surveys at radio and X-ray wavelengths. The most relevant study is that of Bauer et al. (2003) of the Chandra Deep Field North, which compared radio and X-ray sources at flux levels comparable to our sample. They used a variety of spectroscopic indicators, including optical and X-ray spectra to identify AGN. Their results showed that such AGN covered a wide range of X-ray to radio flux ratio. Specifically, they found (their Figure 1) that AGN could exist with 0.002 FX-ray/F20cm 2.5, where FX-ray is the Chandra full-band flux in units of 10-16 ergs s-1 cm-2 and F20cm is in units of Jy. The upper bound could even exceed 2.5 as this value derives from the upper limit of 40 Jy for the radio sources not detected in X-rays. From this, given that the faintest full-band X-ray flux in Wang et al. (2004)’s survey is 5 10-16 erg s-1 cm-2, an AGN could have a 20 cm flux density as high as 2 mJy and still not be detected in X-rays. Of our OIRS sample, only a source like 362 with F20cm = 6.7 mJy would have been easily detected in X-rays. The OIRSs’ median 20 cm flux density is 400 Jy. For such a source to have a full-band X-ray flux less than 5 10-16 erg s-1 cm-2 would imply FX-ray/F20cm 0.013, which is well within the possible range found by Bauer et al. (2003).
Conversely, the median OIXS has full band X-ray flux of 5 10-15 ergs s-1 cm-2. In order not to be detected in our radio survey, it would have to be fainter than 100 Jy, or have FX-ray/F20cm 0.5, which is also well within the observed range of this ratio. We conclude, therefore, that the lack of overlap between the radio and X-ray samples of optically invisible AGN is consistent with the wide range of FX-ray/F20cm that has been established among AGN.
6 Summary
We have combined a Spitzer/MIPS survey of the NDWFS Boötes field at 24 m with an A-array VLA 20 cm survey of a 0.5 deg2 subregion and a 172 ks Chandra observation to investigate the nature of optically “invisible” radio and X-ray sources. These we define to be compact radio and X-ray sources without visible counterparts in the NDWFS , , & images. It has been proposed that these objects represent populations of high redshift galaxies harboring heavily obscured starbursts or AGN. From the VLA and Chandra surveys we identify 31 OIRSs and 12 OIXSs within the area surveyed by MIPS at 24 m, out of total radio and X-ray source populations of 377 and 168, respectively. Only four of the 31 OIRSs and none of the OIXSs are detected by MIPS at 24 m. We compared the 20 cm and 24 m emission properties of the OIRSs observed with MIPS with those expected from late spiral, ULIRG, Seyfert, and quasar SEDs over a wide redshift range. We conclude that the OIRSs are primarily a population of galaxies powered by AGN rather than dust enshrouded starbursts, and that they likely lie at z 1. Likewise, of the OIXSs with measured “soft” X-ray fluxes, all have 24 m to 0.5-2 keV band flux ratio limits consistent with a dominant and relatively unobscured AGN. The X-ray properties of OIXSs suggest that most are likely at z 1, with several possibly at z 4. Given the wide range in X-ray and radio properties of AGN, the fact that the OIRSs and OIXSs have no object in common does not rule out their being from the same AGN source population.
Assuming the OIRSs populate the redshift range 1 z 5, their average space density is (2.4 0.5) 10-6 Mpc-3. This is consistent with the space densities derived using the cumulative quasar luminosity function from Fan et al. (2001) over the redshift range z = 2-5 for -23 MB -22, i.e., AGN with blue luminosities comparable to current epoch Seyfert galaxies. The space density of 850 m sources is much larger than this, suggesting that they are a fundamentally different class of object. Similarly, the OIXSs have an average space density of (3.8 1.2) 10-6 Mpc-3 if they exist uniformly throughout the redshift range 1 z 5, which is similar to the OIRSs’. This is also consistent with the space density of lower luminosity AGN extrapolated from Fan et al. (2001) for this redshift range.
References
- (1) Appleton, P. et al. 2004, ApJS, 154, 147
- Baars (1977) Baars, J. W., Genzel, R., Pauliny-Toth, I., & Witzel, A. 1977, A&A, 61, 99
- barger (03) Barger, A., Cowie, L., Capak, P., Alexander, D., Bauer, F., Fernandez, E., Brandt, W., Garmire, G., & Hornschemeier, A. 2003, AJ, 126, 632
- (4) Bauer, F., Alexander, D., Brandt, W., Hornschemeier, A., Vignali, C., Garmire, G., & Schneider, D. 2003, AJ, 126, 632
- (5) Becker, R., White, R., & Helfand, D. 1995, ApJ, 450, 559
- (6) Bell, E. F. 2003, ApJ, 586, 794
- Bertin & Arnouts (1996) Bertin, E. & Arnouts, S. 1996, A&AS, 117, 393
- Boyle (2000) Boyle, B. J., Shanks, T., Croom, S. M., Smith, R. J., Miller, L., Loaring, B., & Heymans, C. 2000, MNRAS, in press (astro-ph/0005368)
- Chary & Elbaz (2001) Chary, R., & Elbaz, D. 2001, ApJ, 556, 562
- devries (02) de Vries, W. H., Morganti, R., Röttgering, H. J., Vermeulen, R., van Breugel, W., Rengelink, R., & Jarvis, M. J. 2002, AJ, 123, 1784
- Fan (2001) Fan, X. et al. 2001, AJ, 121, 54
- foamalot (02) Fomalont, E., Kellermann, K., Partridge, R., & Richards, E. 2002 AJ, 123, 2402
- Haarsma et al. (2001) Haarsma, D. B., Partridge, R. B., Windhorst, R. A., & Richards,E. A. 2001, astro-ph 0007315
- (14) Helou, G., Soifer, B. T., & Rowan-Robinson, M. 1985, ApJ, 298, L7
- (15) Higdon, S. J. U., Weedman, D. W., Higdon, J. L., Herter, T. L., Charmandaris, V., Houck, J. R., Hao, L., Brandl, B., Armus, L., & Soifer, B. T. 2004, ApJS, 154, 178
- hopkins (99) Hopkins, A., Alfonso, J., Cram, L., & Mobasher, B. 1999, ApJ, 519, L59
- houck (04) Houck, J. R. et al. 2004, ApJ, 154, L18
- (18) Houck, J. R., Soifer, B. T., Weedman, D., Higdon, S. J. U., Higdon, J. L., Brown, M., Dey, A., Jannuzi, B., Le Floc’h, E., Rieke, M., Armus, L., Charmandaris, V., Brandle, B., & Teplitz, H. 2005, ApJ, in press
- buell (99) Jannuzi, B. & Dey, A. 1999, ASP Conference Series Vol. 191, (R. Weymann, L. Storrie-Lombardi, M. Sawicki, & R. Brunner, eds.), p. 111
- (20) de Jong, T., Klein, U., Wielbinski, R., & Wunderlich, E. 1985, A&A, 147, L6
- (21) Lagache, G., Dole, H., & Puget, J. 2003, MNRAS, 338, 555
- (22) Papovich, C., Dole, H., Egami, E., Le Floc’h, Perez-Gonzalez, P., Gai, L., Beichman, C., Blaylock, M., Engelbracht, C., Gordon, K., Hines, D., Misselt, K., Morrison, J., Mould, J., Muzerolle, J., Neugebauer, G., Richards, P., Rieke, G., Rieke, M., Rigby, J., Su, K., & Young, E. 2004, ApJS, 154, 70
- (23) Rhoads, J. et al. 2000, ApJ, 545, L85
- Richards et al. (2000) Richards, E. A., Fomalont, E. B., Kellermann, K. I., Windhorst, R. A., Partridge, R. B., Cowie, L. L., & Barger, A.J. 1999, ApJ, 526, L73
- rieke (04) Rieke, G. H. et al. 2004, ApJ, 154, L25
- schneider (94) Schneider, D. P., Schmidt, M., & Gunn, J. E. 1991, AJ, 101, 2004
- wang (2004) Wang, J. X., Malhotra, S., Rhoads, J., Brown, M., Dey, A., Heckman, T., Jannuzi, B., Norman, C., Tiede, G., & Tozzi, P. 2004, AJ, 127, 213
- warren (94) Warren, S. J., Hewett, P., & Osmer, P. S. 1994, ApJ, 421, 412
- Weedman et al. (2004) Weedman, D., Charmandaris, V., & Zezas, A. 2004, ApJ, 600, 106
- werner (04) Werner, M. W. et al. 2004, ApJ, 154, L1
- Xu et al. (2001) Xu, C., Lonsdale, C. J., Shupe, D. L., O’Linger, J., & Masci, F. 2001, ApJ, 562, 179
- yun (01) Yun, M., Reddy, N., & Condon, J. 2001, ApJ, 554, 803
| Observing Dates: | 26, 27 June 27 July 2003 | ||
|---|---|---|---|
| Array Configuration: | A | ||
| Min./Max. Baseline (km): | 0.68/36.4 | ||
| Number of Antennas: | 27 | ||
| Primary Beam FWHM (arcmin): | 31.5 | ||
| IF Frequencies (GHz): | 1.3649 1.4351 | ||
| Number of Channels per IF: | 7 | ||
| Channel Separation (MHz): | 3.125 | ||
| Effective Bandwidth (MHz): | 43.750 | ||
| Phase Gain Calibrator: | 1416+347 | ||
| Flux Bandpass Calibrator: | 3C 48 | ||
| Synthesized Beam FWHM (arcsec):aaRobust weighting. | 1.4 | ||
| Field Centers | North | East | South |
| R.A. (J2000): | 14:25:57.00 | 14:27:27.00 | 14:25:57.00 |
| Dec. (J2000): | 35:32:00.0 | 35:17:12.0 | 35:02:24.0 |
| Time on Source (hrs): | 5.5 | 4.9 | 5.4 |
| Map r.m.s. (Jy/beam): | 14.8 | 15.5 | 15.6 |
| Radio | Source | F20cm(a)(a)Integrated 20 cm flux in Jy. | F | a b | F24μm(b)(b)Integrated 24 m fluxes (or non-detection) at radio source position. | q(c)(c) q = log(F24μm/F20cm). | (d)(d), , & limits (5 ) calculated in 2″ diameter apertures centered on the OIRS positions. See 4.1. | (d)(d), , & limits (5 ) calculated in 2″ diameter apertures centered on the OIRS positions. See 4.1. | (d)(d), , & limits (5 ) calculated in 2″ diameter apertures centered on the OIRS positions. See 4.1. | |
|---|---|---|---|---|---|---|---|---|---|---|
| ID# | (Jy) | (Jy) | (arcsec) | (deg.) | (Jy) | |||||
| 9 | J142822.75+351849.8 | 511 62 | 128 | 3.5 2.7 | 70 | -0.26 | 27.2 | 25.3 | 25.1 | |
| 19 | J142813.97+351136.6 | 565 36 | 378 | 1.9 1.5 | 126 | -0.30 | 27.1 | 25.2 | 24.5 | |
| 22 | J142810.60+350659.2 | 308 42 | 125 | 1.7 1.5 | 128 | -0.04 | 26.9 | 24.9 | 24.3 | |
| 49 | J142744.94+352616.5 | 565 32 | 378 | 1.9 1.5 | 126 | -0.30 | 27.2 | 25.3 | 25.0 | |
| 52 | J142740.39+350117.5 | 240 38 | 148 | 2.2 1.4 | 137 | 0.07 | 26.9 | 25.3 | 24.2 | |
| 79 | J142713.75+352134.5 | 948 37 | 602 | 2.1 1.5 | 137 | -0.53 | 26.8 | 25.2 | 25.3 | |
| 92 | J142702.54+351215.2 | 239 34 | 210 | 1.5 1.4 | 49 | 0.07 | 27.1 | 25.6 | 24.7 | |
| 97 | J142701.06+351949.3 | 396 32 | 271 | 1.7 1.6 | 69 | 234 44 | -0.24 0.21 | 27.2 | 25.8 | 25.2 |
| 110 | J142652.98+353351.1 | 177 30 | 162 | 1.8 1.3 | 129 | 0.20 | 27.1 | 26.1 | 25.5 | |
| 114 | J142650.00+350711.0 | 372 47 | 164 | 2.4 1.8 | 40 | -0.12 | 26.8 | 25.5 | 25.0 | |
| 156 | J142632.14+353614.2 | 799 59 | 262 | 2.9 2.0 | 164 | -0.46 | 27.0 | 26.0 | 25.4 | |
| 176 | J142624.94+350614.6 | 249 35 | 171 | 1.9 1.5 | 14 | 462 44 | 0.27 0.17 | 27.0 | 25.5 | 24.7 |
| 182 | J142623.40+345821.1 | 554 39 | 352 | 2.1 1.6 | 100 | -0.30 | 27.0 | 25.7 | 24.7 | |
| 185 | J142621.92+353114.7 | 327 35 | 230 | 1.6 1.6 | 131 | -0.07 | 27.0 | 26.0 | 25.2 | |
| 208 | J142613.81+353154.4 | 189 33 | 145 | 1.6 1.5 | 76 | 0.17 | 27.0 | 26.0 | 25.3 | |
| 209 | J142613.53+352810.9 | 165 31 | 77 | 2.0 1.4 | 12 | 0.23 | 27.0 | 25.9 | 25.3 | |
| 232 | J142605.13+350604.2 | 512 18 | 404 | 1.6 1.5 | 88 | -0.26 | 26.9 | 25.1 | 24.7 | |
| 245 | J142602.35+350907.9 | 244 29 | 230 | 1.6 1.3 | 2 | 440 52 | 0.26 0.17 | 26.9 | 25.2 | 24.8 |
| 278 | J142551.58+351543.2 | 445 70 | 118 | 2.6 2.3 | 178 | -0.20 | 27.1 | 25.8 | 25.6 | |
| 282 | J142550.49+352935.4 | 155 30 | 77 | 2.3 1.5 | 19 | 0.26 | 27.2 | 26.0 | 25.3 | |
| 305 | J142544.84+351702.2 | 777 83 | 165 | 3.4 2.6 | 77 | -0.44 | 26.9 | 26.2 | 25.2 | |
| 313 | J142543.00+353049.2 | 1165 71 | 296 | 3.0 2.6 | 11 | -0.62 | 27.1 | 25.8 | 25.2 | |
| 323 | J142537.12+345229.2 | 181 35 | 126 | 1.7 1.3 | 20 | 0.19 | 27.1 | 25.5 | 25.0 | |
| 346 | J142528.98+352824.8 | 367 36 | 205 | 2.0 1.7 | 21 | -0.12 | 27.0 | 26.1 | 25.4 | |
| 349 | J142527.24+352649.7 | 241 47 | 108 | 2.5 1.7 | 80 | 0.07 | 27.1 | 25.9 | 25.1 | |
| 362 | J142525.04+344913.2 | 6738 69 | 1806 | 3.0 2.3 | 44 | -1.38 | 27.0 | 25.8 | 24.9 | |
| 363 | J142524.84+352554.1 | 145 38 | 90 | 2.1 1.5 | 38 | 328 52 | 0.35 0.31 | 27.2 | 25.9 | 25.3 |
| 375 | J142519.91+352417.8 | 847 50 | 346 | 2.5 1.9 | 42 | -0.48 | 26.9 | 26.0 | 25.4 | |
| 380 | J142516.19+350248.1 | 1906 40 | 1070 | 2.0 1.7 | 79 | -3.83 | 26.9 | 25.5 | 24.9 | |
| 388 | J142508.28+353901.9 | 180 34 | 111 | 2.3 1.3 | 56 | 0.19 | 27.1 | 26.0 | 25.3 | |
| 389 | J142507.78+354210.4 | 302 21 | 164 | 2.1 1.7 | 116 | (e)(e)These OIRSs are outside the MIPS 24 m survey area. | 26.9 | 26.1 | 25.3 | |
| 393 | J142506.41+353813.4 | 171 14 | 112 | 2.2 1.4 | 125 | (e)(e)These OIRSs are outside the MIPS 24 m survey area. | 27.0 | 25.8 | 25.2 | |
| 410 | J142457.20+351620.5 | 875 75 | 307 | 2.9 1.9 | 151 | -0.49 | 27.0 | 25.8 | 25.3 | |
| 430 | J142445.36+353417.1 | 1410 62 | 423 | 3.3 1.9 | 102 | (e)(e)These OIRSs are outside the MIPS 24 m survey area. | 27.0 | 25.9 | 25.2 | |
| 434 | J142444.01+351227.1 | 588 47 | 262 | 3.1 1.4 | 75 | (e)(e)These OIRSs are outside the MIPS 24 m survey area. | 27.0 | 25.5 | 24.7 | |
| 441 | J142435.59+351046.2 | 1486 59 | 484 | 2.7 2.2 | 11 | (e)(e)These OIRSs are outside the MIPS 24 m survey area. | 26.5 | 25.1 | 24.4 |
| X-Ray(a)(a)X-ray source number from Table 1 in Wang et al. (2004). | Source | F0.5-2keV(b)(b)Integrated “Soft” (0.5-2.0 keV) band flux in units of 10-16 erg s-1 cm-2 from Wang et al. (2004). | HR(c)(c)X-ray “hardness” radio from Wang et al. (2004). HR = (H - S)/(H + S), where H and S are the “hard” (2-7 keV) and “soft” (0.5-2 keV) band counts. | IR/X(d)(d)The 24 m to soft X-ray flux radio, in units of mJy/(10-16 erg s-1 cm-2). | (e)(e), , & limits (5 ) calculated in 2″ diameter apertures centered on the OIXS positions as in 4.1. | (e)(e), , & limits (5 ) calculated in 2″ diameter apertures centered on the OIXS positions as in 4.1. | (e)(e), , & limits (5 ) calculated in 2″ diameter apertures centered on the OIXS positions as in 4.1. |
|---|---|---|---|---|---|---|---|
| ID # | |||||||
| 9 | J142539.55+353357.9 | 6.9 | -0.43 | 0.04 | 26.8 | 25.9 | 25.3 |
| 15 | J142530.71+353911.3 | 11.9 | 0.12 | 0.03 | 27.1 | 25.8 | 25.4 |
| 31 | J142555.40+353650.4 | 3.3 | -0.56 | 0.08 | 26.9 | 25.8 | 25.3 |
| 51 | J142546.33+353349.4 | 1.5(f)(f)OIXSs 51, 69, 103 120 were only detected in the Chandra “hard” or “total” bands, and not the 0.5-2 keV “soft” band. Their positional accuracies are all 1″. | 0.56 | 27.0 | 26.0 | 25.3 | |
| 69 | J142531.17+353921.6 | 1.5(f)(f)OIXSs 51, 69, 103 120 were only detected in the Chandra “hard” or “total” bands, and not the 0.5-2 keV “soft” band. Their positional accuracies are all 1″. | 0.73 | 26.9 | 26.2 | 25.3 | |
| 70 | J142530.63+353420.3 | 9.4 | -0.42 | 0.03 | 27.0 | 25.9 | 25.3 |
| 73 | J142526.68+353140.8 | 7.0 | -0.13 | 0.04 | 27.0 | 26.0 | 25.3 |
| 96 | J142558.13+353216.1 | 3.8 | -0.33 | 0.08 | 26.9 | 25.8 | 25.3 |
| 103 | J142544.20+354018.4 | 1.5(f)(f)OIXSs 51, 69, 103 120 were only detected in the Chandra “hard” or “total” bands, and not the 0.5-2 keV “soft” band. Their positional accuracies are all 1″. | 0.86 | 26.9 | 25.9 | 25.4 | |
| 112 | J142527.59+354012.1 | 3.2 | 0.10 | 0.09 | 27.1 | 25.8 | 25.2 |
| 120 | J142522.40+353517.2 | 1.5(f)(f)OIXSs 51, 69, 103 120 were only detected in the Chandra “hard” or “total” bands, and not the 0.5-2 keV “soft” band. Their positional accuracies are all 1″. | 0.40 | 26.9 | 25.8 | 25.2 |
| Radio Survey | Total Number | (a)(a)Average surface density in deg-2. | MIPS(b)(b)Percent of sources detected at 24 m by MIPS. | Radio(c)(c)Percent of sources detected at 20 cm. | |
|---|---|---|---|---|---|
| MIPS Sources ( 0.3 mJy) | 1405 | 2810 75 | 9 | ||
| Compact Radio Sources | 377 | 754 39 | 33 | ||
| OIRSs | 36 | 104 17(d)(d)Surface density for all 36 OIRSs, including those outside the MIPS survey area. | 13(e)(e)Percentage of the 31 OIRSs observed by MIPS that were detected at 24 m. | ||
| X-Ray Survey | Total Number | (a)(a)Average surface density in deg-2. | MIPS | Radio | X-ray(f)(f)Percent of sources detected in Chandra 0.5-2.0 keV band by Wang et al. (2004). |
| X-Ray Sources | 104(g)(g)Number of X-ray sources observed by MIPS at 24 m. | 1486 146 | 17 | 11 | |
| MIPS Sources ( 0.3 mJy) | 240 | 3429 221 | 11 | 8 | |
| Compact Radio Sources | 73 | 1043 123 | 36 | 14 | |
| OIXSs | 11 | 157 47 | 0 | 0 | |
| OIRSs | 8 | 114 40 | 13 | 0 | |
| Objects | Redshift | Notes | |
|---|---|---|---|
| (10-6 Mpc3) | |||
| OIRS | 3.1 0.5 | 1 z 5 | Calculated using all 36 OIRSs in the VLA survey. |
| 2.4 0.5 | 1 z 5 | Calculated using the 27 OIRSs not detected by MIPS. | |
| 4.1 0.8 | 1 z 3 | ||
| OIXS | 4.7 1.4 | 1 z 5 | Calculated using all 11 OIXSs in Chandra survey. |
| 3.9 1.3 | 1 z 5 | Calculated using the 9 OIXSs with HR 0.6. | |
| 3.3 1.5 | 1 z 3 | Calculated using the 5 OIXSs with -0.5 HR 0.6. | |
| Ellipticals | 103 | 0 | Local massive ellipticals (Marzke et al. 1994). |
| Radio Galaxies | 1 | 0 | Local radio galaxies (Osterbrock 1989). |
| Sub-mm Sources | 70 | 1 z 3 | F850μm 2.2 mJy (Barger et al. 1999). |
| Bright QSOs | 0.01 | z = 1 | MB -26 QSOs. From Figure 3 in Fan et al. (2001). |
| 0.5-0.01 | 2 z 5 | MB -26 QSOs. From Figure 3 in Fan et al. (2001). | |
| Faint QSOs | 30-3 | 3 z 5 | -23 MB -22 QSOs. Extrapolated from Fan et al. (2001). |