Extreme X-ray Behavior of the Low-Luminosity Active Nucleus in NGC 4395
Abstract
We present the results of a 17 ks Chandra ACIS-S observation of the nearby dwarf spiral galaxy NGC 4395. Chandra affords the first high-quality, broadband X-ray detection of the active nucleus of this object that is uncontaminated by nearby sources in the field. We find the nuclear X-ray source to be unresolved and confirm the rapid, large-amplitude variability reported in previous studies. The light curve appears to show cycles of a quasi-periodic oscillation with a period of s. If associated with an orbital feature near the innermost stable orbit of the accretion disk, this period would constrain the black-hole mass to be . The X-ray spectrum indicates absorption by an ionized medium, and the spectral shape appears to vary over the course of our observation. Contrary to prior reports, however, the spectral variations are uncorrelated with changes in the hard X-ray flux. It is possible that the short-term spectral variability we observe results from column density fluctuations in the ionized absorber. A power-law fit to the spectrum above 1 keV yields a photon index of , much flatter than that typically observed in the spectra of Seyfert 1 galaxies. We have ruled out photon pile-up as the cause of the flat spectrum. Even when complex spectral features are considered, the photon index is constrained to be (90% confidence). Comparing our results with previous determinations of the photon index ( and 1.72), we conclude that the slope of the primary continuum varies significantly on time scales of a year or less. The extreme flatness and dramatic long-term variability of the X-ray spectrum are unprecedented among active galactic nuclei.
1 Introduction
The optical/ultraviolet spectrum of the nucleus of NGC 4395, a nearby dwarf spiral galaxy, exhibits many of the features that characterize the spectra of luminous type 1 Seyfert galaxies and quasars (Filippenko & Sargent 1989; Filippenko, Ho, & Sargent 1993). In addition to a featureless continuum and strong forbidden emission lines, some of which indicate a very high degree of ionization, NGC 4395 displays broad permitted emission lines with velocity widths of several thousand km s-1. Additional evidence from across the electromagnetic spectrum (Moran et al. 1999; Lira et al. 1999; Kraemer et al. 1999; Iwasawa et al. 2000; Wrobel, Fassnacht, & Ho 2001) supports the hypothesis that NGC 4395 is powered by accretion onto a black hole, similar to other active galactic nuclei (AGNs).
In a number of respects, however, the AGN in NGC 4395 is a prominent outlier. Most notably, with an absolute magnitude of and an H luminosity of a few times erg s-1, it is the optically least luminous broad-line AGN currently known. Based on stellar velocity dispersion measurements and other arguments (Filippenko & Ho 2003), the mass of the black hole in NGC 4395 is constrained to be at most , and it is likely to be in the range — significantly lower than the measured masses of black holes in the nuclei of other galaxies, both active and quiescent. Consistent with its low black-hole mass, the AGN in NGC 4395 is located in a bulgeless dwarf galaxy; in contrast, other galaxies known to contain nuclear black holes are more massive and have well-developed bulges (e.g., Kormendy 2001). NGC 4395 displays some exceptional emission characteristics as well. For example, it is one of the most X-ray–variable active galaxies known (Iwasawa et al. 2000), and its radio–to–X-ray spectral energy distribution differs markedly from those of other types of AGNs (Moran et al. 1999), perhaps indicating that there is something special about the mode of accretion in NGC 4395. X-ray emission is directly linked to the accretion processes in AGNs, and in this paper, we present the results of a high spatial resolution, broadband Chandra observation of the central X-ray source in NGC 4395. The data provide new insights into the nuclear activity in this unusual object. We adopt a distance of 4.1 Mpc for NGC 4395 (Thim et al. 2004).
2 The Chandra Observation
NGC 4395 has been the target of pointed X-ray observations in the 0.1–2.4 keV band with ROSAT (Moran et al. 1999; Lira et al. 1999) and twice in the 0.6–10 keV band with ASCA (Iwasawa et al. 2000; Shih, Iwasawa, & Fabian 2003). However, because of the modest spectral coverage and collecting area of ROSAT and the poor angular resolution of ASCA, a complete picture of the high-energy properties of NGC 4395 is lacking. Chandra provides the first broadband, high-resolution X-ray view of this object.
NGC 4395 was observed with Chandra on 20 June 2000 (UT) for 17,187 s with the ACIS-S instrument. The S3 chip was the only active CCD during the exposure; a 1/2 subarray was read out to reduce the possibility of photon pile-up, which yielded a frame time of 1.54 s. The nucleus of the galaxy was located at the instrument aim point. We reprocessed the data with the CIAO software, version 2.1.2, in order to remove the 025 pixel randomization introduced during the standard processing of the data. The screened data consist of events with grades 0, 2, 3, 4, and 6; no background flares occurred during the observation. In the following sections, we describe the X-ray imaging, variability, and spectroscopy results obtained with Chandra.
3 X-ray Imaging
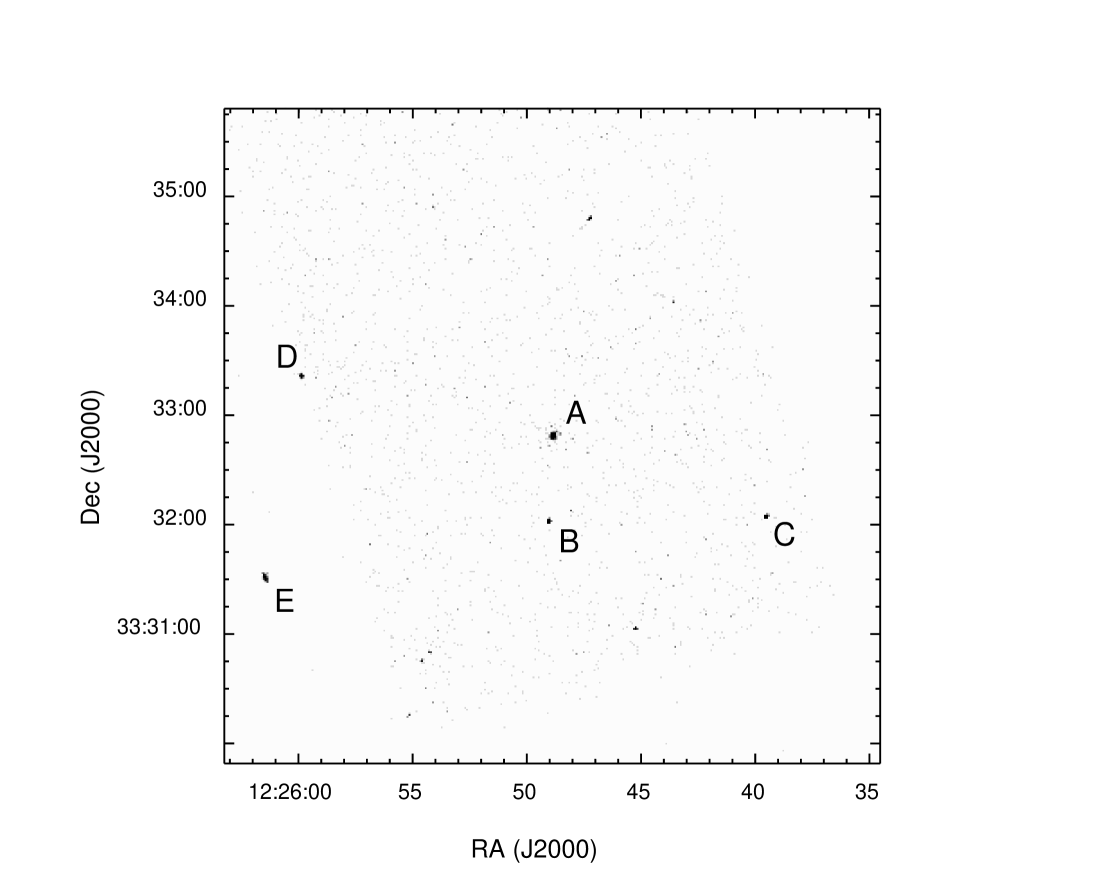
The ROSAT PSPC image of NGC 4395 revealed that there are at least five X-ray sources (labeled A–E by Moran et al. 1999) within 28 of the galaxy center, one of which (source E) is significantly brighter than the nucleus (source A) at low X-ray energies. Thus, in the images obtained with ASCA (half-power diameter ), the nuclear source was significantly contaminated by emission from the other nearby sources, particularly below 2 keV (Iwasawa et al. 2000). As Figure 1 illustrates, the nucleus of NGC 4395 is completely isolated in the resolution Chandra image.111As a result of the subarray employed in our 17 ks exposure, source E, the strongest source of soft X-rays in the vicinity of the nucleus, was located outside the field of view. It was, however, included within the field of a short 1260 s ACIS-S observation of NGC 4395 (see Ho et al. 2001), which we have collected from the Chandra data archive. Figure 1 is a superposition of the two datasets; the true strength of source E is therefore not represented in the figure. The high angular resolution of Chandra also allows us to measure the position and spatial extent of the nuclear X-ray emission in NGC 4395 with unprecedented accuracy. The centroid of the nuclear source is at (2000) = 84, (2000) = , just 04 from the measured position of the VLBA radio source (Wrobel et al. 2001) that is coincident with the optical nucleus. The X-ray source offset is well within the 15 Chandra position uncertainty, which should lay to rest any lingering doubt about the association between the central X-ray emission and the nucleus of NGC 4395. The radial profile of the nuclear X-ray source indicates that it is unresolved; the fractional encircled energy within a radius is about 97%. There is no evidence for diffuse emission in the vicinity of the nucleus.
A radius aperture was used to extract light curves and the spectrum of the nucleus. The background was measured in a concentric annulus with inner and outer radii of and , respectively, which lies between the nucleus and the nearest off-nuclear source (source B in Fig. 1). Just 17 counts in the source aperture (0.7% of the total present) are expected to be background. A net total of 2374 source counts was detected for the nucleus in the 0.3–10.0 keV energy range. Note that this is a factor of 20 greater than the number of counts detected in the ROSAT PSPC exposure of NGC 4395 (Moran et al. 1999), which had almost exactly the same duration.
4 X-ray Variability
Previous X-ray observations of NGC 4395 have established the variable nature of its nucleus. In the ROSAT band, the nuclear source varied by a factor of three over the several days spanning the PSPC observation (Moran et al. 1999; cf. Lira et al. 1999). Rapid variability (with doubling times on the order of 100 s) was witnessed during the ASCA observation at energies greater than 2 keV, where the nucleus was more clearly isolated from other sources in the field (Iwasawa et al. 2000). The absence of contamination in the Chandra data over the 0.3–10 keV range affords a new look at the variability properties of NGC 4395. In addition, the light curve derived from them is continuous, unlike the light curves produced from the ROSAT and ASCA observations.
4.1 The Chandra Light Curve
The full-band light curve of the nucleus of NGC 4395 is displayed in Figure 2. A time bin size of 77 s (= 50 frame times), which yields an average of 10 counts per bin, has been employed. As the figure indicates, the source was highly variable during the 17 ks Chandra observation; the count rate fluctuated by an order of magnitude during the exposure, with dramatic changes (factors of 2–3) occurring over very short periods. Several of the strong flares and dips in the light curve [e.g., the flickering in the s range] appear to be temporally resolved at this binning. There are, however, a few instances (most notably in the –9000 s range) where the count rate increased and then decreased (or vice versa) by a factor of over the span of a single 77 s bin. This time scale constrains the size of the emitting region to be less than 77 light-seconds ( cm), under the assumption that the observed fluctuations are associated entirely with changes in the intensity of the source.
4.2 Spectral Dependence of the X-ray Variability
Both ASCA observations of NGC 4395 seemed to indicate an excess of soft X-ray emission during periods when the 2–10 keV count rate was high (Iwasawa et al. 2000; Shih et al. 2003). We have examined the Chandra data for a similar trend. As a first step, we have constructed light curves in different energy bands: hard (2–10 keV; “H”), medium (1–2 keV; “M”), and soft (0.3–1.2 keV; “S”). As shown in the top two panels of Figure 3, the hard-band and full-band light curves are very similar, both in terms of the features present and the total intensity. Thus, most of the detected source counts have energies above 2 keV. However, the light curves in the medium and soft energy bands (third and fourth panels of Fig. 3) provide important additional information about the variability properties of NGC 4395. While the count rates in all three bands are elevated in the –9000 s range, there are also clear differences between the H, M, and S light curves. Of particular interest are the dip in the 2–10 keV count rate at s, which is absent in the soft and medium energy bands, and the strong increase in the soft-band count rate at 11,500 s, which is not apparent above 2 keV. These differences result in significant spikes in the X-ray “colors” of the source (i.e., the S/H and M/H count-rate ratios), which are shown in the bottom two panels of Figure 3. Sharp color variations are evident at other times as well, but in general they do not appear to correspond directly with changes in the 2–10 keV count rate.
We have investigated the issue further, since any dependence of the spectral properties on count rate would require us to model the source’s high-state and low-state spectra separately. Unfortunately, given the degree of structure in the light curve shown in Figure 2, it is difficult to divide the data into temporally distinct active and quiescent phases, as Iwasawa et al. (2000) did for the ASCA observation. However, the source was clearly more active at certain times during the Chandra exposure than at others; we therefore extracted an “active” spectrum using data in the –10,400 s window and a “quiescent” spectrum using data in the –2400, 5000–6000, and 12,000–16,800 s windows. These spectra contain 28% and 20% of the total counts, respectively. As an alternative approach, we have derived the distribution of count rates in the light curve, which is displayed in Figure 4. Based on this histogram, we have compiled high-state and low-state spectra of the source by collecting counts in periods represented by the highest 6 bins ( count s-1) and the lowest 5 bins ( count s-1) separately. These spectra contain % and 40% of the detected counts, respectively.
In Figure 5 we have plotted the ratio of the high-state and low-state spectra derived using the two methods described above. Despite the flux difference of a factor of between the two spectra in each case, spectral variations are only marginally significant. This is contrary to the ASCA results reported by Iwasawa et al. (2000) and Shih et al. (2003). We note that the shape of the spectral ratio shown in Figure 5, derived using the count-rate histogram in Figure 4, does bear some resemblance to a similar plot presented by Iwasawa et al. (2000). However, the 1–2 keV excess we observe relative to the 4–10 keV ratio (%) is far less than the factor of excess indicated in the ASCA data. For the purposes of modeling the ACIS-S spectrum, we have no evidence that the spectrum changes significantly in direct response to count-rate fluctuations. Therefore, the spectral analysis we present in § 5 involves the spectrum derived from the full Chandra data set.
4.3 Quasi-Periodic Oscillations
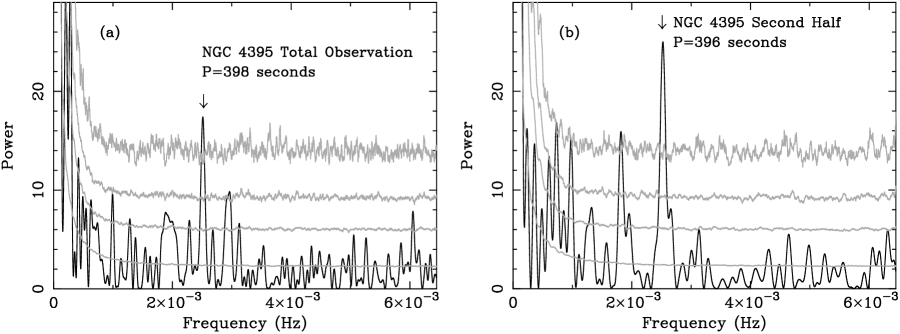
Some of the spikes in NGC 4395’s light curve that follow the increase in the average count rate at s (see Fig. 2) appear to be evenly spaced, which has prompted us to search for evidence of periodic variations in the Chandra data. As Figure 6 indicates, a periodogram for the full ACIS-S observation shows a clear peak corresponding to a period of 398 s. Since the structure associated with this signal seems to be present in only a portion of the light curve, we have also constructed a periodogram for the second half of the observation (Fig. 6). The peak in this periodogram, now at a period of 396 s, is significantly stronger. We note that a similar feature is not present in a periodogram of the first half of the observation, which suggests that the period is both real (i.e., not an instrumental effect) and transient. The 396 s peak in Figure 6 meets all the qualitative criteria discussed by Halpern, Leighly, & Marshall (2003) for a plausible candidate period: (1) it is strong and narrow, (2) it stands out clearly from surrounding points in the periodogram, and (3) the number of cycles in the light curve associated with the period — at least 11 — is sufficiently large.
We have adopted the methods of Halpern et al. (2003) to determine the statistical significance of the periodic signal indicated in Figure 6; full details of the approach are described in that paper. Essentially, we simulate light curves using the sampling time, count rate, and variance of the observed light curve and compare their periodograms to the one obtained from the data. Our analysis assumes that the power spectrum of the observed light curve consists of a power-law component plus a contribution from Poisson noise. Simulated light curves for the power-law component were constructed using the method of Timmer & König (1995), in which the Fourier phases and amplitudes of the power spectrum are randomized prior to generation of the time series via an inverse fast Fourier transform. These light curves were 26 times as long as the observation; sections equal in length to the Chandra observation were extracted at random starting points in each. We also generated Poisson-noise light curves appropriate for the average count rate of the observation (10.5 counts in each 77 s bin). Total simulated power spectra were then produced by combining individual power spectra for the two components; the results were rebinned logarithmically according to the method of Papadakis & Lawrence (1993).
Two sets of simulations are needed to establish the statistical significance of features in the periodograms. The first involves a Monte Carlo determination of the intrinsic shape of the observed light curve’s power spectrum. For different combinations of the slope and normalization of the power spectrum’s power-law component, we simulated 1000 light curves and compared their mean and standard deviation to the observed power spectrum using . In principle, the minimum value of should indicate the best estimates of the slope and normalization. However, because of the limited duration of the NGC 4395 observation and the modest count rate of the source, the power spectrum is dominated by Poisson noise at frequencies greater than Hz, where the candidate periodicity is found. Thus, the values of the parameters that characterize the power-law component have little bearing on our results. Our analysis suggests that values of 1.7 for the slope and 0.0026 for the normalization are suitable choices, which we have adopted for the second set of simulations.
Using this prescription for the power spectrum, we simulated 10,000 light curves and computed their periodograms to establish the 68%, 95%, 99%, and 99.9% confidence levels plotted in Figure 6. The confidence levels reflect the fractions of the simulated light curves that had less power than the amounts indicated at each frequency. Following Benlloch et al. (2001), we have computed the local single-trial probability of obtaining the peaks in Figure 6 by chance: for the 398 s peak in Figure 6, and for the 396 s peak in Figure 6. The “global significance” (e.g., Benlloch et al. 2001), which indicates the probability that a significant feature could be found at any of the frequencies probed by the light curve, is estimated by multiplying the local single-trial probability by the number of independent frequencies in the periodogram. For our 222-point light curve, there are 111 independent frequencies. Thus, the global significance of the period indicated in Figure 6 is 97.6%. The global significance of the peak in Figure 6 (55 independent frequencies) is 99.95%. The actual global significance may be somewhat lower, for two reasons. First, in this analysis, we have oversampled the periodograms in order to search for periodicity at frequencies that are not equal to the Fourier frequencies. The peak in the periodogram for the second half of the observation, it turns out, falls almost exactly midway between two Fourier frequencies. Analyzing the light curve only at the Fourier frequencies, we obtain a global significance of 97.6% for this peak. Second, it has been suggested that uncertainty in the continuum model for the power spectrum (in this case, the Poisson noise level) can also decrease the significance of peaks in the power (Vaughan 2004). In combination, the inclusion of this uncertainty and removal of the effects of oversampling could reduce the significance of the peak to the 95% confidence level (S. Vaughan 2004, private communication). Even at the lower significance levels, however, this remains one the best candidates to date for quasi-periodic oscillations in an AGN X-ray light curve.
5 X-ray Spectral Analysis
X-ray spectroscopy provides vital clues about the emission and absorption components present in the nucleus of NGC 4395, as well as its intrinsic luminosity. Interesting spectral properties of this source have already been revealed in previous X-ray observations. For example, even though the signal-to-noise ratio () of the ROSAT PSPC spectrum was poor, we were unable to obtain a good fit using a power-law model with absorption by a Galactic column of neutral material (Moran et al. 1999), which in the ROSAT band describes the X-ray spectra of most broad-line AGNs (e.g., Walter & Fink 1993). The absence of strong spectral variability corresponding to the factor-of-three change in the source flux suggested to us that a single emission component dominates below 2 keV; we further speculated that an ionized (or “warm”) absorber (Halpern 1984) might be responsible for the spectral complexity. The subsequent ASCA observation of NGC 4395 (Iwasawa et al. 2000) confirmed the presence of an ionized absorber and indicated that it may have multiple components.
For model fitting, the Chandra spectrum of NGC 4395 was grouped into bins containing a minimum of 25 counts. Because of uncertainties in the ACIS-S response at the lowest and highest energies, we have ignored channels below 0.5 keV and above 9 keV. The XSPEC software (Arnaud 1996) was used for spectral modeling.
5.1 Power-Law Fit
A power-law model with absorption by neutral material provides a poor fit to the Chandra spectrum over the entire 0.5–9 keV range. It does, however, provide an excellent fit to the data above keV. The best-fit photon index and absorption column density (with 90% confidence ranges for one parameter of interest) are and cm-2. The fit, which indicates an apparent excess of flux below 1 keV, is displayed in Figure 7. Modeling the spectrum above 2 keV we obtain the same best-fit value for the photon index. An unresolved Fe K emission line at 6.4 keV is very marginally detected with an equivalent width of eV (90% confidence). The improvement to the fit obtained with the inclusion of this component ( for one additional free parameter) is significant at the 95% confidence level.
The hard X-ray spectrum of NGC 4395 observed with Chandra is substantially flatter than the spectra of more luminous broad-line AGNs, which typically have slopes in the = 1.7–1.9 range (e.g., Nandra & Pounds 1994). In addition, the spectral index we have measured is much lower than the value of reported by Iwasawa et al. (2000) from their analysis of the first ASCA observation of NGC 4395. We return to this point in § 6. Interestingly, the 2–10 keV flux measured with Chandra ( erg cm-2 s-1) is similar to that obtained with ASCA ( erg cm-2 s-1).
5.2 Pile-Up Analysis
Although the average ACIS-S count rate is just count s-1, it is high enough at times to raise concerns about photon pile-up, i.e., the occurrence of two or more events in a pixel within one frame time. The effect of pile-up is to replace events at lower energies with fewer numbers of events at higher energies, which decreases the apparent count rate of the source and artificially flattens its spectrum. It can also alter the photon event grades. A thorough analysis of the pile-up issue is needed to confirm that the unusually flat spectrum of NGC 4395 we have observed — potentially one of its most important properties — is of a physical, not instrumental, origin.
The first indication that photon pile-up is not significant in our Chandra observation of NGC 4395 is the fact that the strong edge in the mirror response near 2.1 keV is visible in the spectrum (see Fig. 7); this feature is usually smeared out when pile-up is severe. As a preliminary test for spectral distortions associated with pile-up, we have analyzed a spectrum of NGC 4395 that excludes events from the innermost portion of the source’s spatial profile, which pile-up would affect the most. We extracted counts in an annulus centered on the source peak with an inner radius of 0.5 pixels (025) and an outer radius of 10 pixels (); the resulting spectrum consists of 73% of the total events. The effective-area file used when modeling the annular spectrum was corrected for the energy dependence of the Chandra point-spread function. Fitting the annular spectrum with an absorbed power-law model above keV, we obtain a spectral index of . Thus, the slope of the spectrum measured when the events most likely to be piled up are excluded is just as flat as that obtained using all the events, which demonstrates that time-averaged ACIS-S spectrum of NGC 4395 has not been distorted by pile-up.
To investigate the time dependence of pile-up effects during the observation, we have performed simulations with the LYNX software (Chartas et al. 2000; Eracleous et al. 2002). LYNX is a forward-fitting tool that simulates the distribution of counts per energy channel for an assumed input spectrum; using the timing information for a data set, it iteratively refines the intrinsic values of the model parameters, accounting for pile-up, until the simulated count distribution matches the observed one. LYNX assesses pile-up in two ways: (1) it provides an estimate of the pile-up fraction, i.e., the fraction of “true” events in the observed band that are lost because of pile-up, and (2) it provides estimates of the intrinsic values of the spectral parameters for a given model, which can be compared to those obtained directly via standard model fitting with XSPEC. The simulations can be performed for an entire observation or a portion of it.
The input spectrum employed for our analysis is a double power-law model, which provides a good fit to the ACIS-S spectrum over the full 0.5–9 keV range while introducing the fewest possible number of free parameters. In this model, a single component dominates above 1 keV. (A more physical description of the Chandra spectrum is presented in the next section.) Our LYNX simulations confirm that pile-up effects are minimal: the pile-up fraction is just 3% during periods of relative quiescence [e.g., the s range], and during the most active phase (i.e., the = 7000–9000 s range), the pile-up fraction is still only 10%. Pile-up fractions of 10% or less have negligible effects on the observed spectrum and are generally considered to be acceptable. In addition, the simulations indicate an intrinsic spectral index of for the dominant power law when the source was in an active phase ( = 6000–12,000 s), and during a more quiescent period ( = 0–6000 s). Both values are very similar to the observed spectral index of the source (§ 5.1). Changes in the parameters associated with the second power law are insignificant as well. It is therefore safe to conclude that photon pile-up has not seriously impacted the spectrum of NGC 4395 at any point during the Chandra observation, contrary to speculations by Shih et al. (2003).
5.3 Complex Spectral Features
As Figure 3 indicates, the variability of NGC 4395 at high and low photon energies, though not identical, is similar, implying that a single emission component dominates the spectrum of the object over the entire 0.3–10 keV range. However, an absorbed power-law model only provides a good fit above 1.2 keV. To investigate the spectral complexity at low energies, we refitted the Chandra spectrum above 2.2 keV with a power-law model, assuming only the Galactic neutral hydrogen column density. The residuals associated with this fit, displayed in Figure 8, exhibit several strong dips in the soft X-ray band, suggesting that an ionized absorber (e.g., Halpern 1984; Reynolds 1997) is present in NGC 4395. Indeed, with the addition of a warm absorber to the model (i.e., the “absori” component in XSPEC), an excellent fit to the Chandra spectrum over the full energy range is obtained. The best-fit photon index, , is almost identical to that found above in § 5.1 with simple power-law fits to the hard-band spectrum. Fixing the photon index at that value, the parameters associated with the warm absorber (with uncertainties corresponding to ) are as follows: a column density of cm-2 and an ionization parameter of erg cm s-1. The high ionization (and reduced opacity) of the absorber is needed for the model to account for the apparent soft excess indicated in Figure 7.
In their analysis of the ks ASCA observation of NGC 4395, Shih et al. (2003) fitted the high-energy portion of the spectrum with a complex model consisting of a power-law continuum, Compton reflection, and a relativistically broadened iron line. The line and reflection components contribute flux above keV, which leads to a steeper photon index than that obtained with a simple power-law fit. Given the extremely flat spectral index we find for NGC 4395, we should consider the effects of these additional spectral components — they could impact the warm absorber parameters we measure as well. Unfortunately, because our Chandra spectrum has only about a tenth as many 2–10 keV counts as the long ASCA SIS spectrum, we are unable to obtain meaningful constraints on the numerous free parameters associated with the additional components. We can, however, adopt the reflection and line parameters obtained by Shih et al. (2003) at face value as a means of assessing the range of possible values for the power-law and warm-absorber parameters during the Chandra observation. We first fitted the ACIS-S spectrum above 2 keV in exactly the same manner as described in § 4.1 of Shih et al. (2003); the model consists of power-law and reflection components (the “pexrav” model in XSPEC), a relativistically broadened iron line (the “diskline” model), and neutral absorption. Fixing all the parameters (except the power-law normalization) at the values derived or adopted by Shih et al. — this includes the photon index of they measured — we obtain a very poor fit to the Chandra spectrum ( for 60 degrees of freedom). With the photon index and column density as free parameters, an excellent fit is possible. The best fit (/d.o.f. = 45/58) yields the following values: and cm-2. Next, we set the neutral absorption to the Galactic value and the photon index to ; the addition of a warm absorber once more affords a good fit over the full 0.5–9 keV range, yielding the following parameters for the ionized medium: cm-2 and erg cm s-1. The ionization parameter is somewhat lower in this model compared to that obtained when the hard-band spectrum is represented as a simple power law with . This occurs because there is a greater amount of intrinsic soft X-ray flux in the the model; a lower ionization (greater opacity) is needed for a good fit to the spectrum at low energies.
6 Implications for the Nature of the Nucleus of NGC 4395
6.1 Broadband Luminosity of the Source
Using the high angular resolution of Chandra, we have established that the central X-ray source in NGC 4395 is coincident with the galaxy’s optical and radio nucleus. The X-ray emission is spatially unresolved and highly variable, leaving no doubt that it is associated with the dwarf AGN in the galaxy. Provided that a single emission component dominates in the Chandra band, the power-law fit to the ACIS-S spectrum above 1.2 keV suggests an absorption-corrected, time-averaged 2–10 keV luminosity of erg s-1 for an adopted distance of 4.1 Mpc. This is within 25% of the value obtained with ASCA (adjusted for this distance) by Iwasawa et al. (2000). In the 0.5–10 keV band, erg s-1. Combining the broadband X-ray luminosity with the radio–to–UV luminosity computed by Moran et al. (1999, after revision for the 4.1 Mpc distance), we obtain a bolometric luminosity of erg s-1. This luminosity corresponds to an Eddington-limit mass of for the accreting black hole. As reported by Filippenko & Ho (2003), the conservative upper limit for the black-hole mass is ; the actual mass, they argue, is likely to be between and . Using this range of values, the bolometric luminosity suggests an Eddington ratio of –0.04.
6.2 X-ray Fibrillation in the Heart of NGC 4395
The nucleus of NGC 4395 is an exceptionally variable X-ray source. As pointed out by Iwasawa et al. (2000), such extreme variability is quite uncharacteristic of low-luminosity AGNs (LLAGNs). We find the “excess variance” (Nandra et al. 1997; Turner et al. 1999) of the source in the 2–10 keV band is (using 128 s bins), almost twice that estimated by Iwasawa et al. using ASCA data and far greater than the excess variances measured for other LLAGNs (e.g., Ptak et al. 1998). However, many of the LLAGNs examined to date are LINERs, which are likely to be accreting in an advection-dominated mode (e.g., Lasota et al. 1996; Ho 1999) — in other words, they are supermassive black holes ( ) with low accretion rates (). In contrast, NGC 4395 appears to possess a less massive black hole that is accreting at a higher relative rate.
Amidst the rapid, large-amplitude variability, there is evidence of quasi-periodic oscillations in the light curve of NGC 4395. As discussed in § 4.3, a strong signal at a period of s is seen in periodograms of the Chandra data. The period is transient — a dozen or so cycles over a duration of ks were observed — but our simulations indicate that its statistical significance is high. Among the few previous reports of periodic variability in AGNs (Halpern et al. 2003, and references therein), this is perhaps the most convincing detection to date. If real, the periodic behavior could reveal important clues about the nature of NGC 4395. For instance, the other AGNs suspected of having periodic variations, RX J0437.4–4711 and Ton S180 (Halpern et al. 2003), have much higher 2–10 keV luminosities ( erg s-1) and far longer periods ( s) than NGC 4395, suggesting a relationship between period and black-hole mass. Such a relationship would be expected if the periodic signal is associated with the dynamical time scale of the accretion disk. For example, the period (in seconds) of an object in Keplerian orbit “” gravitational radii () from the black hole implies a black-hole mass of . If the source of the periodicity in NGC 4395 is located near the innermost stable orbit of the accretion disk (i.e., ), a mass of is implied. An orbital feature occurring farther out in the disk (at ) would require a lower mass for a fixed period of 400 s, so this might be taken as a firm upper limit on the mass of the black hole in NGC 4395.
6.3 Dramatic Long-Term Spectral Variability
Of great importance is the possibility that the shape of the broadband continuum in NGC 4395 has undergone dramatic changes during the three years that span the ASCA and Chandra observations. Taken at face value, simple absorbed power-law fits to the data above 2 keV signify that such spectral variability has occurred: during the first ASCA observation (1998 May; Iwasawa et al. 2000), during our Chandra observation (2000 June), and during the second ASCA observation (2001 May; Shih et al. 2003). We have also examined the spectrum of the nuclear source in NGC 4395 during the short 1260 s Chandra ACIS-S exposure obtained by Ho et al. (2001), which was carried out about two months before our 17 ks observation. The count rate of the source during the short exposure was just 0.095 count s-1, so severe pile-up is not a concern. Despite the limited ratio of the snapshot spectrum, an absorbed power-law model provides a good fit above keV; we find that (90% confidence), consistent with the results of the 17 ks exposure. The neutral column densities associated with these simple power-law fits are all in the narrow range of cm-2. Thus, it would appear that the spectral variations observed above 2 keV are due to large changes in the effective photon index, not the effective absorption. The apparent range of the photon index variations () is unprecedented among AGNs.
The possibility of complex spectral features in NGC 4395 at both high and low X-ray energies complicates the question of whether the intrinsic slope of the primary continuum varies, or whether the slope is constant and modified to a varying degree by extrinsic absorption. From their analysis of the second ASCA observation, Shih et al. (2003) have concluded that the intrinsic power law in NGC 4395 has a relatively steep (and presumably constant) slope of and that its flatter appearance at times is due to changes in the ionization of the warm absorber. However, not only is the photon index obtained from the first ASCA observation almost excluded by the second measurement, it was obtained with a simple power-law model — not one consisting of a power law, reflection, and a broad iron line, such as that used to derive the value of 1.46. As discussed above, inclusion of line and reflection components leads to a steeper power-law index. Accounting for these in the first observation would, if anything, yield an intrinsic photon index that is even steeper than . Thus, it seems unlikely that a change in the ionization of the warm absorber alone could reconcile the different results obtained with ASCA.
We have performed two tests to explore whether the flat spectrum observed with Chandra could be consistent with the power law measured by Shih et al. (2003). The first is based on analysis presented in § 5.3, where we fitted the Chandra spectrum above 2 keV using the reflection and iron line parameters derived by Shih et al. If the contributions from these components were the same during the Chandra observation, we should obtain a steep photon index similar (within the errors) to the ASCA result. As discussed above, the exact model parameters given by Shih et al. provide a poor fit to the Chandra spectrum. However, allowing the power-law index and neutral column density to vary, we obtain an excellent fit; the best-fit column density is approximately the same as that found by Shih et al., but we measure a much flatter spectral index of . The differences between the Chandra and ASCA results are illustrated in Figure 9, which strongly suggests that a change in the intrinsic photon index has occurred.
As a second test, we have fitted the Chandra spectrum over the full 0.5–9 keV range with the complete model of Shih et al. (2003). In addition to Compton reflection and broad iron-line emission, this model includes two components of ionized absorption. The presence of a second absorber, although not required by the Chandra data, cannot be ruled out either, and it could allow a steep photon index to be accommodated. Once again, because of the limited ratio of our data, we are unable to constrain the numerous free parameters associated with this model, so we have adopted the best-fit parameters obtained by Shih et al., including the photon index of . The only free parameters in the fit were the column densities and ionization parameters of the absorbers and the normalization of the continuum. Interestingly, this model yields a formally acceptable fit to the full Chandra spectrum. The best-fit column densities we obtain ( cm-2 and cm-2) are similar to those found by Shih et al. when they modeled the time-averaged ASCA spectrum; the best-fit ionization parameters, on the other hand, are much lower ( erg cm s-1 and erg cm s-1). However, we obtain a much better fit if we allow the photon index to be a free parameter (/d.o.f. = 64.2/77). An F-test indicates that the improvement to the fit ( for one additional free parameter) is significant at a confidence level far greater than 99%. The best-fit warm absorber parameters do not change much ( cm-2, cm-2, erg cm s-1, erg cm s-1). The photon index of we obtain clearly excludes the Shih et al. value of 1.46. Once more, it appears that the intrinsic spectral index of NGC 4395 during the Chandra observation was less than that observed with ASCA.
Without question, the overall shape of the X-ray spectrum of NGC 4395 varies on time scales of a year or less. The preponderance of evidence indicates that changes in the intrinsic slope of the primary continuum are at least partly responsible. If real, such dramatic photon index variations — previously unobserved in AGNs — are important for understanding the nature of this object. Current theory is challenged to explain the large spectral index changes and extremely flat power-law slope implied for NGC 4395 (e.g., see Haardt, Maraschi, & Ghisellini 1997). We note that the photon index of we obtain when reflection and iron emission are considered is consistent with the minimum slope expected in the standard picture for hard X-ray production in AGNs, whereby low-energy photons from an accretion disk are inverse-Compton scattered by a corona of hot () thermal electrons with low optical depth (; Haardt & Maraschi 1993). The time scales for all relevant processes in the nucleus of NGC 4395 are 2–3 orders of magnitude shorter than in luminous AGNs. Thus, the effects of fluctuations of certain physical conditions (e.g., the spectrum of the seed photons or temperature of the corona) might be more readily observed in this object. At any rate, the X-ray spectral variability of NGC 4395 should be monitored; it may provide new insight into the accretion processes not only in this object, but perhaps generally in AGNs.
6.4 Ionized Absorption and the Short-Term Spectral Variability
The other significant difference between our results and those obtained with ASCA concerns the variability of NGC 4395 in the 1–2 keV band and its dependence on the source count rate at higher energies. A strong excess 1–2 keV flux associated with increases in the 2–10 keV count rate was seen in the ASCA data (Iwasawa et al. 2000; Shih et al. 2003). To account for this behavior, Iwasawa et al. (2000) suggested that two ionized absorbers are present, one that is constant and one that is variable. In this picture, the ionization parameter of the latter component increases when the source is in a high state, resulting in a lower opacity in the 1–2 keV range and excess observed flux in this band. The Chandra light curves in Figure 3 and the spectral ratio plots shown in Figure 5 do not indicate this sort of behavior. In general, excess soft X-ray emission does not accompany an increase in the hard-band count rate. In fact, the largest spike in the (1–2 keV)/(2–10 keV) count-rate ratio (bottom panel of Fig. 3) coincides with a sharp drop in the hard X-ray flux.
While these results are inconsistent with the details of the multi-zone warm absorber model discussed by Iwasawa et al. (2000), it is important to note that a constant, single-zone absorber model — which provides an excellent fit to the Chandra spectrum of NGC 4395 — also cannot account for the short-term spectral variability indicated in Figure 3. In that circumstance, no fluctuations in the (1–2 keV)/(2–10 keV) count-rate ratio should be observed. We therefore consider the possibility that the ionized absorbing medium in NGC 4395 is non-uniform or clumpy: The spatial scale of the clumpiness and the transverse velocity of such a medium could, in the right combination, give rise to rapid column density variations along the line of sight, and thus, to changes in the observed soft X-ray flux that are partially independent of the continuum variability above 2 keV. Soft-band and hard-band light curves that are similar in some respects, but not in others, would be a natural consequence in this scenario. A similar idea was considered by Reynolds & Fabian (1995) as a source of spectral variability in AGNs.
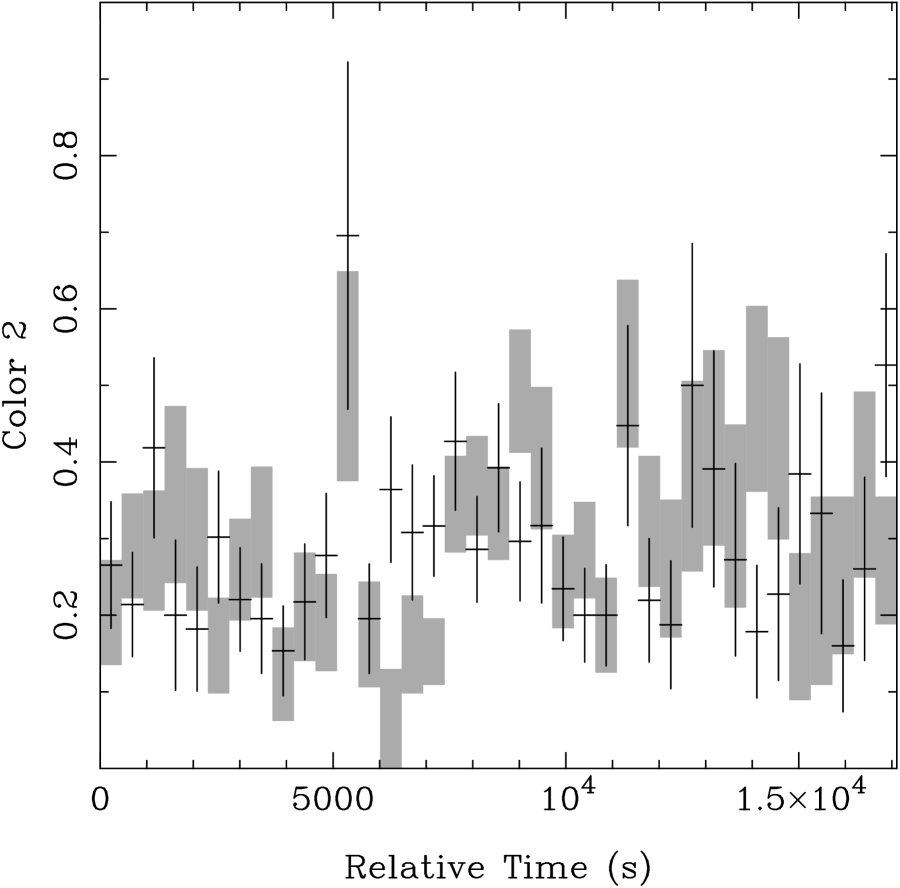
As a preliminary test, we have used the PIMMS software to compute the ACIS-S count rates that would be observed in various bands if the power law were absorbed only by a Galactic column of neutral material. Relative to the 2–10 keV band, we would expect 0.65 and 0.73 times as many counts in the 0.3–1.2 keV and 1–2 keV bands, respectively. If variations in column density associated with a clumpy absorbing medium are responsible for differences in the soft-band and hard-band light curves we observe, the X-ray colors of the source defined in Figure 3 should not exceed these amounts. Referring to the figure, we see that the maximum value of Color 1 (the [0.3–1.2 keV]/[2–10 keV] ratio) is and the maximum value of Color 2 (the [1–2 keV]/[2–10 keV] ratio) is , consistent with our hypothesis.
To investigate the role of column density variations further, we have used the Color 1 light curve to predict the values of Color 2 for the entire Chandra observation. This was done by adjusting the column density of the ionized medium in the best-fit warm absorber model (see § 5.3) until the observed values of Color 1 were obtained. The same model, with the modified column density, was then used to derive Color 2. The implied range of column densities is to cm-2. As Figure 10 shows, the agreement between the observed and predicted values of Color 2 is quite good. Although the model we have employed may not be the best physical description of the source’s spectrum, our results suggest that column density fluctuations may indeed contribute to the short-term spectral variability indicated in Figure 3.
A few simple calculations can be made to assess the plausibility of the non-uniform column density scenario. Following Reynolds & Fabian (1995), the time scale of the associated spectral variability would be , where is the characteristic size of the non-uniformities and is the transverse velocity of the medium. From the bottom two panels of Figure 3, we can see that s or less. Placing the warm absorber within or just outside the broad-line region (BLR) — an ad hoc assumption, but one consistent with the findings of other investigations (e.g., Reynolds & Fabian 1995) — we can estimate the transverse velocity. The broad H line in NGC 4395 has a full-width at zero-intensity of km s-1 (Filippenko & Sargent 1989). This implies an upper limit of km s-1 if the BLR is made up of spherically distributed clouds with random orbits. If instead the BLR gas has a flattened distribution that is inclined to our line of sight, 3500 km s-1 might be a typical velocity; we adopt it as such. Thus, cm is obtained. The column density of the medium is cm-2, which suggests a number density cm-3. If is a virial velocity, the location of the warm absorber relative to the central black hole is , where is the mass of the black hole. This places the ionized medium at cm if , and at cm if . In either case, , as it must be. Assuming the ionizing luminosity to be erg s-1, we can now estimate the value of the ionization parameter : erg cm s-1 if , and erg cm s-1 if . Despite the rough numbers used here, we obtain a range of values of the ionization parameter that, for the probable range of the black-hole mass, brackets the various measured values of (§ 5.3; Iwasawa et al. 2000; Shih et al. 2003). Thus, an association between the short-term spectral variability observed with Chandra and fluctuations in the column density of the warm absorber cannot be ruled out.
A question naturally arises: could some of the absorption be due to the BLR gas itself? The calculations above suggest that a connection between the absorber and the BLR gas, at least the more highly ionized portion of it, is plausible. Absorbers with physical conditions that are consistent with those expected for gas in the BLR have been identified in some other more luminous Seyfert galaxies. Examples include Mrk 509 (Kriss et al. 2000), NGC 5548 (Kaastra et al. 2002), NGC 3783 (Blustin et al. 2002), and IRAS 13349+2438 (Sako et al. 2001). In the case of NGC 4395, photoionization modeling by Kraemer et al. (1999) has indicated that the covering factor of the BLR gas is very high. Thus, it is entirely possible that BLR gas lies along our line of sight to the continuum source, where the X-ray absorber is located.
7 Summary and Conclusions
The nucleus of NGC 4395 is unique among type 1 AGNs. In addition to having one of the lowest observed luminosities and least massive black holes, it displays a number of extreme properties in the X-ray band as well. As our Chandra observation confirms, NGC 4395 has a spectacular X-ray light curve that exhibits large-amplitude variations on extremely short time scales. This object is one of the most X-ray–variable AGNs known. In addition, the Chandra light curve shows possible evidence of quasi-periodic oscillations. About a dozen cycles with a period of s were observed. The statistical significance of the periodicity is high, making this one of the most convincing cases to date of periodic X-ray variability in an AGN. Under the assumption that the feature responsible for the periodic signal is located near the innermost stable orbit of the accretion disk, the 400 s period implies an upper limit of for the mass of the black hole in NGC 4395, which is consistent with previous estimates of the black-hole mass.
One of the most intriguing aspects of the nuclear X-ray source in NGC 4395 is the slope of its hard X-ray spectrum. The Chandra data indicate an effective power-law photon index of , which is significantly flatter than the X-ray spectral slopes associated with more luminous type 1 AGNs (). Even with the additional spectral components considered by Shih et al. (2003), we find (90% confidence). In addition, the collective results of recent broadband X-ray observations of NGC 4395 indicate that the intrinsic slope of its continuum emission undergoes dramatic changes ( to ) on time scales of a year or less. Spectral variations of this magnitude have never been observed in an AGN.
Ionized gas is apparently responsible for the bulk of the X-ray absorption in NGC 4395. Although short-term spectral variability is indicated over the course of the Chandra exposure, we do not observe a strong excess 1–2 keV flux corresponding to increases in the 2–10 keV count rate, which was the impetus for the complex multi-zone warm absorber model employed by Iwasawa et al. (2000) and Shih et al. (2003). We find that column density fluctuations associated with a non-uniform absorbing medium are able to account for the short-term spectral variability we observe. This is not to say that the changes in ionization reported in the ASCA studies did not occur — the ionization and column density may both vary in a real warm absorber. Some other property of NGC 4395 — perhaps the slope of the continuum — may cause one effect to dominate over the other in terms of the short-term spectral variability of the source. We note that the flux of photons above 1 keV incident on the absorbing medium during the first ASCA observation (when ) was as much as 2.5 times greater than it was during the Chandra exposure. Such changes in the ionizing photon flux could significantly affect the physical state of the absorber.
Obviously, X-ray monitoring of NGC 4395 with high-spatial resolution instrumentation is crucial for a clarification of the physical processes occurring in its nuclear region. Ultimately, a firm understanding of the unusual behavior in this object may provide valuable insight into the physics of AGNs.
References
- (1) Arnaud, K. 1996, in Astronomical Data Analysis Software and Systems V, ed. G. Jacoby & J. Barnes (San Francisco: ASP), 17
- (2) Benlloch, S., Wilms, J., Edelson, R., Yaqoob, T., & Staubert, R. 2001, ApJ, 562, 121
- (3) Chartas, G., et al. 2000, ApJ, 542, 655
- (4) Blustin, A. J., Branduardi-Raymont, G., Behar, E., Kaastra, J., Kahn, S. M., Page, M. J., Sako, M., & Steenbrugge, K. C. 2002, A&A 392, 453
- (5) Davis, J. E. 2001, ApJ, 562, 575
- (6) Eracleous, M., Shields, J. C., Chartas, G., & Moran, E. C. 2002, ApJ, 565, 108
- (7) Filippenko, A. V., & Ho, L. C. 2003, ApJ, 588, L13
- (8) Filippenko, A. V., Ho, L. C., & Sargent, W. L. W. 1993, ApJ, 410, L75
- (9) Filippenko, A. V., & Sargent, W. L. W. 1989, ApJ, 342, L11
- (10) Haardt, F., & Maraschi, L. 1993, ApJ, 413, 507
- (11) Haardt, F., & Maraschi, L., & Ghisellini, G. 1997, ApJ, 476, 620
- (12) Halpern, J. P. 1984, ApJ, 281, 90
- (13) Halpern, J. P., Leighly, K. M., & Marshall, H. L. 2003, ApJ, 585, 665
- (14) Ho, L. C. 1999, ApJ, 516, 752
- (15) Ho, L. C., et al. 2001, ApJ, 549, L51
- (16) Iwasawa, K., Fabian, A. C., Almaini, O., Lira, P., Lawrence, A., & Hyashida, K. 2000, MNRAS, 318, 879
- (17) Kaastra, J. S., Steenbrugge, K. C., Raassen, A. J. J., van der Meer, R. L. J., Brinkman, A. C., Liedahl, D. A., Behar, E., & de Rosa, A. 2002, A&A, 386, 427
- (18) Kormendy, J. 2001, RMxAA, 10, 69
- (19) Kraemer, S. B., Ho, L. C., Crenshaw, D. M., Shields, J. C., & Filippenko, A. V. 1999, ApJ, 520, 564
- (20) Kriss, G. A., et al. 2000, ApJ, 538, L17
- (21) Lasota, J.-P., Abramowicz, M. A., Chen, X., Krolik, J., Narayan, R., & Yi, I. 1996, ApJ, 462, 142
- (22) Lira, P., Lawrence, A., O’Brien, P., Johnson, R. A., Terlevich, R., & Bannister, N. 1999, MNRAS, 305, 109
- (23) Moran, E. C., Filippenko, A. V., Ho, L. C., Shields, J. C., Belloni, T., Comastri, A., Snowden, S. L., & Sramek, R. A. 1999, PASP, 111, 801
- (24) Murphy, E. M., Lockman, F. J., Laor, A., & Elvis, M. 1996, ApJS, 105, 365
- (25) Nandra, K., George, I. M., Mushotzky, R. F., Turner, T. J., & Yaqoob, T. 1997, ApJ, 476, 70
- (26) Nandra, K., & Pounds, K. A. 1994, MNRAS, 268, 405
- (27) Papadakis, I. E., & Lawrence, A. 1993, MNRAS, 261, 612
- (28) Ptak, A., Yaqoob, T., Mushotzky, R., Serlemitsos, P., & Griffiths, R. 1998, ApJ, 501, L37
- (29) Reynolds, C. S. 1997, MNRAS, 286, 513
- (30) Reynolds, C. S., & Fabian, A. C. 1995, MNRAS, 273, 1167
- (31) Sako, M., et al. 2001, A&A, 365, 168
- (32) Shih, D. C., Iwasawa, K., & Fabian, A. C. 2003, MNRAS, 341, 973
- (33) Thim, F., Hoessel, J. G., Saha, A., Claver, J., Dolphin, A., & Tammann, G. A. 2004, AJ, 127, 2322
- (34) Timmer, J., & Kon̈ig, M. 1995, A& A, 300, 707
- (35) Turner, T. J., George, I. M., Nandra, K., & Turcan, D. 1999, ApJ, 524, 667
- (36) Vaughan, S. 2004, A&A, in press
- (37) Walter, R., & Fink, H. H. 1993, A&A, 274, 105
- (38) Wrobel, J. M., Fassnacht, C. D., & Ho, L. C. 2001, ApJ, 553, L23