Alexei Moiseev,
The SCORPIO Universal Focal Reducer of the 6-m Telescope
Abstract
We describe the SCORPIO focal reducer that has been used since the fall of 2000 for observations on the 6-m Special Astrophysical Observatory telescope. We give parameters of the instrument in various observing modes (direct images, long-slit and multislit spectroscopy, spectropolarimetry, Fabry-Perot panoramic spectroscopy). Observations of various astronomical objects are used as examples to demonstrate the SCORPIO capabilities.
1 INTRODUCTION
The idea of using a focal reducer on a telescope was suggested and implemented by Georg Courtés as the 50-60 of the last century (see, for example, Courtés, 1960, 1964). The focal reducer allows several problems to be solved simultaneously. Firstly, the equivalent focal ratio of the system becomes faster and the field of view increases, which is important for studying faint extended objects. Secondly, the off-axis aberrations of the primary mirror can be corrected by using specially calculated optics. Thirdly, it becomes possible to install dispersing elements (grisms, Fabry-Perot interferometer (FPI) etc.) in the parallel beam between the collimator and the camera, which turns the focal reducer into a universal spectrograph.
Instruments based on this scheme, which are primarily designed for the spectroscopy and photometry of faint extended objects, have gained wide acceptance in the last two decades. It will suce to mention the EFOSC camera of the 3.6-m ESO telescope (Buzzoni et al. 1984); in many respects, it became the prototype of modern spectrographs for 8-10-m telescopes, such as FORS on VLT (Nicklas et al. 1997). The first focal reducer for interferometric observations on the 6-m BTA telescope was created at the Special Astrophysical Observatory (SAO) of the Russian Academy of Sciences in the mid-1980s using commercially available photographic lenses. Despite such shortcomings as poor image quality at the edge of the field of view, low optical transmittance (about 30% at maximum), and the absence of any automation, the reducer had been used on the 6-m BTA telescope for more than ten years until the question of its upgrading arose. In 1999, work on the creation of a new focal reducer for the prime focus of the 6-m BTA telescope began at the SAO. The new SCORPIO (Spectral Camera with Optical Reducer for Photometric and Interferometric Observations) focal reducer has allowed the following types of observations of extended and starlike objects to be performed at the prime focus of the 6-m telescope:
-
•
Direct images in broad-, medium- and narrow-band filters.
-
•
Panoramic spectroscopy with the FPI.
-
•
Long-slit spectroscopy.
-
•
Slitless spectroscopy.
-
•
Multiobject spectroscopy with 16 slits moved remotely in the focal plane.
-
•
Polarimetry in the filtres and spectropolarimetry.
The mechanical and optical parts of SCORPIO were produced at the SAO breadboard workshops. The first BTA observations were performed in September 2000 with the old version of the prime-focus adapter. A new adapter platform came into use in May 2001. The first successful multislit spectroscopic observations were carried out in September 2003; in the summer of 2004, the spectropolarimetric mode was implemented, and the first observations were performed. In the next section, we consider the optomechanical layout of SCORPIO and its basic characteristics. Subsequently, we consider the peculiarities of observations in various modes; these are illustrated using specific results obtained with the 6-m telescope when the instrument was tested. In the last section we consider prospects for further upgrading SCORPIO .
| Total focal ration | |
|---|---|
| Field of view: | |
| full | |
| in mutlsilit mode | |
| Image scale | |
| Spectral range | Å |
| Spectral resolution | |
| with grisms | |
| (for slit width ) | Å |
| with Fabry-Perot | |
| interferometers | Å |
| Maximal quantum efficiency | |
| (telescope+SCORPIO +CCD) | |
| Direct imaging | 70% |
| Spectroscopy | 40% |
| Observations with FPI | 20% |
2 Description of the spectrograph
Constructionally, SCORPIO consists of three parts each of which can be used independently: a focal reducer, a prime-focus adapter platform, and a CCD detector. Basic parameters of the instrument are given in Table 1.
2.1 The focal reducer
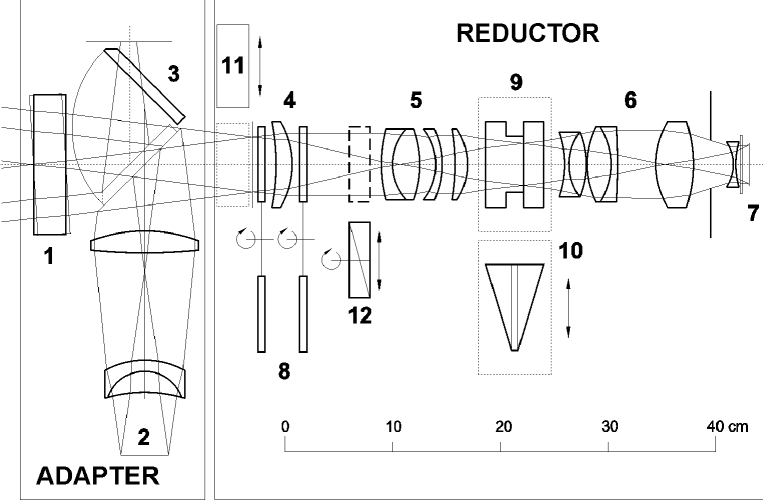
The optical layout of the focal reducer (Fig.1) includes a field lens and a collimator – a four-lens apochromat (F/2.2) that forms the exit pupil of the system, a camera objective – a six-lens apochromat (F/1.8), and replaceable optical elements – FPI, diffraction gratings, filters, a polarization analyzer, phase plates ant etc. The equivalent focal ratio of the system at the prime focus of the 6-m telescope is F/2.6. The optical surfaces are coated with seven antireflecting layers111The antireecting layers were put on the surfaces at the Nizhnii Novgorod Institute of Applied Physics. that work in the wavelength range . The laboratory measurements of the SCORPIO spectral transmission curve are shown in Fig.2.
Since the collimator optics corrects the coma and field curvature of the primary mirror of the telescope, we can abandon the use of the standard lens corrector without antireecting coating. The diameter of the collimated beam is 40 mm. The working focal length of the camera is 14 mm. The equivalent focal length of the BTA reducer is 15.6 m, which corresponds to an image scale of 75. The linear size of the nonvignetted field of view is mm in the plane of the detector. Constructionally, the reducer was made in the form of separate remotely controlled units mounted in a single case:
-
•
a multislit unit placed in front of the focal plane;
-
•
two rotating wheels,each with six positions;
-
•
a polarization analyzer placed in front of the collimator;
-
•
the collimator focusing mechanism;
-
•
the mechanism of putting/withdrawing a dispersive element in/from the collimated beam.
The multislit unit, which is designed for multiobject spectroscopy, is an arrangement that consists of 16 metal strips with slits located in the focal plane and moved in a field. The slit height is about 18′′. The position of each slit is fixed using two (holding and catching) electromagnets. The holding magnets are fixed; the catching magnets are fastened to the frame that is moved along one coordinate by a stepping motor. A separate electromagnet simultaneously fixes the positions of all slits in the focal plane. The arrangement is put in the beam using a stepping motor.
The wheels installed in the spectrograph are designed to put various replaceable elements in the beam – filters, slits, masks, etc. All of the elements installed in the wheel are mounted in bayonet-type holder with a clear aperture of 72 mm, which allows them to be replaced on the fly. Medium- and narrow-band interference filters as well as a slit for spectroscopic observations are generally installed in the wheel located in the focal plane of the telescope. Broad-band glass filters, a phase plate, and a mask for slitless spectroscopy are installed in the second wheel (behind the field lens and in front of the collimator). One position in each wheel always remains free in order that all of the installed filters could be used in observations.
A 14-mm-thick Savart plate that separates the beams in two mutually perpendicular planes of polarization by in the focal plane is used as the polarization analyzer. The analyzer can be turned around the optical axis through .A stepping motor is used to put the analyzer in and withdraw from the beam and to turn it.
The collimator focusing mechanism provides a linear displacement of the collimator within 12 mm with an accuracy of 0.01 mm.
A slide with two switchable positions to put dispersive elements (FPI or direct-vision grisms) in the beam is located between the collimator and the camera. A built-in neon lamp is used to visually adjust the FPI. A central electromagnetic shutter with a shutter cycle of 0.1 s is located at the flange of the instrument closest to the primary mirror in front of the mutislit unit.

2.2 The platform-adapter
The platform adapter is fixed on a turning table in the BTA prime-focus cage and is used for guiding based on off-axis stars and for illuminating the spectrograph by calibration lamps. Both the focal reducer and other equipment can be mounted on it. The adapter is equipped with an electromagnetic shutter that works independently of the central shutter of the focal reducer.
The adapter contains two rectangular fields to search for guiding stars222 Since the 6-m telescope has an altazimuth mounting, both the position of the telescope in and and the rotation of the field of view should be controlled during the guiding. Therefore, two guiding stars are used.; the centers of the fields are offset by from the center of the field of view. A fiber bundle displaced by step motors in a rectangular coordinate system is located in each of the fields. The off-axis lens correction placed in front of each guiding field corrects the coma of the telescope’s primary mirror. The fiber displacement range is , and the diameter of the field of view of each fiber is about .
The flat diagonal mirror (denoted by number 3 in Fig.1) has two fixed positions. At one of these positions, the mirror throws the images from the fiber bundles to the TV view. This mode is used when exposing objects. At the other position, the mirror blocks the central beam of light from the telescope and throws the image of the field center of the instrument to the TV view, which is needed to roughly point the telescope at the required object. In addition, the light from the calibration lamps is thrown to the spectrograph at this position of the mirror.
The adapter contains the calibration illuminator optics that forms a convergent beam with a focal ratio of F/4 at the entrance of the focal reducer, which is telecentrically equivalent to the beam formed by the primary mirror of the telescope. This scheme of the calibration unit forms the system’s pupil at the same position where the image of the telescope’s main mirror is located. This allows us not only to properly calibrate the wavelength scale using a line-spectrum lamp, but also to calibrate the system’s transmission in various operating modes (flat field). The entrance area of the calibration unit is illuminated through an integrating sphere (Ulbricht’s sphere) by two calibration lamps: a He-Ne-Ar-filled lamp to calibrate the wavelength scale and a continuum halogen lamp to produce a flat field.
The SCORPIO control system contains a relatively large number of various electromechanical mechanisms (13 motors, two shutters, two calibration lamps, three crossillumination LEDs, 33 electromagnets in the multislit unit) that are controlled as follows. Each of the listed units (the focal reducer, the platform, and the multislit unit) includes electronic boards with a microprocessor that controls the mechanisms of the corresponding unit. Instructions to the microprocessor are issued from a remote personal computer using the standard RS232 data connection protocol. This implementation of the instrument’s remote control allows the required stability to be achieved when working with the existing long communication lines of the 6-m telescope. No continuous control of the motors and their state polling are required: the microprocessor takes over these functions. At the same time, any possible changes of the observing technique and the software on the controlling computer requires no re-programming of the microprocessors.
2.3 The CCD detector
From 2000 until 2003, the detector was a TK1024 -pixel CCD array. Since April 2003, an EEV 42-40 -pixel CCD array has been mainly used on SCORPIO . Basic parameters of the two detectors are given in Table 2. It should be noted that a programmed choice of modes with different gain and readout speeds and noise is possible for EEV 42-40. Figure 2 shows a plot of the quantum efficiency for EEV 42-40. The detector is cooled with liquid nitrogen. The entire complex for CCD observations (the cryostat, the electronics, and the control software) were designed and produced in the SAO Laboratory of Advanced Design (http://www.sao.ru/hq/adlab/).
As we see from Table 2, the detectors used have a high quantum efficiency (see Fig.2), low noise, and low dark current. In addition, both detectors have an almost perfect surface: the numbers of bad columns and hot pixels are very small. Perhaps the only shortcoming is the interference of the transmitted light (fringes) that is observed at wavelengths longer than 7500 Å for TK1024 and longer than 6600 Å for EEV 42-40. An appropriate observing technique (see the section 4) is required to properly subtract the interference pattern.
| The detector | ||
| TK1024 | EEV-42-40 | |
| Type | Thin, back-illuminated | |
| Size | ||
| Pixel size, | 24 | 13.5 |
| Scale1, | 0.32 | 0.18 |
| Field of view1, arcmin | 5.4 | 6.1 |
| Max DQE, % | 80 | 83 |
| Readout noise, ē | 3 | 1.8-4 |
| Dark current, ē/min | 0.1 | 0.03 |
| 1 Till September 2003 the optics supported the focal | ||
| ratio was used. In this case the scale on CCD | ||
| TK1024 was /px, with the field of view | ||
| Filter | , | mags |
|---|---|---|
| B | 2500 | 27.0m |
| V | 1500 | 26.3m |
| RC | 1260 | 26.4m |
| IC | 1800 | 25.1m |
3 Observations in various modes
3.1 Direct Images
SCORPIO is equipped with several filter sets that can be used for photometric observations. Broad-band glass filters allow the Johnson-Cousins photometric UBVRcIc system to be implemented in direct imaging mode (see Bessell 1990). Table 3 gives the limiting magnitudes for the detection of faint objects at a signal-to-noise ratio of 3 at seeing. This table is based on the work of Fatkhullin (2002), who studied the capabilities of SCORPIO (with a TK1024 CCD) for the photometry of faint starlike and extended objects. The set of medium-band interference filters with a bandwidth of 160-400 Å and central wavelengths of 3700-9700 Å was produced at the Research Institute of Applied Instrument Making (Moscow). In direct imaging mode, these filters can be used for various tasks, such as constructing the spectral energy distribution for faint objects in the field or imaging extended objects in various emission lines (, [OIII], etc.) and in the continuum. Examples of such images obtained with SCORPIO are given in the paper by Lozinskaya et al. (2002). I.D. Karachentsev (SAO) provided a filter with a bandwidth of 75 Å centered at the wavelength of the line, which is used to map the distribution of ionized hydrogen in nebulae and nearby galaxies. The main problem of photometric observations is the interference pattern (fringes) during observations in red photometric bands (see the section 4). Thus, for example, during Ic-band observations with an EEV 42-40 CCD, the fringes level reaches 8% of the sky background level.
3.2 Long-Slit and Slitless Spectroscopy
The preimaging possibility proves to be very useful in slit spectroscopy of both extended objects (since the slit position is known exactly) and starlike objects if the latter are too faint to be visible on the TV-view. Thus, for example, 1-2 minutes trial exposure in the filter Rc is enough for reliable pointing to objects of 22-23m at a moderate seeing. In the pointing process, the object under study is set on the detector where the slit image is projected. Subsequently, the slit is set in place of the filter, and a grism (the combination of a transparent grating and two prisms) is inserted in the collimated beam, which turns the focal reducer into a fast spectrograph. So, the change of the “direct imaging”-“long slit” configurations takes about one minute.
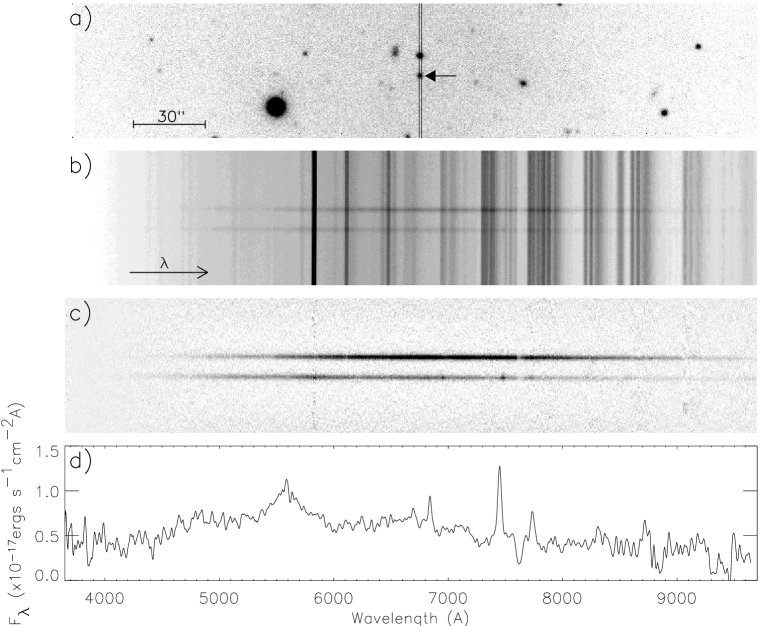
Figure 3 sequentially shows the process of obtaining observational data using the spectroscopy of the radio galaxy RCJ 1154+0431 (the observations at the request of Yu.N. Pariiskii) as an example. The total V magnitude is , its measured redshift is z=1.0 (see Afanasiev et al., 2003a).
SCORPIO is equipped with set of grisms ensuring observations with different spectral resolution (from to Å with the slit width ) in different regions of an optical spectrum. Before 2003, observations were performed using transparent gratings with profiled grooves with the number of grooves from 300 to 1200 per mm. The gratings are replicas from cut gratings and were produced at the S.I. Vavilov State Optical Institute (St.Petersburg). The maximum quantum efficiency of the entire system (telescopeSCORPIOCCD) with such gratings was 30% for low-resolution (Å) spectra and only about 3-5% for higher-resolution (Å) spectra. Observations with grisms using volume phase holographic gratings (VPHGs) were begun in 2003-2004; these have a high transmission and a low level of scattered light (Barden et al. 2000; Habraken et al. 2001). The number of lines for the available VPHGs ranges from 550 to 3000 per mm; in this case, a quantum efficiency of 20-50% is achieved with both low (see Fig.2) and high resolutions.
The main set of gratings was produced by Wasath Photonics (USA, http://wasatchphotonics.com); two gratings were kindly provided by the University of Padova (Italy).
The achieved quantum efficiency of the instrument has allowed one to continuously determine the redshifts and spectral classification of extragalactic radio sources, since the required low-resolution spectra of objects can be obtained even at moderate atmospheric transparency and at seeing; the total exposure time is only 10-20 min (see, e.g., Afanasiev et al., 2003b; Amirkhanyan et al. 2004). At the same time, at seeing in low-resolution spectroscopy of starlike objects, a limiting magnitude of R is achieved over a two-hour exposure time (the signal-to-noise ratio is 10 in the continuum of the spectra obtained). The stability of the instrumental profile of the spectrograph, which affects both the accuracy of subtracting the night-sky lines and the possibility of allowance for the interference pattern in the detector material (see the section 4), plays a crucial role in obtaining the spectra of such faint objects. The technique of displacing an object along the slit between exposures helps greatly in such observations. During the subsequent reduction, a pure spectrum, i.e., the spectrum of the sky taken from the same location, but on the displaced frame, is subtracted from the spectrum of the object.
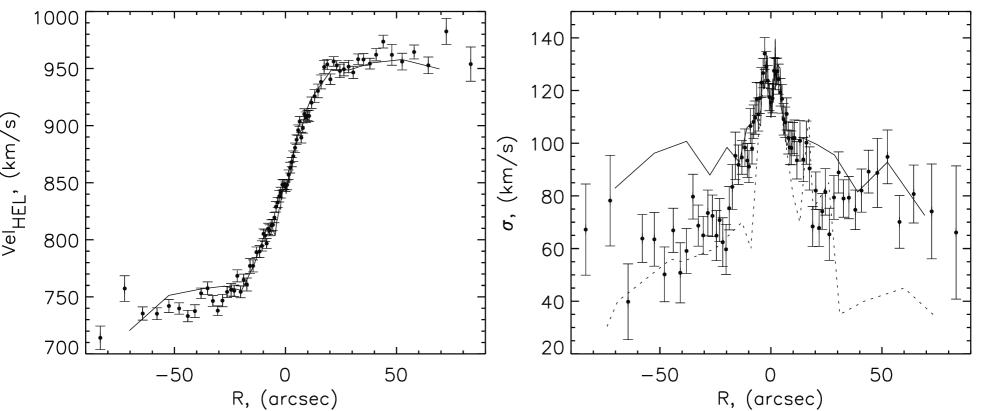
A good test for the capabilities of the spectrograph is to study the kinematics of galactic stellar disks, since absorption spectra with a relatively high signal-to-noise ratio and a spectral resolution of at least Å should be obtained here for regions with a surface brightness of 21-23. Figure 4 shows an example of measuring the parameters of the stellar kinematics along the major axis of a barred lenticular galaxy, NGC 3412. Over a 1.5-h total exposure time on SCORPIO (using VPHG2310), we can measure the radial velocities and the radial-velocity dispersions of stars for regions with a V-band surface brightness of .
Slitless spectroscopy, where the slit is replaced with a circular mask about in diameter, is used during the observations of spectrophotometric standard stars. This technique allows one to completely get away from the problems of light losses on the slit and distortion of the spectral energy distribution due to the effect of differential atmospheric refraction.
3.3 Multislit Spectroscopy
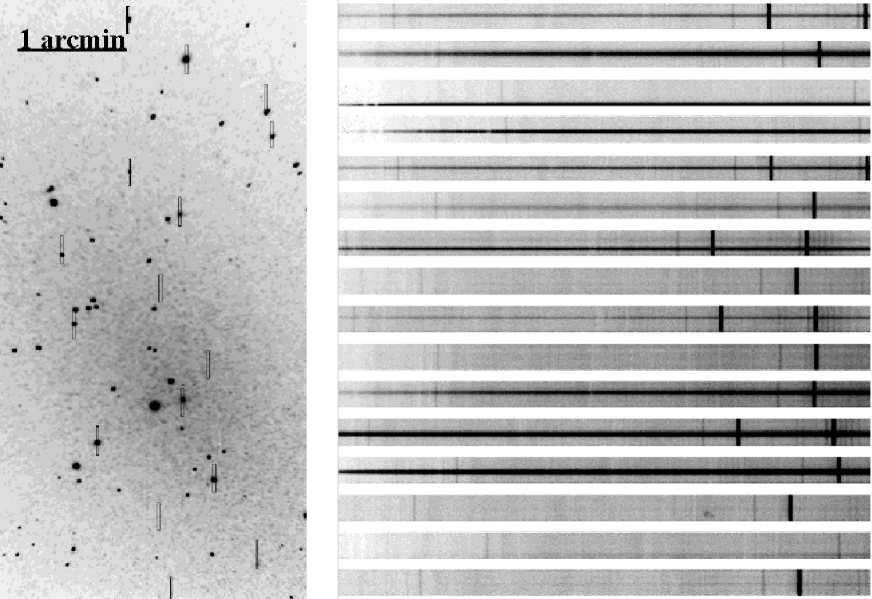
The available set of grisms can also be used in multislit observations, although the total spectral range decreases in comparison with the long-slit case due to the slit displacement in the field. An IDL-based package of the programs was written for the preliminary determination of the optimal position angle of the multislit unit concerning observed. In such observations, a direct image of the area under study is obtained, a multislit unit is introduced in the focal plane of the telescope, and the slits are set according to the coordinates of the chosen objects measured on the CCD array. The time of the complete slit arrangement (at the required accuracy of ) is about 10 min. The spectra obtained are illustrated in Fig.5.
3.4 Panoramic Spectroscopy
The scanning FPI is a highly efficient instrument for studying the kinematics of extended objects. The observations consist in sequentially obtaining several tens of images of the interferentic rings from the object under study (or a calibration lamp) for various optical paths between the parallel reflecive plates. The radius of the rings is a function of the wavelength and the FPI plates’ gap. After special reduction, these interferograms can be represented as a data cube in which two coordinate axes are located in the plane of the sky and the wavelengths (or the Doppler velocities measured from the redshifts of spectral lines) are the third coordinate. In other words, an individual spectrum is related to each image pixel.
The Queensgate ET-50 scanning piezoelectric interferometer is placed between the collimator and the camera where the exit pupil of the optical system is located. There are two scanning FPIs at the SAO provided by the Marseilles (France) and Burakan (Armenia) Observatories. These FPIs work in 235 and 501 orders of interference (near the line) and provide a spectral resolution in this line of 2.5 and 0.7Å for spectral ranges free from order overlapping 28 and 13 Å respectively. These are successfully used to study both Galactic (nebulae, star clusters) and extragalactic objects. For more details on the FPI observations with SCORPIO , see Moiseev (2002).
Narrow-band filters with a bandwidth of Å are used to separate out the required portion of the spectrum. A set of filters centered at the wavelength of the redshifted emission line under study is needed for the observations of various galaxies. With the filters available at the SAO, objects with radial velocities from to and from +3500 to are currently observable in the and [OIII] lines, respectively. Most of the narrow-band filters were produced at the Research Institute of Applied Instrument Making (Moscow); several filters were provided by our colleagues from the Burakan Observatory (T.Movsesyan) and the Padova University (G.Barbieri).
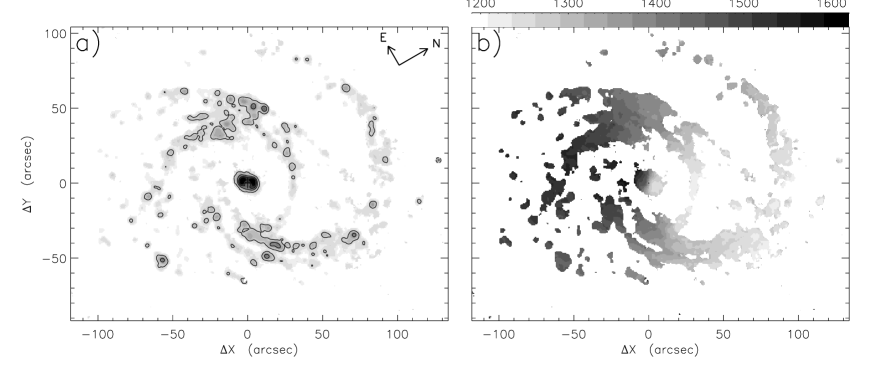
Figure 6 shows the FPI observations of the nearby spiral galaxy NGC 6951. The constructed velocity field is in good agreement with similar observations by Rozas et al. (2002). Here, the radial velocities were measured with an accuracy of about . For a detailed discussion of the data obtained, see Moiseev et al. (2004).
| object | SCORPIO measurements | Schmidt et al.(1992) | ||
|---|---|---|---|---|
| P, % | , ∘ | P, % | , ∘ | |
| BD+59d389 | ||||
| VICyg#12 | ||||
| BD+64d106 | ||||
| BD+28d4211 | – | – | ||
3.5 Polarization observations
In spectropolarimetric observations, a mask that forms a dotted slit is placed in front of the SCORPIO slit. The height of each slit is , and the separation between the slit centers is . After the introduction of a polarization analyzer in the beam, a series of pairs of spectra in mutually perpendicular polarization planes is obtained at the exit of the spectrograph. Comparing the spectra taken at different orientations of the analyzer, 0 and , we unambiguously determine the degree of linear polarization and the position angle of the polarization plane for the object as a function of the wavelength. Apart from the count statistics determined by the exposure, the actual accuracy of measuring the degree of polarization depends on the level of scattered light in the spectrograph, the accuracy of correcting the spectra for the flat field, the presence of ghosts in the analyzer (their level is about 0.2%), and the accuracy of extracting the spectra from the image.
As our measurements show, the measurement threshold for the degree of linear polarization in SCORPIO is 0.2-0.3%, and the measurement accuracy is 0.1-0.3% (depending on the exposure). Table 4 gives the measurements of polarization standards with VPHG550G (the dispersion is 2 Å) in the V band. The degrees of polarization that are compared with their published values were obtained by integrating the spectra in the V band.
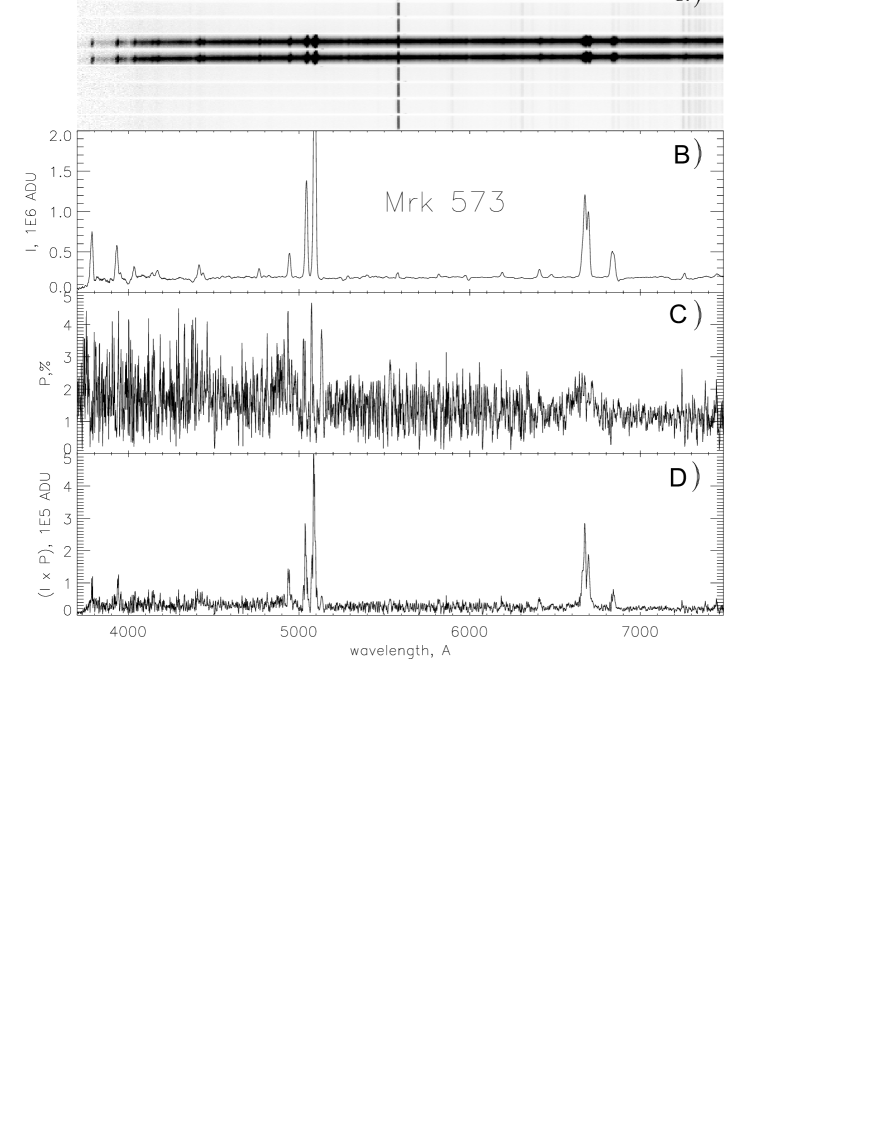
Figure 7 illustrates the integrated spectrum of the central region in Seyfert 2 galaxy Mrk 573 obtained when the SCORPIO polarization mode was tested in August 2004. This figure shows the wavelength dependence of the degree of linear polarization. The spectra were obtained at seeing with VPHG550G. We took a series of 10-min exposures at successive rotation angles of the analyzer (0 and ). The total exposure time was 2 h, and the total V-band brightness of the galactic nucleus in the slit was about . A broad component of the hydrogen lines is distinguished in Fig.7 (c). The result obtained is in satisfactory agreement with the observations of other authors (Nagao et al., 2004)
4 Data Reduction
The observational data are written in the FITS format. Various standard astronomical image reduction systems, such as MIDAS or IRAF, can be used for their reduction. The primary data reduction can be easily automated, since all of the necessary information about the spectrograph configuration is written in the FITS-headers. In the IDL environment, we wrote software packages for SCORPIO data reduction and analysis. The programs for the reduction of FPI, long-slit, and multiobject spectroscopy have a user-friendly interface and can be used by users that are not familiar with the IDL language itself. The reduction sequence of FPI observations with SCORPIO was described by Moiseev (2002).
In the reduction of observations, it is important to take into account the fringe pattern in the sensitive layer of the CCD array in the red spectral range (see above). In the case of spectroscopic observations, to correct this effect, the frames with the object’s spectra are divided by the frames with the accumulated spectra of the built-in lamp, a spectral flat field. In this way, the fringes can be reduced by more than an order of magnitude, which is enough in most cases. We can also get rid of the fringe pattern by the flat field division in the case of direct imaging, although using the frames illuminated by the inner lamp or the twilight sky as a flat field is often not enough, particularly in the case of broad-band filters, since the spectral energy distribution of the night-sky background emission differs markedly from that of the calibration frames. In this case, an optimal imaging technique is to form an image of the averaged interference pattern using a series of all accumulations in the corresponding filter during the observing night.
5 Further upgrading of the instrument
A standard autoguiding system using images on the TV-view (Shergin & Maksimova 2001) is used during observations with the 6-m telescope. It allows the displacement of stars in the field to be compensated by the corresponding motions of the entire telescope. This is a slow guiding, since the oscillations of the centers of stellar images at a frequency of 0.1 Hz are suppressed. In 2005, we planned to put into operation a fast guiding system based on a tip-tilt fused quartz plate. This system will allow the oscillations with frequencies up to 10 Hz to be compensated. This will make it possible to significantly reduce the effect of the telescope’s natural oscillations, thereby improving the quality of stellar images. For an example, using a local tip-tilt corrector at the Nasmyth-2 focus of the 6-m BTA telescope would allow the limiting magnitude of the spectrograph located there to be increased by (Ivanov et al., 2001).
Equipping the spectrograph with a “semi-thin” CCD detector seems promising. This detector combines the advantages of both “thick” (directly illuminated) devices, the absence of a interference pattern, and “thin” devices (back-illuminated) with a high quantum efficiency. Such a detector has a much smaller amplitude of fringes and a higher (up to 80% at 9000Å) sensitivity in the red spectral range, which will allow the SCORPIO efficiency to be increased during near-infrared observations.
6 Conclusions
The high efficiency of the new instrument has been confirmed
during its continuous practical use. Over the period from
September 2000 through November 2004, observations were performed
at the SAO on more than 240 nights; the results obtained were
used in 26 papers, three Ph.D. and two doctoral dissertations. A
more detailed description of the spectrograph and the observing
technique can be found in the paper by Afanasiev et al. (2004),
while the current description of the spectrograph is accessible
on the Internet at:
http://www.sao.ru/hq/moisav/scorpio/scorpio.html, a
continuously updated gallery of observed objects is also given
here. A similar instrument (but without the platform-adapter and
the multislit unit) produced at the SAO is being successfully
used in observations with the 2.6-m Byurakan Astrophysical
Observatory telescope (Armenia).
Acknowledgements.
We wish to thank the SAO administration for continuous support and attention when the instrument was designed and produced. Dodonov S.N. and Amirkhanyan V.R. for fruitful discussions in making the instrument, and Gazhur E.B., Zhelenkov S.R., Perepelitsyn E.I., and Fateev V.I., who produced and adjusted the individual parts of the spectrograph; to the administration of the Institute of Astronomy RAS for making available of VPH gratings. This work was supported in part by the “Astronomy” Federal Science and Technology Program (contract no. 40.022.1.1.1101 from February 1, 2002), the INTAS grant (96-0315) and the Program of the Department of Physical Sciences of the Russian Academy of Sciences. And the Program of the Department of Physical Sciences of the Russian Academy of Sciences. Moiseev A.V. wishes to thanks the Russian Science Support Foundation and the Russian Foundation for Basic Research (project no.04-02-16042) for partial support of the work.References
- [1] Afanas’ev V.L., Dodonov S.N., Moiseev A.V., Verkhodanov O.V., Kopylov A.I., Pariiskii Yu.N., Soboleva N.S., Temirova A.V., Zhelenkova O.P., Goss W.M., 2003a, Astron. Reports, 47, 377
- [2] Afanas’ev V.L., Dodonov S.N., Moiseev A.V., Chavushyan, V., Mujica, R., Juarez, Y., Gorshkov, A.G., Konnikova, V. K., Mingaliev, M. G., 2003b, Astron. Letters, 29, 579
- [3] Afanas’ev V.L., Gazhur E.B., Zhelenov S.R., Moiseev A.V., 2004, Bull. SAO, vol. 58
- [4] Aguerri J. A.L., Debattista V. P., Corsini E.M., 2003, MNRAS, 338., 465
- [5] Amirkhanyan, V.R, Afanas’ev V.L., Dodonov S.N., Moiseev A.V., Mikhailov V.P., 2004, Astron. Letters, 30, 834
- [6] Barden S.C, Arns J.A., Colburn W.S., and Williams J.B., 2000, PASP, 112, 809
- [7] Bessell, M.S., 1990, PASP, 102, 1181
- [8] Buzzoni, B., Delabre B., Dekker H., et al., 1984, ESO Messenger (ISSN 0722-6691), Dec. 1984, 9.
- [9] Courtés, G., 1960, Ann. d’Astrophysics, 23, 115
- [10] Courtés, G., 1964, AJ, 69, 325
- [11] Fatkhullin T.A., 2002, Bull. SAO, 53, 5
- [12] Ivanov A.A., Panchuk V.E., Shergin V.S., 2001, Preprint SAO RAS, No.155
- [13] Lozinskaya T.A., Arkhipova V.P., Moiseev A.V., Afanasiev V.L., 2002, Astron. Reports, 46, 16
- [14] Moiseev A.V., 2002, Bull. SAO, 54, 74 (astro-ph/0211104)
- [15] Moiseev A.V., Valdés J.R., Chavushyan V.O., 2004, A&A, 421, 433
- [16] Nagao, T., Kawabata, K.S., Murayama, T. et al., 2004, AJ, 128, 109
- [17] Neistein E., Maoz D., Rix H.-W., Tonry J.L., 1999, AJ, 117, 2666
- [18] Nicklas H., Seifert W., Boehnhardt, H., Kiesewetter-Koebinger, S., Rupprecht, G., 1997, Proc. SPIE, 2871, in ”Optical Telescopes of Today and Tomorrow” (Eds. Arne L. Ardeberg), Nordic Optical Telescope SA (Sweden), 1222
- [19] Rozas M., Relano M., Zurita A., Beckman J.E., 2002, A&A, 386, 42
- [20] Schmidt G.D., Elston R., Lupie O.L.), 1992, AJ, 104, 1563
-
[21]
Shergin V.S., Maksimova V.M., 2001, Autoguiding Program TV guide.
User’s guide SAO (
http://www.sao.ru/hq/vsher/vsher_ru.html)
Translated by V. Astakhov, V. Shapoval