Gemini Near Infrared Spectrograph Observations of a Red Star Forming Galaxy at : Evidence for Shock-Ionization due to a Galactic Wind11affiliation: Based on observations obtained at the Gemini Observatory, which is operated by the Association of Universities for Research in Astronomy, Inc., under a cooperative agreement with the NSF on behalf of the Gemini partnership.
Abstract
Recent studies have shown that -luminous galaxies at have high H line widths and high [N ii] / H ratios. If these lines arise from photo-ionization by massive stars in H ii regions these results imply that massive, metal rich galaxies exist at high redshift. Here we investigate the ionization mechanism in a galaxy with and in the Chandra Deep Field South, using the new Gemini Near Infrared Spectrograph (GNIRS). GNIRS’ cross-dispersed mode gives simultaneous access to the entire m – m wavelength range, allowing accurate measurements of line ratios of distant galaxies. From the ratio of H / H we infer that the line emitting gas is heavily obscured, with . The reddening is higher than that inferred previously from the UV-optical continuum emission, consistent with findings for nearby star burst galaxies. We find that the galaxy has Seyfert-like line ratios, [N ii] / H and [O iii] / H, which can be caused by photo-ionization by an active galactic nucleus (AGN) or shock ionization due to a strong galactic wind. Although we cannot exclude the presence of an AGN, the lack of AGN spectral features in the rest-frame ultraviolet, the consistency of radio, X-ray, and rest-frame UV star formation indicators, the fact that the [O iii] / H ratio remains high out to kpc from the nucleus, and the observed gas kinematics all argue for the wind hypothesis. Similar shock-induced ionization is seen in nearby star burst galaxies with strong winds, such as NGC 1482 and NGC 3079. The evidence for shock ionization implies that measurements of metallicities and dynamical masses of star forming galaxies should be regarded with caution, especially since the existence of strong galactic winds in these objects is well established. Based on Sloan Digital Sky Survey data for nearby galaxies and the limited data available at high redshift we speculate that the effects of shocks may correlate with dust content. The results presented here demonstrate the importance of measuring the full rest-frame optical spectra of high redshift galaxies, and showcase the potential of GNIRS for such studies.
1 Introduction
Near-infrared (NIR) spectroscopy provides valuable information on the stellar populations and kinematics of galaxies at , as it gives access to rest-frame optical emission lines that have been studied extensively in the local Universe. NIR spectra of optically- and NIR-selected galaxies at have constrained or measured their star formation rates, metallicities, wind velocities, and masses (e.g., Pettini et al. 2001; Erb et al. 2003; van Dokkum et al. 2004; Shapley et al. 2004). Among the most surprising results is the finding that apparently mature galaxies with H line widths of km s-1and [N ii] / H ratios of already existed at (van Dokkum et al. 2004; Shapley et al. 2004).
The interpretation rests on the assumption that the emission lines arise from photo-ionization by massive stars in H ii regions (see, e.g., Erb et al. 2003; Shapley et al. 2004). In the local Universe this assumption is valid for the majority of star forming galaxies, but not for all. The [N ii] / H ratio can be influenced by photo-ionization by an AGN continuum, shock ionization caused by the interaction of outflowing gas with the ambient interstellar medium, photo-ionization by hot, high metallicity stars in a dense environment, and other processes (see, e.g., Veilleux et al. 1994, and references therein). The potential effects of shock ionization are particularly relevant, as the existence of large scale outflows in star forming galaxies at is well established (e.g., Franx et al. 1997; Pettini et al. 1998, 2001). The ionization source cannot be constrained from [N ii] / H alone (although values larger than point to other mechanisms than photo-ionization in H ii regions), and the “standard” method of spectral classification relies on combinations of line ratios such as [N ii] / H and [O iii] / H (e.g., Baldwin, Phillips, & Terlevich 1981; Veilleux & Osterbrock 1987).
Measuring these line combinations at high redshift is difficult due to the limited wavelength coverage of most existing NIR spectrographs on large telescopes. In this Letter, we use the newly commissioned Gemini Near Infrared Spectrograph (GNIRS) to study the line ratios of a -selected star forming galaxy at in the Chandra Deep Field South (CDF-S). GNIRS can be operated in cross-dispersed mode, which produces spectra over the entire 1 m – 2.5 m wavelength range at a resolution of . GNIRS thus allows simultaneous measurement of rest-frame optical lines falling in the , , and bands through identical atmosphere and aperture on the sky, and hence accurate and efficient determinations of line ratios.
2 Spectroscopy
We observed galaxy CDFS-695 on 2004 September 2–3 UT with GNIRS on Gemini-South, under mostly clear skies with image quality . The galaxy was selected because of its -magnitude and red color. It has and (S. Wuyts et al., in preparation), and is one of the most luminous members of the Distant Red Galaxy (DRG) class (Franx et al. 2003; van Dokkum et al. 2003) in the CDF-S. After measuring the redshift with GNIRS we realized that the galaxy is object 5 in the Daddi et al. (2004) sample of -selected star forming galaxies. We note that Daddi et al. (2004) give a slightly bluer color of for this object; we cannot determine the source of this small discrepancy.
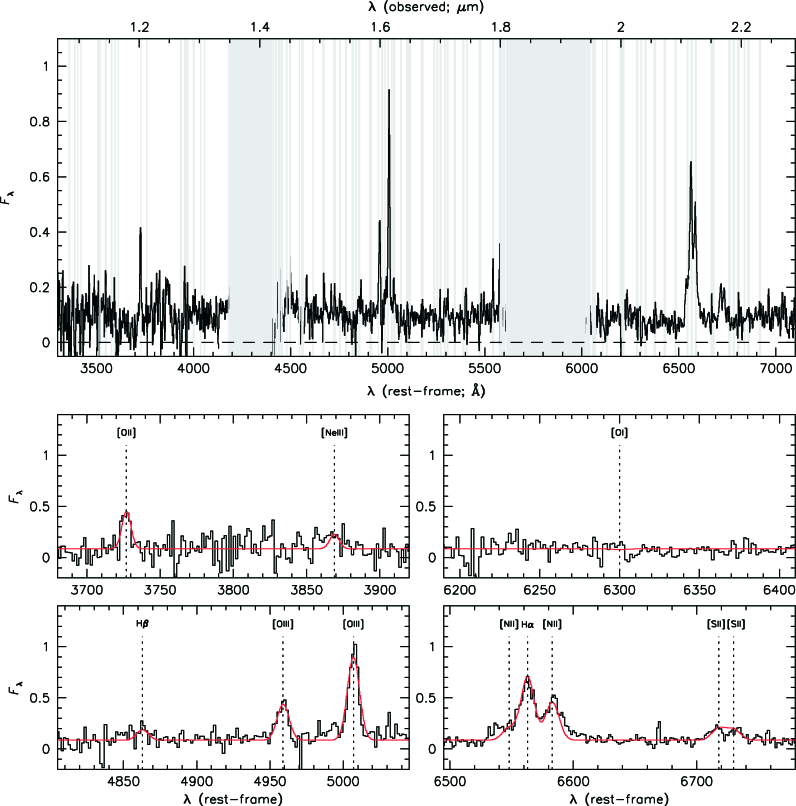
GNIRS was operated in cross-dispersed mode, using the short camera with the 32 lines mm-1 grating and the slit. Between individual s exposures the objects was moved along the slit in an ABA′B′ pattern, with A′ and B′ small () perturbations of A and B. The total exposure time was 5500 s. The data reduction used a combination of standard procedures and custom software, and is described in M. Kriek et al., in preparation. The reduced spectrum is shown in Fig. 1. The continuum is clearly detected along with familiar rest-frame optical emission lines, which provide a redshift . This high quality spectrum demonstrates the potential of GNIRS for studies of faint objects, and specifically for measuring redshifts of -selected galaxies.
Line fluxes were determined from the residual emission after subtraction of a linear fit to the continuum, with errors estimated from repeat measurements in empty regions. Equivalent widths were determined from a direct comparison of the line fluxes to the continuum fits, and the line fluxes were calibrated by comparing the measured total magnitude to a synthetic magnitude determined from the GNIRS spectrum. This method assumes that the line emitting gas has the same distribution as the continuum emission, and we estimate that the systematic error is %. Finally, line luminosities were calculated using , , and km s-1 Mpc-1. Fluxes, luminosities, and rest-frame equivalent widths are listed in Table 1. Errors do not include a % uncertainty in the overall normalization of the spectrum (which cancels for line ratios).
3 Reddening
The reddening of the line-emitting gas can be derived from the Balmer decrement, after correcting for underlying continuum absorption at H and H. Stellar populations with ages Gyr (Förster Schreiber et al. 2004; Daddi et al. 2004) have Balmer absorption equivalent widths of Å. The corresponding corrections to the measured line luminosities are a factor of for H and a factor of for H, and the corrected ratio H / H. Assuming an intrinsic ratio of 2.76, which is valid for H ii regions and also holds to good approximation for shock ionized regions (Binette, Dopita, & Tuohy 1985), the reddening . This large value is consistent with previous indirect determinations for DRGs (van Dokkum et al. 2004; Förster Schreiber et al. 2004).
The reddening of the line-emitting gas can be compared to that of the stellar continuum emission. Daddi et al. (2004) derive for the continuum of CDFS-695, from SED fits. This difference between the reddening of the line-emitting gas and the continuum is consistent with previous results for nearby star burst galaxies (Calzetti 1997) and DRGs (van Dokkum et al. 2004).
![[Uncaptioned image]](/html/astro-ph/0502082/assets/x2.png)
Diagnostic diagram for spectral classification. Small dots are nearby galaxies from the SDSS. Galaxies to the left of the dotted line are normal star forming galaxies (Kauffmann et al. 2003). The red symbol is CDFS-695, which has a Seyfert-like spectrum. The grids show shock ionization models from Dopita & Sutherland (1995), with and without a precursor region. Histograms show measurements for DRGs (van Dokkum et al. 2004) and LBGs at ([N ii] / H; Shapley et al. 2004) and ([O iii] / H; Pettini et al. 1998; 2001). The blue symbol is the LBG MS 1512-cB58 (Teplitz et al. 2000). The top panels show SDSS galaxies binned by reddening: the most dusty galaxies often have LINER/Seyfert-like line ratios.
4 Spectral Classification
Galaxies whose emission lines arise from photo-ionization in H ii regions follow a well-defined sequence in diagrams involving the line ratios [O iii] / H, [N ii] / H, [S ii] / H, and [O i] / H, largely because of strong correlations between ionization parameter and metallicity (e.g., Veilleux & Osterbrock 1987). The diagnostic diagram of [O iii] / H versus [N ii] / H is particularly useful, as these lines are relatively strong and reddening corrections are small.
Figure 3 shows the distribution of nearby galaxies in this diagram using data from the Sloan Digital Sky Survey DR2 (Kauffmann et al. 2003; Tremonti et al. 2004). The line ratios were corrected for reddening, and only the galaxies for which all four lines are detected at are shown. The dotted line shows the separation between H ii type emission and LINER/Seyfert type emission as adopted by Kauffmann et al. (2003). The emission lines of galaxies to the right of this line are affected or dominated by other sources of ionization than massive stars – in most cases an active nucleus.
The solid red symbol in Fig. 3 shows the reddening-corrected lineratios of CDFS-695. Its [N ii] / H ratio of and [O iii] / H ratio of place the galaxy firmly in the Seyfert region (see, e.g., Veilleux & Osterbrock 1987).
TABLE 1
Emission Lines
| Line | (Å) | ||||
|---|---|---|---|---|---|
| [O ii] | 3727 | 33 | 8.0 | 3.0 | 0.2 |
| Ne iii | 3869 | 13 | 3.2 | 1.2 | 0.4 |
| H | 4863 | 12 | 2.9 | 1.1 | 0.4 |
| [O iii] | 4959 | 43 | 10 | 3.9 | 0.1 |
| [O iii] | 5007 | 99 | 24 | 9.0 | 0.1 |
| O i | 6300 | — | |||
| [N ii] | 6548 | 27 | 6.4 | 2.4 | 0.2 |
| H | 6563 | 99 | 24 | 9.0 | 0.1 |
| [N ii] | 6583 | 60 | 14 | 5.4 | 0.1 |
| S ii | 6718 | 19 | 4.5 | 1.7 | 0.2 |
| S ii | 6730 | 17 | 4.1 | 1.6 | 0.2 |
a Flux in units of ergs s-1 cm-2.
b Luminosity in units of ergs s-1.
c Relative uncertainty in flux and luminosity.
5 Ionization Mechanism
The most straightforward interpretation is that the line emission arises from ionization by the power-law continuum of an AGN. As the line widths are only km s-1 the galaxy would be a Type II quasar (QSO) (e.g., Stern et al. 2002), with the broad line region hidden by dust. However, other explanations are also possible. In particular, ionization due to fast radiative shocks naturally produces LINER or Seyfert-like line ratios (see, e.g., Dopita & Sutherland 1995).
Whereas it is difficult to unambiguously identify a Type II AGN in the rest-frame optical, it can be straightforward in X-rays, radio, and/or the rest-frame ultra-violet (UV). The rest-UV spectrum is especially important: Seyfert II galaxies (and known type II QSOs) typically have featureless continua with strong emission lines of Ly and high-ionization species such as N v, C iv, and [Ne iv] (Kinney et al. 1991). Daddi et al. (2004) obtained a high quality rest-frame UV spectrum of CDFS-695. The spectrum is similar to those of normal star forming galaxies, and shows no AGN features: Ly is in absorption, and familiar rest-frame UV absorption lines such as Si iv are strong. The star formation rate implied by the de-reddened UV continuum is yr-1, in good agreement with the star formation rate implied by its (soft) X-ray flux and its radio emission (Daddi et al. 2004). In summary, there is no evidence for the presence of an AGN other than the unusual rest-frame optical line ratios.
Although we cannot exclude a hidden AGN (or an AGN that has recently turned off) as the ionization source, shock ionization is a plausible alternative. The solid line in Fig. 3 shows shock models from Dopita & Sutherland (1995). The “shock + precursor” models predict similar line ratios as those observed. In these models the high [N ii] / H ratios are produced by the shock itself, and the high [O iii] / H ratios arise from photo-ionization of preshock regions by extreme UV and X-ray photons generated in the shock.
The shock interpretation is supported by the behavior of the emission lines at large distances from the nucleus. As shown in Fig. 5 the lines can be traced to kpc from the nucleus, and the line ratios remain Seyfert-like: we find [N ii] / H and [O iii] / H in the outer regions of the galaxy. The null or inverted gradient in [O iii] / H is difficult to explain if photo-ionization from the nucleus is the cause.
Furthermore, there is direct evidence for a strong galactic wind which can provide the mechanical energy for the shocks: the velocity difference between rest-frame UV absorption lines (Daddi et al. 2004) and rest-frame optical emission lines implies a wind velocity of km s-1, and the width and tilt of the rest-frame optical emission lines demonstrate gas motions of km s-1. A natural origin of the wind is the combined effects of supernovae and winds from massive stars. Local analogs to CDFS-695 could be NGC 3079, which has a windblown “superbubble” of diameter 1.1 kpc displaying similar line ratios as CDFS-695 (Veilleux et al. 1994), and NGC 1482, in which the entire (bi-polar) wind appears to be shock-excited (Veilleux & Rupke 2002).
![[Uncaptioned image]](/html/astro-ph/0502082/assets/x3.png)
Two-dimensional spectrum showing position along the -axis and wavelength along the -axis, in the vicinity of m and m. Negative images are caused by the dither pattern within the slit. The emission lines are clearly extended in the spatial direction, and show a pronounced velocity gradient. Line ratios remain Seyfert-like even at large distances from the center of the galaxy.
6 Discussion
Whatever the cause of the Seyfert-like line ratios, the implication is that the interpretation of the rest-frame optical emission lines in this galaxy is more complicated than is usually assumed. Metallicity indicators such as [N ii] / H, the index, and the [O iii] / [N ii] index (e.g., Pettini & Pagel 2004) would produce erroneous results. Using only the -band spectrum we would derive a low metallicity, and using only the -band spectrum we would infer a high metallicity. The H kinematics are probably also influenced by the outflow and may not trace the potential (Veilleux et al. 1994). Finally, the H luminosity can be shock-enhanced and cannot simply be converted to a star formation rate. The extinction-corrected H luminosity, ergs s-1, would imply a star formation rate of yr-1 (Kennicutt 1998). However, the luminosity produced in the shock is of the same order as the observed luminosity: , with cm-3, km s-1, and pc2 (Binette et al. 1985).
A critical question is whether CDFS-695 is exceptional or typical. Its [N ii] / H ratio is similar to the three other DRGs for which these lines have been measured (see Fig. 3), suggesting LINER/Seyfert like line ratios may be common in red galaxies. In Lyman break galaxies (LBGs) at this ratio is usually lower (Erb et al. 2003), even for the subsample with (Shapley et al. 2004). It is interesting to note that the [O iii] / H ratios of LBGs at are very high (Pettini et al. 2001; see Fig. 3), although still consistent with the low metallicity tail of the distribution of normal galaxies. The only LBG for which both line ratios have been measured so far is the lensed galaxy cb58 (Teplitz et al. 2000). It falls on the relation defined by normal star forming galaxies in Fig. 3, but there is a factor of difference between the N abundance inferred from the [N ii] emission and from the N i absorption in the rest-frame UV (Pettini et al. 2002). This may hint at low-level effects of shocks, but other explanations are also possible.
The effects of shocks and possibly AGN may be more important for the dusty DRGs than for LBGs. The top panels in Fig. 3 show the distributions of SDSS galaxies binned by reddening. Interestingly, a large fraction of the most obscured galaxies show LINER and Seyfert-like line ratios, qualitatively consistent with earlier results for luminous infrared galaxies (Heckman et al. 1987). Submm galaxies at high redshift exhibit a large range in [N ii] / H ratio (Swinbank et al. 2005), and it will be interesting to see where they fall on diagnostic diagrams like Fig. 3. More generally, it is clearly important to measure combinations of line ratios for a large, homogeneous sample of galaxies, and to investigate correlations with dust content, kinematics, stellar mass and nuclear activity. As demonstrated in this Letter, Gemini/GNIRS is very well suited for such studies.
References
- (1)
- (2) Baldwin, J. A., Phillips, M. M., & Terlevich, R. 1981, PASP, 93, 5
- (3)
- (4) Binette, L., Dopita, M. A., & Tuohy, I. R. 1985, ApJ, 297, 476
- (5)
- (6) Calzetti, D. 1997, AJ, 113, 162
- (7)
- (8) Daddi, E., et al. 2004, ApJ, 600, L127
- (9)
- (10) Dopita, M. A. & Sutherland, R. S. 1995, ApJ, 455, 468
- (11)
- (12) Erb, D. K., et al. 2003, ApJ, 591, 101
- (13)
- (14) Förster Schreiber, N. M., et al. 2004, ApJ, 616, 40
- (15)
- (16) Franx, M., Illingworth, G. D., Kelson, D. D., van Dokkum, P. G., & Tran, K. 1997, ApJ, 486, L75
- (17)
- (18) Franx, M., et al. 2003, ApJ, 587, L79
- (19)
- (20) Heckman, T. M., Armus, L., & Miley, G. K. 1987, AJ, 93, 276
- (21)
- (22) Kauffmann, G., et al. 2003, MNRAS, 346, 1055
- (23)
- (24) Kinney, A. L., Antonucci, R. R. J., Ward, M. J., Wilson, A. S., & Whittle, M. 1991, ApJ, 377, 100
- (25)
- (26) Pettini, M., Kellogg, M., Steidel, C. C., Dickinson, M., Adelberger, K. L., & Giavalisco, M. 1998, ApJ, 508, 539
- (27)
- (28) Pettini, M., et al. 2001, ApJ, 554, 981
- (29)
- (30) Pettini, M., Rix, S. A., Steidel, C. C., Adelberger, K. L., Hunt, M. P., & Shapley, A. E. 2002, ApJ, 569, 742
- (31)
- (32) Pettini, M., & Pagel, B. E. J. 2004, MNRAS, 348, L95
- (33)
- (34) Shapley, A. E., Erb, D. K., Pettini, M., Steidel, C. C., & Adelberger, K. L. 2004, ApJ, 612, 108
- (35)
- (36) Stern, D., et al. 2002, ApJ, 568, 71
- (37)
- (38) Swinbank, A. M., Smail, I., Chapman, S. C., Blain, A. W., Ivison, R. J., & Keel, W. C., 2005, ApJ, in press (astro-ph/0412050)
- (39)
- (40) Teplitz, H. I., et al. 2000, ApJ, 533, L65
- (41)
- (42) Tremonti, C. A., et al. 2004, ApJ, 613, 898
- (43)
- (44) van Dokkum, P. G., et al. 2003, ApJ, 587, L83
- (45)
- (46) van Dokkum, P. G., et al. 2004, ApJ, 611, 703
- (47)
- (48) Veilleux, S., Cecil, G., Bland-Hawthorn, J., Tully, R. B., Filippenko, A. V., & Sargent, W. L. W. 1994, ApJ, 433, 48
- (49)
- (50) Veilleux, S. & Osterbrock, D. E. 1987, ApJS, 63, 295
- (51)
- (52) Veilleux, S. & Rupke, D. S. 2002, ApJ, 565, L63
- (53)